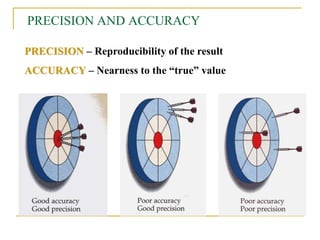
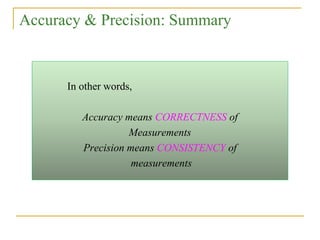
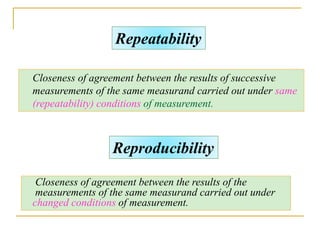
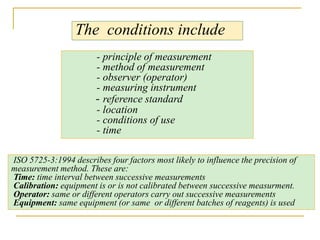
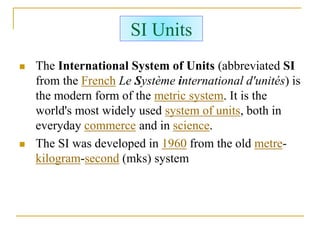
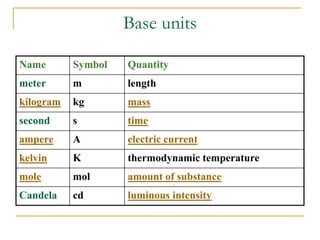
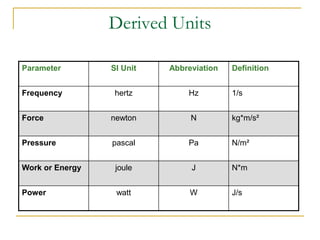
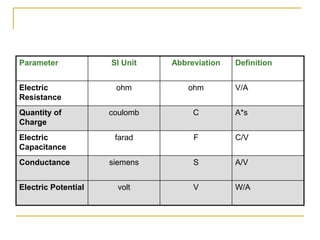
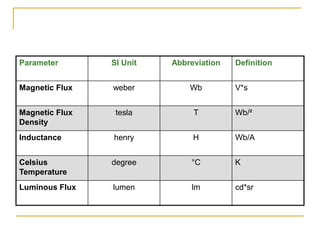
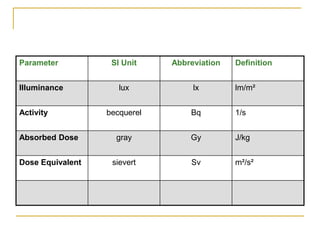
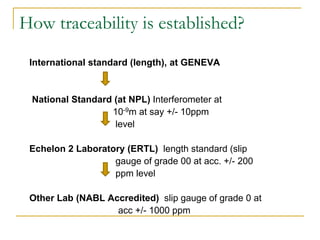
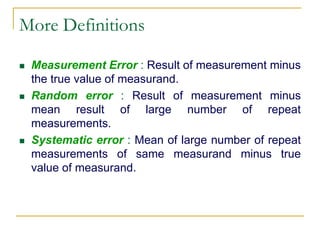
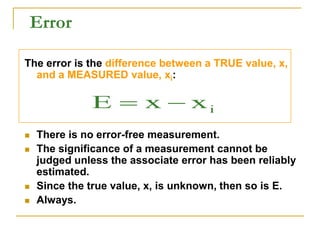
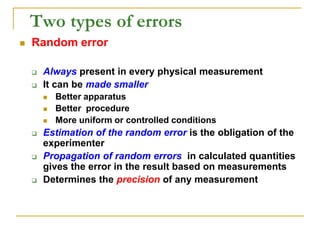
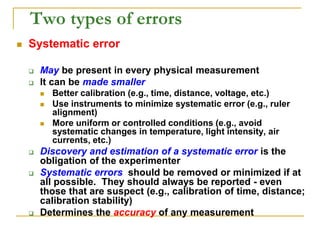
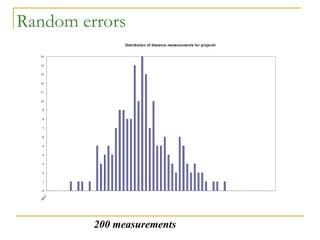
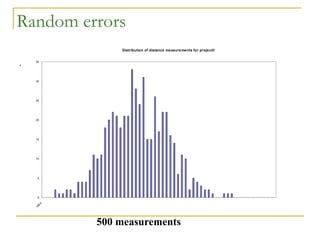
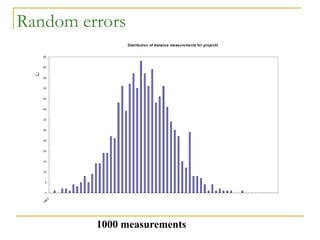
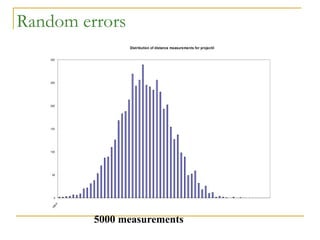
EXPRESSION OF UNCERTAINTY
IN MEASUREMENT AND INTER-
LAB COMPARISON/
PROFICIENCY TESTING
Awot G.
"As far as the laws of mathematics refer to reality,
they are not certain;
and as far as they are certain, they do not refer to
reality.”
Albert Einstein (1879 – 1955)
METROLOGY: THE SCIENCE OF
MEASUREMENTS
Metrology (from Greek 'metron' (measure), and
'logos' (study of)) is the science of measurement.
Metrology embraces Both experiment and
theoretical determinations at any level of
uncertainty in any field of Science and
Technology.
METROLOGY
All pervasive nature of measurements
Most people do not realize the important role played by
metrology and associated institutions in our daily life
Classification:
- industrial metrology
- scientific metrology
- Legal metrology
Cont….
Another view of classification:
- Physical metrology
- Chemical Metrology
Globally operating metrology and testing
system
 Uniform system of harmonized leg regulation: WTO/OIML
 Uniform system of harmonized standards: ISO/IEC
 Worldwide recognition of traceability measurement results
on the basis of SI : CIPM/BIPM
 Harmonization of requirements concern in competence of
test labs and certification bodies: ILAC/IAF
Hierarchy of International Metrology
Organization
Treaty of meter
General Conference on Weights and Measures (CGPM)
International Committee for
Weights and Measures (CIPM)
International Bureau of Weights
and Measures (BIPM)
Consultative
Committees
What is measurement?
Interlinked activity
(Measurement)
Measurement is a process and output of that
process is result of measurement
Measurement related issued
 Extensively in demand but often go unnoticed
 Effect human lives, as common citizens and consumers ,
in many ways as:
- Trade and consumer protection
- Safety and health care
- Environmental protection
- Law and order
It is a qualitative concept.
Some Definitions
Value that is perfectly consistent with the definition of a given
specific quantity.
Value of a measured characteristics that would be obtained by an
ideal and perfect measurement system
Perfect measurement system do not exist hence true value by
nature is indeterminate.
True Value
Accuracy
Again, since the TRUE value is unknown, neither is
the maximum deviation. The accuracy is only an
estimate of the worst error.
i
x
x
max
of
estimate
accuracy 

The accuracy is a measure (or an estimate) of the
maximum deviation of measured values, xi, from
the TRUE value, x:
Usually expressed as a %-age, e.g. “accurate to 5%”
Precision
 There is no true value here.
 Precision is a characteristic of our measurement.
 In everyday language: “accuracy” ≡ “precision”. In error
analysis: “accuracy” ≠ “precision”
i
x
x
max
of
estimate
precision 

The precision is a measure (or an estimate) of the
consistency (or repeatability).
Thus it is the maximum deviation of a reading
(measurement), xi, from its mean value, x:
PRECISION AND ACCURACY
PRECISION – Reproducibility of the result
ACCURACY – Nearness to the “true” value
Accuracy & Precision: Summary
In other words,
Accuracy means CORRECTNESS of
Measurements
Precision means CONSISTENCY of
measurements
Closeness of agreement between the results of successive
measurements of the same measurand carried out under same
(repeatability) conditions of measurement.
Repeatability
Reproducibility
Closeness of agreement between the results of the
measurements of the same measurand carried out under
changed conditions of measurement.
- principle of measurement
- method of measurement
- observer (operator)
- measuring instrument
- reference standard
- location
- conditions of use
- time
The conditions include
ISO 5725-3:1994 describes four factors most likely to influence the precision of
measurement method. These are:
Time: time interval between successive measurements
Calibration: equipment is or is not calibrated between successive measurment.
Operator: same or different operators carry out successive measurements
Equipment: same equipment (or same or different batches of reagents) is used
Calibration
Calibration is the act of checking or adjusting
(by comparison with a standard) the accuracy
of a measuring instrument
SI Units
 The International System of Units (abbreviated SI
from the French Le Système international d'unités) is
the modern form of the metric system. It is the
world's most widely used system of units, both in
everyday commerce and in science.
 The SI was developed in 1960 from the old metre-
kilogram-second (mks) system
 The foundation of modern metrology is the International
System of Units (SI), which is used internationally to
define the fundamental units of measurement. These are
used to derive other units and are used to define other
measurement units, such as may be used locally.
 The SI consists of 7 base and number of derived units:
Base units
Name Symbol Quantity
meter m length
kilogram kg mass
second s time
ampere A electric current
kelvin K thermodynamic temperature
mole mol amount of substance
Candela cd luminous intensity
Derived Units
Parameter SI Unit Abbreviation Definition
Frequency hertz Hz 1/s
Force newton N kg*m/s²
Pressure pascal Pa N/m²
Work or Energy joule J N*m
Power watt W J/s
Parameter SI Unit Abbreviation Definition
Electric
Resistance
ohm ohm V/A
Quantity of
Charge
coulomb C A*s
Electric
Capacitance
farad F C/V
Conductance siemens S A/V
Electric Potential volt V W/A
Parameter SI Unit Abbreviation Definition
Magnetic Flux weber Wb V*s
Magnetic Flux
Density
tesla T Wb/²
Inductance henry H Wb/A
Celsius
Temperature
degree °C K
Luminous Flux lumen lm cd*sr
Parameter SI Unit Abbreviation Definition
Illuminance lux lx lm/m²
Activity becquerel Bq 1/s
Absorbed Dose gray Gy J/kg
Dose Equivalent sievert Sv m²/s²
Realization in Indian scenario
 The realization of all these units is done by
calibration of the measuring instruments,
maintained through the unbroken chain of
measurements from the base standard to main the
traceability
 In India, NPL is custodian of all standards (Except
Radiation), BARC is custodian of Radiation related
standards.
Treaceability
The property of the result of a measurement or
the value of a standard whereby it can be
related to stated references, usually national
or international standards, through an
unbroken chain of comparisons all having
stated uncertainties.
How traceability is established?
International standard (length), at GENEVA
National Standard (at NPL) Interferometer at
10-9m at say +/- 10ppm
level
Echelon 2 Laboratory (ERTL) length standard (slip
gauge of grade 00 at acc. +/- 200
ppm level
Other Lab (NABL Accredited) slip gauge of grade 0 at
acc +/- 1000 ppm
Standard Platinum Iridium metal bar
Transfer of length std.
The iodine stabilized HeNe
laser operating at 633 nm is
the most common because
it is convenient to operate,
accurate to
2.5 parts in 1011, and is
used to calibrate
commercial displacement
measuring interferometer
systems
Slip gauges (tungsten carbide)
Working standards
 Measurement Error : Result of measurement minus
the true value of measurand.
 Random error : Result of measurement minus
mean result of large number of repeat
measurements.
 Systematic error : Mean of large number of repeat
measurements of same measurand minus true
value of measurand.
More Definitions
Error
The error is the difference between a TRUE value, x,
and a MEASURED value, xi:
 There is no error-free measurement.
 The significance of a measurement cannot be
judged unless the associate error has been reliably
estimated.
 Since the true value, x, is unknown, then so is E.
 Always.
i
x
x
E 

Two types of errors
 Random error
 Always present in every physical measurement
 It can be made smaller
 Better apparatus
 Better procedure
 More uniform or controlled conditions
 Estimation of the random error is the obligation of the
experimenter
 Propagation of random errors in calculated quantities
gives the error in the result based on measurements
 Determines the precision of any measurement
Two types of errors
 Systematic error
 May be present in every physical measurement
 It can be made smaller
 Better calibration (e.g., time, distance, voltage, etc.)
 Use instruments to minimize systematic error (e.g., ruler
alignment)
 More uniform or controlled conditions (e.g., avoid
systematic changes in temperature, light intensity, air
currents, etc.)
 Discovery and estimation of a systematic error is the
obligation of the experimenter
 Systematic errors should be removed or minimized if at
all possible. They should always be reported - even
those that are suspect (e.g., calibration of time, distance;
calibration stability)
 Determines the accuracy of any measurement
Random error
For instance, if you conduct a measurement many thousand
times (using different instruments and/or observers and/or
samples) you would expect to have random errors affecting
your measurement in either direction roughly the same
number of times
 Electrical noise in a circuit generally produces a voltage error
that may be positive or negative by a small amount.
 By counting the total number of pennies in a large container,
one may occasionally pick up two and only count one (or vice
versa).
A random error is just that – random !
Random errors
Random errors and the standard deviation
 All measurements have random error.
 Consider an example.
 Measure the range of a projectile shot from a gun
 Use this to calculate the velocity when the
projectile left the gun
 Make one measurement (202.4 cm) ; what is the
error?
 Meter stick will give ~3 mm error.
 How might we find out whether this is
reasonable?
 Make repeated measurements of the range --
Random errors
.
40 measurements
Distribution of distance measurements for projectile
0
1
2
3
4
5
6
7
8
9
10
1
9
8
.
0
1
9
8
.
6
1
9
9
.
2
1
9
9
.
8
2
0
0
.
4
2
0
1
.
0
2
0
1
.
6
2
0
2
.
2
2
0
2
.
8
2
0
3
.
4
2
0
4
.
0
2
0
4
.
6
2
0
5
.
2
2
0
5
.
8
2
0
6
.
4
2
0
7
.
0
2
0
7
.
6
2
0
8
.
2
2
0
8
.
8
2
0
9
.
4
2
1
0
.
0
Distance (cm)
Frequency
Random errors
Distribution of distance measurements for projectile
0
1
2
3
4
5
6
7
8
9
10
11
12
13
14
15
1
9
8
.
0
100 measurements
Random errors
Distribution of distance measurements for projectile
0
1
2
3
4
5
6
7
8
9
10
11
12
13
14
15
1
9
8
.
0
200 measurements
Random errors
.
Distribution of distance measurements for projectile
0
5
10
15
20
25
30
35
1
9
8
.
0
500 measurements
Random errors
 .
Distribution of distance measurements for projectile
0
5
10
15
20
25
30
35
40
45
50
55
60
65
198.0
1000 measurements
Random errors
Distribution of distance measurements for projectile
0
50
100
150
200
250
300
1
9
8
.
0
5000 measurements
Random errors
10000 measurements
Distribution of distance measurements for projectile
0
50
100
150
200
250
300
350
400
450
500
550
600
198.0
Random errors
10000 measurements
Distribution of distance measurements for projectile
0
50
100
150
200
250
300
350
400
450
500
550
600
1
9
8
.
0
1
9
8
.
6
1
9
9
.
2
1
9
9
.
8
2
0
0
.
4
2
0
1
.
0
2
0
1
.
6
2
0
2
.
2
2
0
2
.
8
2
0
3
.
4
2
0
4
.
0
2
0
4
.
6
2
0
5
.
2
2
0
5
.
8
2
0
6
.
4
2
0
7
.
0
2
0
7
.
6
2
0
8
.
2
2
0
8
.
8
2
0
9
.
4
2
1
0
.
0
Distance (cm)
Frequency
Random errors
10000 measurements
Distribution of distance measurements for projectile
0.0000
50.0000
100.0000
150.0000
200.0000
250.0000
300.0000
350.0000
400.0000
450.0000
500.0000
550.0000
600.0000
197.0 198.0 199.0 200.0 201.0 202.0 203.0 204.0 205.0 206.0 207.0 208.0 209.0 210.0 211.0
Distance (cm)
Frequency
±1
Mean
±2s ; 95%
Standard
deviation
Random errors
Interpretation
 If you repeat this measurement many times (e.g., 100,
10,000) you would find that
 68.3% of all these measurements will be within ± 1 g,
and,
 95% of all these measurements will be within ± 2 g
of your quoted (measured) value, g.
The probability that a normal random variable takes a value
within one standard deviation of its mean is about 68%.
The 68 – 95 – 99.7 Rule
The probability that a normal random variable takes a value
within two standard deviations of its mean is about 95%.
The 68 – 95 – 99.7 Rule
The probability that a normal random variable takes a value
within three standard deviations of its mean is about 99.7%.
The 68 – 95 – 99.7 Rule
Statistics
 Now throw 100 coins…
0
0.01
0.02
0.03
0.04
0.05
0.06
0.07
0.08
0.09
0 10 20 30 40 50 60 70 80 90 100
Number of Heads
Probability
of
Occurence
We have an average
= 50
And a standard
deviation = 5
And the familiar
bell-shaped
distribution.
The
Gaussian
curve fits
exactly.
Confidence
 Now throw 100 coins…
0
0.01
0.02
0.03
0.04
0.05
0.06
0.07
0.08
0.09
0 10 20 30 40 50 60 70 80 90 100
Number of Heads
Probability
of
Occurence
Since the total
probability must =1,
the standard
deviation marks off
certain
probabilities.
0
0.01
0.02
0.03
0.04
0.05
0.06
0.07
0.08
0.09
0 10 20 30 40 50 60 70 80 90 100
Number of Heads
Probability
of
Occurence
Confidence
 Now throw 100 coins…
Since the total
probability must =1,
the standard
deviation marks off
certain
probabilities.
About 68% of
all results lie
within  1
standard
deviation.
“I am 68% confident that a
new throw will give
between 45 and 55 heads.”
0
0.01
0.02
0.03
0.04
0.05
0.06
0.07
0.08
0.09
0 10 20 30 40 50 60 70 80 90 100
Number of Heads
Probability
of
OccurenceConfidence
 Now throw 100 coins…
Since the total
probability must =1,
the standard
deviation marks off
certain
probabilities.
About 95% of
all results lie
within  2
standard
deviations.
“I am 95% confident that a
new throw will give
between 40 and 60 heads.”
Systematic error
 Human components of measurement
systems are often responsible for
systematic errors.
A systematic error is one that is consistent.
That is, it happens systematically.
Example of systematic errors
 If I drop a ball from a given height and I measure
the time it takes to hit the ground.
 Even if I repeat the measurement several time, I
may consistently have a tendency to wait until I
see the ball bounce before I stop the watch
 As a result, my timing measurements might be
systematically too long
No measurement or test is perfect and the
imperfections give rise to error of
measurement in the result
So, apply corrections for known or suspected
components of error
There still remains some doubt, or
uncertainty, about how well the result of
measurement represents the true value of
the quantity being measured.
The error is the main contributor to the
uncertainty
What is the difference between
error and uncertainty ?
ERROR V/S UNCERTAINTY
 Error is a single
value
 Value of known
error can be
applied as a
correction to a
result
 Uncertainty
takes the form
of a range
 The value of
uncertainty
cannot be used
to correct a
result
Why measurement uncertainty?
Reasons of variability: cumulative effect of
variations in number of factors that influence the
measurements, e.g., equipment, method,
competence of persons, environment etc.
Repeat measurement results of the same measurand
under same conditions of measurement are
generally not the same
how wrong or how right?
There is a certain amount of variability among
repeat measurements results
Measurement Uncertainty in
ISO/IEC 17025
 Cl 5.4.6: Labs shall have and apply a procedure to
estimate the uncertainty of measurement for all
calibrations and types of calibrations.
Testing laboratories shall have and shall apply
procedures for estimating uncertainty of
measurements
 Cl 5.10.3: Calibration certificate shall include a
statement of uncertainty of measurement and / or
statement of compliance with an identified
metrological specification
Test reports shall include a statement on the
estimated uncertainty of measurement where
applicable
Measurement Uncertainty in ISO
9001:2008
Cl 7.6: Measurement provide evidence of conformity of
products to specified requirements
- Specified requirements are related to tolerance of
product characteristics
- Two factors to be considered:
Tolerance of product characteristics
variability / uncer. of measurement system
- Management to ensure: Uncertainty is known and
should be in accordance with measurement
procedures
What is Uncertainty?
Defined in simple terms, the uncertainty of
a result of a measurand is the lack of
exact knowledge of the value of
measurand or the doubt about the
validity of the result of measurement.
Formal definition (as per ISO guide, GUM):
“Parameter, associated with the result of a
measurement, that characterizes the
disper-sion of the values that could be
attributed to the measurand.”
This parameter may be, e.g., standard
deviation or the half width of an interval
having a stated level of confidence.
Why we evaluate uncertainty?
uncertainty of a result is a quantitative
indication of its quality
allows comparison of results while
interpreting data
It can be a key part of method validation
for improvement of procedures.
to allow valid measurements and results to
be obtained
Expression of uncertainty
If the probability characterized by the measurement
result y and its standard uncertainty u(y) is
approximately normal (gaussian), and u(y) is a
reliable estimate of the standard deviation of y.
We can say that Y is greater than or equal to y-u(y),
and is less than or equal to y+ u(y), which is
commonly written as
Y= y± u(y).
Are these results different?
Copyright, 2002 © CareSoft
Any Questions/ suggestions ?

Measurement Uncertainty-.ppt

  • 1.
    EXPRESSION OF UNCERTAINTY INMEASUREMENT AND INTER- LAB COMPARISON/ PROFICIENCY TESTING Awot G.
  • 2.
    "As far asthe laws of mathematics refer to reality, they are not certain; and as far as they are certain, they do not refer to reality.” Albert Einstein (1879 – 1955)
  • 3.
    METROLOGY: THE SCIENCEOF MEASUREMENTS Metrology (from Greek 'metron' (measure), and 'logos' (study of)) is the science of measurement. Metrology embraces Both experiment and theoretical determinations at any level of uncertainty in any field of Science and Technology.
  • 4.
    METROLOGY All pervasive natureof measurements Most people do not realize the important role played by metrology and associated institutions in our daily life Classification: - industrial metrology - scientific metrology - Legal metrology
  • 5.
    Cont…. Another view ofclassification: - Physical metrology - Chemical Metrology
  • 6.
    Globally operating metrologyand testing system  Uniform system of harmonized leg regulation: WTO/OIML  Uniform system of harmonized standards: ISO/IEC  Worldwide recognition of traceability measurement results on the basis of SI : CIPM/BIPM  Harmonization of requirements concern in competence of test labs and certification bodies: ILAC/IAF
  • 7.
    Hierarchy of InternationalMetrology Organization Treaty of meter General Conference on Weights and Measures (CGPM) International Committee for Weights and Measures (CIPM) International Bureau of Weights and Measures (BIPM) Consultative Committees
  • 8.
  • 9.
    Interlinked activity (Measurement) Measurement isa process and output of that process is result of measurement
  • 10.
    Measurement related issued Extensively in demand but often go unnoticed  Effect human lives, as common citizens and consumers , in many ways as: - Trade and consumer protection - Safety and health care - Environmental protection - Law and order
  • 11.
    It is aqualitative concept. Some Definitions Value that is perfectly consistent with the definition of a given specific quantity. Value of a measured characteristics that would be obtained by an ideal and perfect measurement system Perfect measurement system do not exist hence true value by nature is indeterminate. True Value
  • 12.
    Accuracy Again, since theTRUE value is unknown, neither is the maximum deviation. The accuracy is only an estimate of the worst error. i x x max of estimate accuracy   The accuracy is a measure (or an estimate) of the maximum deviation of measured values, xi, from the TRUE value, x: Usually expressed as a %-age, e.g. “accurate to 5%”
  • 13.
    Precision  There isno true value here.  Precision is a characteristic of our measurement.  In everyday language: “accuracy” ≡ “precision”. In error analysis: “accuracy” ≠ “precision” i x x max of estimate precision   The precision is a measure (or an estimate) of the consistency (or repeatability). Thus it is the maximum deviation of a reading (measurement), xi, from its mean value, x:
  • 14.
    PRECISION AND ACCURACY PRECISION– Reproducibility of the result ACCURACY – Nearness to the “true” value
  • 15.
    Accuracy & Precision:Summary In other words, Accuracy means CORRECTNESS of Measurements Precision means CONSISTENCY of measurements
  • 16.
    Closeness of agreementbetween the results of successive measurements of the same measurand carried out under same (repeatability) conditions of measurement. Repeatability Reproducibility Closeness of agreement between the results of the measurements of the same measurand carried out under changed conditions of measurement.
  • 17.
    - principle ofmeasurement - method of measurement - observer (operator) - measuring instrument - reference standard - location - conditions of use - time The conditions include ISO 5725-3:1994 describes four factors most likely to influence the precision of measurement method. These are: Time: time interval between successive measurements Calibration: equipment is or is not calibrated between successive measurment. Operator: same or different operators carry out successive measurements Equipment: same equipment (or same or different batches of reagents) is used
  • 18.
    Calibration Calibration is theact of checking or adjusting (by comparison with a standard) the accuracy of a measuring instrument
  • 19.
    SI Units  TheInternational System of Units (abbreviated SI from the French Le Système international d'unités) is the modern form of the metric system. It is the world's most widely used system of units, both in everyday commerce and in science.  The SI was developed in 1960 from the old metre- kilogram-second (mks) system
  • 20.
     The foundationof modern metrology is the International System of Units (SI), which is used internationally to define the fundamental units of measurement. These are used to derive other units and are used to define other measurement units, such as may be used locally.  The SI consists of 7 base and number of derived units:
  • 21.
    Base units Name SymbolQuantity meter m length kilogram kg mass second s time ampere A electric current kelvin K thermodynamic temperature mole mol amount of substance Candela cd luminous intensity
  • 22.
    Derived Units Parameter SIUnit Abbreviation Definition Frequency hertz Hz 1/s Force newton N kg*m/s² Pressure pascal Pa N/m² Work or Energy joule J N*m Power watt W J/s
  • 23.
    Parameter SI UnitAbbreviation Definition Electric Resistance ohm ohm V/A Quantity of Charge coulomb C A*s Electric Capacitance farad F C/V Conductance siemens S A/V Electric Potential volt V W/A
  • 24.
    Parameter SI UnitAbbreviation Definition Magnetic Flux weber Wb V*s Magnetic Flux Density tesla T Wb/² Inductance henry H Wb/A Celsius Temperature degree °C K Luminous Flux lumen lm cd*sr
  • 25.
    Parameter SI UnitAbbreviation Definition Illuminance lux lx lm/m² Activity becquerel Bq 1/s Absorbed Dose gray Gy J/kg Dose Equivalent sievert Sv m²/s²
  • 26.
    Realization in Indianscenario  The realization of all these units is done by calibration of the measuring instruments, maintained through the unbroken chain of measurements from the base standard to main the traceability  In India, NPL is custodian of all standards (Except Radiation), BARC is custodian of Radiation related standards.
  • 27.
    Treaceability The property ofthe result of a measurement or the value of a standard whereby it can be related to stated references, usually national or international standards, through an unbroken chain of comparisons all having stated uncertainties.
  • 28.
    How traceability isestablished? International standard (length), at GENEVA National Standard (at NPL) Interferometer at 10-9m at say +/- 10ppm level Echelon 2 Laboratory (ERTL) length standard (slip gauge of grade 00 at acc. +/- 200 ppm level Other Lab (NABL Accredited) slip gauge of grade 0 at acc +/- 1000 ppm
  • 29.
  • 30.
    Transfer of lengthstd. The iodine stabilized HeNe laser operating at 633 nm is the most common because it is convenient to operate, accurate to 2.5 parts in 1011, and is used to calibrate commercial displacement measuring interferometer systems
  • 31.
  • 32.
  • 33.
     Measurement Error: Result of measurement minus the true value of measurand.  Random error : Result of measurement minus mean result of large number of repeat measurements.  Systematic error : Mean of large number of repeat measurements of same measurand minus true value of measurand. More Definitions
  • 34.
    Error The error isthe difference between a TRUE value, x, and a MEASURED value, xi:  There is no error-free measurement.  The significance of a measurement cannot be judged unless the associate error has been reliably estimated.  Since the true value, x, is unknown, then so is E.  Always. i x x E  
  • 35.
    Two types oferrors  Random error  Always present in every physical measurement  It can be made smaller  Better apparatus  Better procedure  More uniform or controlled conditions  Estimation of the random error is the obligation of the experimenter  Propagation of random errors in calculated quantities gives the error in the result based on measurements  Determines the precision of any measurement
  • 36.
    Two types oferrors  Systematic error  May be present in every physical measurement  It can be made smaller  Better calibration (e.g., time, distance, voltage, etc.)  Use instruments to minimize systematic error (e.g., ruler alignment)  More uniform or controlled conditions (e.g., avoid systematic changes in temperature, light intensity, air currents, etc.)  Discovery and estimation of a systematic error is the obligation of the experimenter  Systematic errors should be removed or minimized if at all possible. They should always be reported - even those that are suspect (e.g., calibration of time, distance; calibration stability)  Determines the accuracy of any measurement
  • 37.
    Random error For instance,if you conduct a measurement many thousand times (using different instruments and/or observers and/or samples) you would expect to have random errors affecting your measurement in either direction roughly the same number of times  Electrical noise in a circuit generally produces a voltage error that may be positive or negative by a small amount.  By counting the total number of pennies in a large container, one may occasionally pick up two and only count one (or vice versa). A random error is just that – random !
  • 38.
    Random errors Random errorsand the standard deviation  All measurements have random error.  Consider an example.  Measure the range of a projectile shot from a gun  Use this to calculate the velocity when the projectile left the gun  Make one measurement (202.4 cm) ; what is the error?  Meter stick will give ~3 mm error.  How might we find out whether this is reasonable?  Make repeated measurements of the range --
  • 39.
    Random errors . 40 measurements Distributionof distance measurements for projectile 0 1 2 3 4 5 6 7 8 9 10 1 9 8 . 0 1 9 8 . 6 1 9 9 . 2 1 9 9 . 8 2 0 0 . 4 2 0 1 . 0 2 0 1 . 6 2 0 2 . 2 2 0 2 . 8 2 0 3 . 4 2 0 4 . 0 2 0 4 . 6 2 0 5 . 2 2 0 5 . 8 2 0 6 . 4 2 0 7 . 0 2 0 7 . 6 2 0 8 . 2 2 0 8 . 8 2 0 9 . 4 2 1 0 . 0 Distance (cm) Frequency
  • 40.
    Random errors Distribution ofdistance measurements for projectile 0 1 2 3 4 5 6 7 8 9 10 11 12 13 14 15 1 9 8 . 0 100 measurements
  • 41.
    Random errors Distribution ofdistance measurements for projectile 0 1 2 3 4 5 6 7 8 9 10 11 12 13 14 15 1 9 8 . 0 200 measurements
  • 42.
    Random errors . Distribution ofdistance measurements for projectile 0 5 10 15 20 25 30 35 1 9 8 . 0 500 measurements
  • 43.
    Random errors  . Distributionof distance measurements for projectile 0 5 10 15 20 25 30 35 40 45 50 55 60 65 198.0 1000 measurements
  • 44.
    Random errors Distribution ofdistance measurements for projectile 0 50 100 150 200 250 300 1 9 8 . 0 5000 measurements
  • 45.
    Random errors 10000 measurements Distributionof distance measurements for projectile 0 50 100 150 200 250 300 350 400 450 500 550 600 198.0
  • 46.
    Random errors 10000 measurements Distributionof distance measurements for projectile 0 50 100 150 200 250 300 350 400 450 500 550 600 1 9 8 . 0 1 9 8 . 6 1 9 9 . 2 1 9 9 . 8 2 0 0 . 4 2 0 1 . 0 2 0 1 . 6 2 0 2 . 2 2 0 2 . 8 2 0 3 . 4 2 0 4 . 0 2 0 4 . 6 2 0 5 . 2 2 0 5 . 8 2 0 6 . 4 2 0 7 . 0 2 0 7 . 6 2 0 8 . 2 2 0 8 . 8 2 0 9 . 4 2 1 0 . 0 Distance (cm) Frequency
  • 47.
    Random errors 10000 measurements Distributionof distance measurements for projectile 0.0000 50.0000 100.0000 150.0000 200.0000 250.0000 300.0000 350.0000 400.0000 450.0000 500.0000 550.0000 600.0000 197.0 198.0 199.0 200.0 201.0 202.0 203.0 204.0 205.0 206.0 207.0 208.0 209.0 210.0 211.0 Distance (cm) Frequency ±1 Mean ±2s ; 95% Standard deviation
  • 48.
    Random errors Interpretation  Ifyou repeat this measurement many times (e.g., 100, 10,000) you would find that  68.3% of all these measurements will be within ± 1 g, and,  95% of all these measurements will be within ± 2 g of your quoted (measured) value, g.
  • 49.
    The probability thata normal random variable takes a value within one standard deviation of its mean is about 68%. The 68 – 95 – 99.7 Rule
  • 50.
    The probability thata normal random variable takes a value within two standard deviations of its mean is about 95%. The 68 – 95 – 99.7 Rule
  • 51.
    The probability thata normal random variable takes a value within three standard deviations of its mean is about 99.7%. The 68 – 95 – 99.7 Rule
  • 52.
    Statistics  Now throw100 coins… 0 0.01 0.02 0.03 0.04 0.05 0.06 0.07 0.08 0.09 0 10 20 30 40 50 60 70 80 90 100 Number of Heads Probability of Occurence We have an average = 50 And a standard deviation = 5 And the familiar bell-shaped distribution. The Gaussian curve fits exactly.
  • 53.
    Confidence  Now throw100 coins… 0 0.01 0.02 0.03 0.04 0.05 0.06 0.07 0.08 0.09 0 10 20 30 40 50 60 70 80 90 100 Number of Heads Probability of Occurence Since the total probability must =1, the standard deviation marks off certain probabilities.
  • 54.
    0 0.01 0.02 0.03 0.04 0.05 0.06 0.07 0.08 0.09 0 10 2030 40 50 60 70 80 90 100 Number of Heads Probability of Occurence Confidence  Now throw 100 coins… Since the total probability must =1, the standard deviation marks off certain probabilities. About 68% of all results lie within  1 standard deviation. “I am 68% confident that a new throw will give between 45 and 55 heads.”
  • 55.
    0 0.01 0.02 0.03 0.04 0.05 0.06 0.07 0.08 0.09 0 10 2030 40 50 60 70 80 90 100 Number of Heads Probability of OccurenceConfidence  Now throw 100 coins… Since the total probability must =1, the standard deviation marks off certain probabilities. About 95% of all results lie within  2 standard deviations. “I am 95% confident that a new throw will give between 40 and 60 heads.”
  • 56.
    Systematic error  Humancomponents of measurement systems are often responsible for systematic errors. A systematic error is one that is consistent. That is, it happens systematically.
  • 57.
    Example of systematicerrors  If I drop a ball from a given height and I measure the time it takes to hit the ground.  Even if I repeat the measurement several time, I may consistently have a tendency to wait until I see the ball bounce before I stop the watch  As a result, my timing measurements might be systematically too long
  • 58.
    No measurement ortest is perfect and the imperfections give rise to error of measurement in the result So, apply corrections for known or suspected components of error
  • 59.
    There still remainssome doubt, or uncertainty, about how well the result of measurement represents the true value of the quantity being measured. The error is the main contributor to the uncertainty
  • 60.
    What is thedifference between error and uncertainty ?
  • 61.
    ERROR V/S UNCERTAINTY Error is a single value  Value of known error can be applied as a correction to a result  Uncertainty takes the form of a range  The value of uncertainty cannot be used to correct a result
  • 62.
    Why measurement uncertainty? Reasonsof variability: cumulative effect of variations in number of factors that influence the measurements, e.g., equipment, method, competence of persons, environment etc. Repeat measurement results of the same measurand under same conditions of measurement are generally not the same how wrong or how right? There is a certain amount of variability among repeat measurements results
  • 63.
    Measurement Uncertainty in ISO/IEC17025  Cl 5.4.6: Labs shall have and apply a procedure to estimate the uncertainty of measurement for all calibrations and types of calibrations. Testing laboratories shall have and shall apply procedures for estimating uncertainty of measurements  Cl 5.10.3: Calibration certificate shall include a statement of uncertainty of measurement and / or statement of compliance with an identified metrological specification Test reports shall include a statement on the estimated uncertainty of measurement where applicable
  • 64.
    Measurement Uncertainty inISO 9001:2008 Cl 7.6: Measurement provide evidence of conformity of products to specified requirements - Specified requirements are related to tolerance of product characteristics - Two factors to be considered: Tolerance of product characteristics variability / uncer. of measurement system - Management to ensure: Uncertainty is known and should be in accordance with measurement procedures
  • 65.
    What is Uncertainty? Definedin simple terms, the uncertainty of a result of a measurand is the lack of exact knowledge of the value of measurand or the doubt about the validity of the result of measurement.
  • 66.
    Formal definition (asper ISO guide, GUM): “Parameter, associated with the result of a measurement, that characterizes the disper-sion of the values that could be attributed to the measurand.” This parameter may be, e.g., standard deviation or the half width of an interval having a stated level of confidence.
  • 67.
    Why we evaluateuncertainty?
  • 68.
    uncertainty of aresult is a quantitative indication of its quality allows comparison of results while interpreting data It can be a key part of method validation for improvement of procedures. to allow valid measurements and results to be obtained
  • 69.
    Expression of uncertainty Ifthe probability characterized by the measurement result y and its standard uncertainty u(y) is approximately normal (gaussian), and u(y) is a reliable estimate of the standard deviation of y. We can say that Y is greater than or equal to y-u(y), and is less than or equal to y+ u(y), which is commonly written as Y= y± u(y).
  • 70.
  • 71.
  • 72.
  • 73.