1. | | Logged in as Username | Logout | Admin | Jobs (3) | Help
Dashboards | | Search | | Reports | | Visualizations | | Application Settings
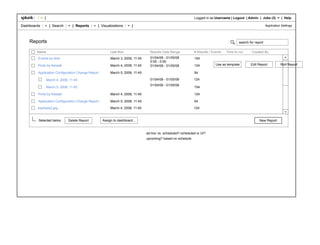
Reports search for report
Name Last Run Results Date Range # Results / Events Time to run Created By
Events by time March 3, 2008, 11:45 01/04/08 - 01/05/08 154
0:00 - 0:00
Ports by firewall March 4, 2008, 11:45 01/04/08 - 01/05/08 124 Use as template Edit Report Run Report
Application Configuration Change Report March 5, 2008, 11:45 54
March 4, 2008, 11:45 01/04/08 - 01/05/08 124
01/04/08 - 01/05/08
March 5, 2008, 11:45 154
Ports by firewall March 4, 2008, 11:45 124
Application Configuration Change Report March 5, 2008, 11:45 54
example2.jpg March 4, 2008, 11:45 124
Selected items: Delete Report Assign to dashboard... New Report
ad-hoc vs. scheduled? scheduled or UI?
upcoming? based on schedule
2. | | Logged in as Username | Logout | Admin | Jobs (3) | Help
Dashboards | | Search | | Reports | | Visualizations | | Application Settings
Timeframe: Last 24 hours
IP Address=Foo | Host=Bar >
Search assistance
Save Search | Save as Alert | Export
Results
Report on results
3. | | Logged in as Username | Logout | Admin | Jobs (3) | Help
Dashboards | | Search | | Reports | | Visualizations | | Application Settings
[ < Back to search results ]
Report on Results [ Advanced ]
1: Choose report type (don't worry, you can always change it later)
Trend over time
Distribution SIMPLE Line more
Correlation
SPLIT FIELD Stacked more
All report types Column
Multiple more
MULTIPLE SERIES Column
2: Map fields
3: Format report
Cancel
4. | | Logged in as Username | Logout | Admin | Jobs (3) | Help
Dashboards | | Search | | Reports | | Visualizations | | Application Settings
[ < Back to search results ]
Report on Results [ Advanced ]
1: Choose report type (don't worry, you can always change it later)
Trend over time
Distribution SIMPLE Line more
Correlation
Stacked Stacked Multiple Multiple
All report types SPLIT FIELD Area Column Line Table Only
Column
Multiple more
MULTIPLE SERIES Column
2: Map fields
3: Format report
Cancel
5. | | Logged in as Username | Logout | Admin | Jobs (3) | Help
Dashboards | | Search | | Reports | | Visualizations | | Application Settings
[ < Back to search results ]
Report on Results [ Advanced ]
1: Choose report type (don't worry, you can always change it later)
Trend over time
Distribution SIMPLE Line more
Correlation
Stacked Stacked Multiple Multiple
All report types SPLIT FIELD Area Column Line Table Only
Column
USE SPLIT FIELD IF...
description description and description
Multiple
and and and description and description
more
MULTIPLE SERIES Column
description.
2: Map fields
3: Format report
Cancel
6. | | Logged in as Username | Logout | Admin | Jobs (3) | Help
Dashboards | | Search | | Reports | | Visualizations | | Application Settings
[ < Back to search results ]
Report on Results [ Advanced ]
1: Choose report type (don't worry, you can always change it later)
Trend over time
Distribution SIMPLE Line more
Correlation
Stacked Stacked Multiple Multiple
All report types SPLIT FIELD Area Column Line Table Only
Column
Multiple more
MULTIPLE SERIES Column
2: Map fields
3: Format report
Cancel
7. | | Logged in as Username | Logout | Admin | Jobs (3) | Help
Dashboards | | Search | | Reports | | Visualizations | | Application Settings
[ < Back to search results ]
Report on Results [ Advanced ]
1: Choose report type (don't worry, you can always change it later)
Trend over time
SIMPLE SPLIT FIELD MULTIPLE SERIES
Distribution description description and description and and description description and description and and
Line and description and description description. and description and description description.
Correlation
Stacked Multiple Multiple Multiple
Area Column Column Column Line
All report types
Stacked Multiple
Column Area Line Table Only
Table Only
Table Only
2: Map fields
3: Format report
Cancel
8. | | Logged in as Username | Logout | Admin | Jobs (3) | Help
Dashboards | | Search | | Reports | | Visualizations | | Application Settings
[ < Back to search results ]
Report on Results [ Advanced ]
1: Choose report type (don't worry, you can always change it later)
Trend over time
SIMPLE SPLIT FIELD MULTIPLE SERIES
Distribution description description and description and and description description and description and and
Line and description and description description. and description and description description.
Correlation
Stacked Multiple Multiple Multiple
Area Column Column Column Line
All report types
Stacked Multiple
Column Area Line Table Only
Table Only
Table Only
2: Map fields
3: Format report
Cancel
9. | | Logged in as Username | Logout | Admin | Jobs (3) | Help
Dashboards | | Search | | Reports | | Visualizations | | Application Settings
[ < Back to search results ]
Report on Results [ Advanced ]
1: Choose report type (don't worry, you can always change it later)
Trend over time
SINGLE SERIES SPLIT SERIES MULTIPLE SERIES
Distribution description description and description and and description description and description and and
Line and description and description description. and description and description description.
Correlation
Stacked Multiple Multiple Multiple
Area Column Column Column Line
All report types
Stacked Multiple
Column Area Line Table Only
Table Only
Table Only
2: Map fields
3: Format report
Cancel
10. | | Logged in as Username | Logout | Admin | Jobs (3) | Help
Dashboards | | Search | | Reports | | Visualizations | | Application Settings
[ < Back to search results ]
Report on Results [ Advanced ]
1: Choose report type (don't worry, you can always change it later)
Trend over time
TOP / RARE VALUES CONTINGENCY TABLE
Distribution
Bar Pie Heat Map Bubble ???
Correlation
Column Donut Table Only
All report types
Table Only
For distribution over time. see Trend over time
2: Map fields
3: Format report
Cancel
11. | | Logged in as Username | Logout | Admin | Jobs (3) | Help
Dashboards | | Search | | Reports | | Visualizations | | Application Settings
[ < Back to search results ]
Report on Results [ Advanced ]
1: Choose report type (don't worry, you can always change it later)
Trend over time
SINGLE SERIES MULTIPLE SERIES
Distribution
Multiple Scatter
Bar Column
Correlation
Table Only Table Only
All report types
For correlation over time. see Trend over time
2: Map fields
3: Format report
Cancel
12. | | Logged in as Username | Logout | Admin | Jobs (3) | Help
Dashboards | | Search | | Reports | | Visualizations | | Application Settings
[ < Back to search results ]
Report on Results [ Advanced ]
1: Choose report type: trend over time . split field
2: Map fields
y-axis field secondary / split by field
show count of enter field name or click to see all fields by enter field name over TIME
3: Format report
Cancel
13. | | Logged in as Username | Logout | Admin | Jobs (3) | Help
Dashboards | | Search | | Reports | | Visualizations | | Application Settings
[ < Back to search results ]
Report on Results y-axis:
[ Advanced ]
y-axis secondary / split by
field field values
1: Choose report type: trend over time . split field . stacked column
x-axis: Time
2: Map fields
y-axis field secondary / split by field
show count of enter field name or click to see all fields by enter field name over TIME
3: Format report
Cancel
14. | | Logged in as Username | Logout | Admin | Jobs (3) | Help
Dashboards | | Search | | Reports | | Visualizations | | Application Settings
[ < Back to search results ]
Report on Results [ Advanced ]
1: Choose report type: trend over time . split field
2: Map fields
y-axis field secondary / split by field
show count of | by enter field name over TIME
3: Format report
Cancel
15. | | Logged in as Username | Logout | Admin | Jobs (3) | Help
Dashboards | | Search | | Reports | | Visualizations | | Application Settings
[ < Back to search results ]
Report on Results [ Advanced ]
1: Choose report type: trend over time . split field
2: Map fields
y-axis field secondary / split by field
show count of cookies by enter field name over TIME
3: Format results Enter secondary / split by field to format results
Chart (Preview)
Count of Cookies vs. Time
cookies (count)
Table [ Show | Hide ]
Cancel
16. | | Logged in as Username | Logout | Admin | Jobs (3) | Help
Dashboards | | Search | | Reports | | Visualizations | | Application Settings
[ < Back to search results ]
Report on Results [ Advanced ]
1: Choose report type: trend over time . split field
2: Map fields
y-axis field secondary / split by field
show distinct count of cookies by file over TIME
3: Format results
Chart (Preview) Run chart to see the actual data.
Display as: Chart Options
Count of Cookies vs. Time by File
cookies (distinct count)
cookies (distinct count)
Time
Table [ Show | Hide ]
Cancel Run & Save
17.
18. | | Logged in as Username | Logout | Admin | Jobs (3) | Help
Dashboards | | Search | | Reports | | Visualizations | | Application Settings
[ < Back to search results ]
Report on Results [ Advanced ]
1: Choose report type: trend over time . split field
2: Map fields
y-axis field secondary / split by field
show distinct count of cookies by file over TIME
3: Format results
Chart (Preview) Run chart to see the actual data.
Display as: Chart Options
Scale
Count of Cookies vs. Time by File Linear | Logarithmic
Null Values
Suppress | Display
cookies (distinct count)
cookies (distinct count)
Flip axes
Time
Table [ Show | Hide ]
Cancel Run & Save
19. | | Logged in as Username | Logout | Admin | Jobs (3) | Help
Dashboards | | Search | | Reports | | Visualizations | | Application Settings
[ < Back to search results ]
Report on Results [ Advanced ]
1: Choose report type: trend over time . split field
2: Map fields
y-axis field secondary / split by field
show distinct count of cookies by file over TIME
3: Format results
Chart (Preview) Run chart to see the actual data.
Display as: Chart Options
Count of Cookies vs. Time by File
changes will result in
Time Axis preview. You will need to run
the chart to see actual data.
cookies (distinct count)
cookies (distinct count)
Label
Time
Time range
1/1/08 - 1/1/09
Time span for each bucket / bin
2 day(s)
= 182 buckets / bins
MAX = 300 buckets
Time
Cancel Save
Table [ Show | Hide ]
Cancel Run & Save
20. | | Logged in as Username | Logout | Admin | Jobs (3) | Help
Dashboards | | Search | | Reports | | Visualizations | | Application Settings
[ < Back to search results ]
Report on Results [ Advanced ]
1: Choose report type: trend over time . split field
2: Map fields
y-axis field secondary / split by field
show distinct count of cookies by file over TIME
3: Format results
Chart (Preview) Run chart to see the actual data.
Display as: Chart Options
Count of Cookies vs. Time by File
cookies (distinct count)
File 1 [ Show | Hide ]
cookies (distinct count)
Label
File 1
Color
Time Cancel Save
Table [ Show | Hide ]
Cancel Run & Save
21.
22. | | Logged in as Username | Logout | Admin | Jobs (3) | Help
Dashboards | | Search | | Reports | | Visualizations | | Application Settings
[ < Back to search results ]
Report on Results [ Advanced ]
1: Choose report type: trend over time . split field
2: Map fields
y-axis field secondary / split by field
show distinct count of cookies by file over TIME
3: Format results
Chart (Preview) Run chart to see the actual data.
Display as: Chart Options
Count of Cookies vs. Time by File
cookies (distinct count)
cookies (distinct count)
Time
Table [ Show | Hide ]
Cancel Run & Save
23.
24. | | Logged in as Username | Logout | Admin | Jobs (3) | Help
Dashboards | | Search | | Reports | | Visualizations | | Application Settings
[ < Back to search results ]
Report on Results [ back to Simple view ]
WARNING: Not all commands are available in the simple view and ...
IP Address=Foo | Host=Bar >
Reporting assistance
Timeframe: Last 24 hours
Chart (Preview) Run chart to see the actual data.
Count of Cookies vs. Time by File
cookies (distinct count)
cookies (distinct count)
Time
Table [ Show | Hide ]
Cancel Run & Save
25. | | Logged in as Username | Logout | Admin | Jobs (3) | Help
Dashboards | | Search | | Reports | | Visualizations | | Application Settings
[ < Back to search results ]
Report on Results [ Advanced ]
1: Choose report type: trend over time . split field
2: Map fields
y-axis field secondary / split by field
show distinct count of cookies by file over TIME
3: Format results
Chart
Display as: Chart Options
Count of Cookies vs. Time by File
cookies (distinct count)
cookies (distinct count)
Time
Table [ Show | Hide ]
Cancel Save
26.
27. | | Logged in as Username | Logout | Admin | Jobs (3) | Help
Dashboards | | Search | | Reports | | Visualizations | | Application Settings
[ < Back to search results ]
Search generated: 08/09/08: 09:00
Report on Results String=ValidForUseCase Save / Publish
[ < Back to search results ]
[ Advanced ]
1 Choose report type (don't worry, you can always change it later)
Table Only Timechart Other Chart
28. | | Logged in as Username | Logout | Admin | Jobs (3) | Help
Dashboards | | Search | | Reports | | Alerts | | Visualizations | | Application Settings
Timeframe: Last 24 hours
IP Address=Foo | Host=Bar >
Search assistance
Save Search | Save as Alert | Export
Results
analyze / chart results
Report on Field
Distribution
Top Values | Rare Values | Contingency Table
Correlation
Single Series | Multiple Series
Trend over time
Single Series | Split Series | Multiple Series
29. | | Logged in as Username | Logout | Admin | Jobs (3) | Help
Dashboards | | Search | | Reports | | Alerts | | Visualizations | | Application Settings
Timeframe: Last 24 hours
IP Address=Foo | Host=Bar >
Search assistance
Save Search | Save as Alert | Export
Results
analyze / chart results
Report on Field
Trend over time
Distribution
Correlation
30. | | Logged in as Username | Logout | Admin | Jobs (3) | Help
Dashboards | | Search | | Reports | | Alerts | | Visualizations | | Application Settings
Timeframe: Last 24 hours
IP Address=Foo | Host=Bar >
Search assistance
Save Search | Save as Alert | Export
Results
analyze / chart results
Report on Field
Trend over time
Distribution Top Values | Rare Values | Contingency Table
Correlation
31. | | Logged in as Username | Logout | Admin | Jobs (3) | Help
Dashboards | | Search | | Reports | | Visualizations | | Application Settings
[ < Back to search results ]
Report on Results [ Advanced ]
1: Choose report type: single series correlation
2: Map fields
y-axis field x-axis field
show count of over File
3: Format report
Cancel