
Recommended
Recommended
More Related Content
What's hot
What's hot (20)
Similar to The Trump Era, Implications for Investors
Similar to The Trump Era, Implications for Investors (20)
Recently uploaded
Recently uploaded (20)
The Trump Era, Implications for Investors
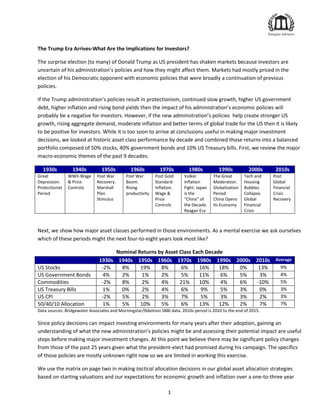
- 1. 1 The Trump Era Arrives-What Are the Implications for Investors? The surprise election (to many) of Donald Trump as US president has shaken markets because investors are uncertain of his administration’s policies and how they might affect them. Markets had mostly priced in the election of his Democratic opponent with economic policies that were broadly a continuation of previous policies. If the Trump administration’s policies result in protectionism, continued slow growth, higher US government debt, higher inflation and rising bond yields then the impact of his administration’s economic policies will probably be a negative for investors. However, if the new administration’s policies help create stronger US growth, rising aggregate demand, moderate inflation and better terms of global trade for the US then it is likely to be positive for investors. While it is too soon to arrive at conclusions useful in making major investment decisions, we looked at historic asset class performance by decade and combined those returns into a balanced portfolio composed of 50% stocks, 40% government bonds and 10% US Treasury bills. First, we review the major macro-economic themes of the past 9 decades: 1930s 1940s 1950s 1960s 1970s 1980s 1990s 2000s 2010s Great Depression. Protectionist Period WWII-Wage & Price Controls Post War Recovery. Marshall Plan Stimulus Post War Boom. Rising productivity Post Gold Standard Inflation. Wage & Price Controls Volker Inflation Fight. Japan is the “China” of the Decade. Reagan Era The Great Moderation. Globalization Period. China Opens Its Economy Tech and Housing Bubbles Collapse. Global Financial Crisis Post Global Financial Crisis Recovery Next, we show how major asset classes performed in those environments. As a mental exercise we ask ourselves which of these periods might the next four-to-eight years look most like? Nominal Returns by Asset Class Each Decade 1930s 1940s 1950s 1960s 1970s 1980s 1990s 2000s 2010s Average US Stocks -2% 8% 19% 8% 6% 16% 18% 0% 13% 9% US Government Bonds 4% 2% 1% 2% 5% 11% 6% 5% 3% 4% Commodities -2% 8% 2% 4% 21% 10% 4% 6% -10% 5% US Treasury Bills 1% 0% 2% 4% 6% 9% 5% 3% 0% 3% US CPI -2% 5% 2% 3% 7% 5% 3% 3% 2% 3% 50/40/10 Allocation 1% 5% 10% 5% 6% 13% 12% 2% 7% 7% Data sources: Bridgewater Associates and Morningstar/Ibbotson SBBI data. 2010s period is 2010 to the end of 2015. Since policy decisions can impact investing environments for many years after their adoption, gaining an understanding of what the new administration’s policies might be and assessing their potential impact are useful steps before making major investment changes. At this point we believe there may be significant policy changes from those of the past 25 years given what the president-elect had promised during his campaign. The specifics of those policies are mostly unknown right now so we are limited in working this exercise. We use the matrix on page two in making tactical allocation decisions in our global asset allocation strategies based on starting valuations and our expectations for economic growth and inflation over a one-to-three year
- 2. 2 tactical investment horizon. These tactical preferences are the ones most likely to be affected by changes in policy from the new administration: Expectation Economic Growth Inflation Rising Equities Real estate Credits including high yield and emerging markets Commodities Equities Inflation linked bonds Commodities Real estate US Treasury bills Falling US Treasury bonds US Treasury bills Nominal bonds US Treasury bills and bonds Equities Our current three-to-five year outlook is for slow global economic growth with modest inflation caused by excessive debt. We don’t see debt levels falling given president-elect Trump’s campaign promises, a lack of faith in his administration actually delivering promised 4% economic growth and unfavorable demographic trends which affect the entire developed world. Failing to address public debt could offset much of his administration’s economic growth plans. If interest rates should rise, servicing the debt will consume more of the Federal budget or add to the debt burden and slow growth further. The economic impact of promised tax cuts, infrastructure investment and greater defense spending are longer-term in nature and could be offset by the negative effects of rising debt in a highly indebted economy. Any credible economic policy has to address debt reduction and budget deficits based on realistic assumptions of potential growth. Over the next several quarters we will re-visit our outlook using scenario analysis to help us decide on any tactical allocation changes. Our strategic allocations are determined by our views on asset class return premia in excess of a risk free asset like a treasury bill over our strategic investment horizon. Economists Carmen Reinhart and Ken Rogoff conducted research into the history of financial crises and their impact on the economies in which they occurred. They noted that, on average, it took an economy about 8.3 years from crisis peak to recovery with many of the 100 worst crises they studied taking 20 years or more to recover. We are now about 8 years from the worst of the 2008-2009 financial crisis. Perhaps we are right on schedule in our recovery and the new administration’s policies will be the right ones but we don’t yet know enough about them. The Trump administration has our best wishes in getting its policies right. Contact me at gjohnsen@eastgateadv.com with comments or questions. Greg Johnsen, CFA References Reinhart, C and Rogoff, K. 2014. “Recovery from Financial Crises: Evidence from 100 Episodes”, American Economic Review: Papers & Proceedings 2014, 104(5) pages 50-55. Reinhart, C and Rogoff, K. 2009. “This Time is Different, Eight Centuries of Financial Folly”, 2009. Princeton University Press, Princeton, NJ. © Eastgate Advisors, llc. 2016