
Recommended
More Related Content
Similar to Movies Sample PresentationSCM 315 – Business Decision Models.docx
Similar to Movies Sample PresentationSCM 315 – Business Decision Models.docx (20)
More from gilpinleeanna
More from gilpinleeanna (20)
Recently uploaded
Recently uploaded (20)
Movies Sample PresentationSCM 315 – Business Decision Models.docx
- 1. Movies Sample Presentation SCM 315 – Business Decision Models Data Data for these visualizations are from two sources: Data comprises all major motion picture releases from 2011 and most of 2012 Box Office Mojo http://www.boxofficemojo.com/ Contains all movie release data including: Theaters Opening gross Total gross Any much more … IMDB http://www.imdb.com/ Obtained top three billed starts for each film Google Obtained ‘Bacon Number’ for each actor (number of movie connections between the actor and Kevin Bacon)
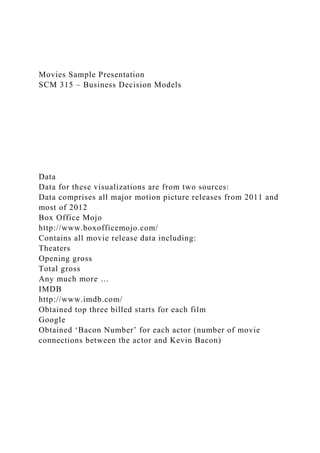
- 2. Opening Gross vs. Total Gross Opening Gross vs. Total Gross Visualization: Each data point is a different movie Each movie is colored based on the MPAA rating of the film The x-axis denotes the total box office gross of the film The y-axis denotes the opening weekend box office gross of the film The trend lines are separate for each MPAA rating Reasoning: This graph was created to determine variability between a films opening weekend gross vs. its total gross They are expected to be correlated, but it will be interesting to see if there are outliers The movies are color coded by MPAA rating to determine if that has any impact on the correlation
- 3. Opening Gross vs. Total Gross Opening Gross vs. Total Gross Conclusions: It is clearly evident that a movie’s total gross is highly correlated with its opening gross (i.e. if it makes more initially it will make more over its life) Only a small subset of movies make over $100 million in total gross Due to the higher slope, PG-13 movies tend to make more of its total earning in its opening week/weekend This is not overly surprising as this is driven by many high profile movies (Avengers, Pirates of the Caribbean, etc.) which are more likely to be seen in the opening week than less high profile movies It appears that children's movies have the longest lifespans as they tend to make the lowest percentage on their opening weekend Examples are Puss in Boots, Brave, Kung Fu Panda 2
- 4. Average Gross by Date Including 3D Percentages Average Gross by Date Including 3D Percentages Visualization: Each bar represents the count of the number of films released that month (height shown on the left y-axis) Each bar is colored based on the percentage of releases that month which were in 3D The line shows the average box office gross per film release during that month (height shown on the right y-axis) The reference lines show the yearly average box office gross for each film Reasoning: This graph was made to primarily observe if summer movies tend to make more These months tend to have the blockbuster movies The bars were added to provide clarity on the scale of films released each month The bars were color coded to see if higher percentage of 3D movies are also released in the summer
- 5. Average Gross by Date Including 3D Percentages Average Gross by Date Including 3D Percentages Conclusions: From 2011 to 2012, the average gross per film increased by $10 million Typically, the highest average movie grosses take place in the summer (May, June, and July). These months also have the highest percentage of 3D releases in general (coinciding with the big blockbuster action movies) The summer months also tend to have the lowest number of releases This trend is not very consistent, more data would be needed to see if it holds up Top 30 Actors and Actresses Based on % Sequels
- 6. Top 30 Actors and Actresses based on % Sequels Visualization: Each bubble is one of the top 30 top-billed actors or actresses based on the total gross of their movies The larger the bubble, the more that actors/actresses movies grossed (as given by the label) The bubbles are shaded based on the percentage of their movies which were sequels Reasoning: The chart was made to simply observe which actors/actresses are in the highest grossing movies The shading was added to observe how frequently the top grossing actors are tied with franchise movies Top 30 Actors and Actresses based on % Sequels
- 7. Top 30 Actors and Actresses based on % Sequels Conclusions: You can see the top actors/actresses are all associated with sequels of various types: Robert Downey Jr.: Avengers/Iron Man Christian Bale: Batman Johnny Depp: Pirates of the Caribbean Daniel Radcliffe: Harry Potter Nearly none of the actors/actresses associated with sequels are women Women do not appear to earn top billing in franchise films (minus one outlier of Jennifer Lawrence) Other than top performers, most of the top 30 are all around the $200 million Movie Gross vs. Budget by Movie Type
- 8. Movie Gross vs. Budget by Movie Type Visualization: Each dot on the graph represents a different movie The x-axis represents the genre of movie The left y-axis represents the total gross of the movie A box and whisker plot is overlaid to determine the quartiles for each genre of movie The bars represent the median movie budget of that genre of movie (right y-axis) Reasoning: The main reason for this graph is to compare the median budget to the median gross as well as to compare if this relationship varies based on the genre Movie Gross vs. Budget by Movie Type Movie Gross vs. Budget by Movie Type Conclusions: Adventure movies have the highest statistical measures Highest median, 75% quartile and max However adventure movies also have the highest median budget
- 9. The median budget exceeds the median gross implying adventure movies can be risky The two riskiest categories (Adventure and Action) also have the highest earning potential. Least risky movies are Romantic Comedies and Musicals as their median budget is less than the 25% quartile of their overall gross However the upside of these movies is minimal Distributors Gross by Genre/Rating and Season Releases Distributors Gross by Genre/ Rating and Season Releases Visualization: This dashboard features two graphs Graph 1: Shows total distributor gross as the height of each bar The bar is split by the genre of the film Graph 2: Shows the percentage of movies released during each season based on genre Both graphs are controlled by the filter which allows control for
- 10. the MPAA rating of the movies included in both graphs Reasoning: This dashboard will interactively allow for the inspection of different distributors based on MPAA rating to see if there is a correlation between different distributors and different types of movies. The second graph will permit observations regarding when different types of movies are released and if they follow traditional assumptions Distributors Gross by Genre/ Rating (All) and Season Releases Distributors Gross by Genre/ Rating (G) and Season Releases
- 11. Distributors Gross by Genre/ Rating (PG) and Season Releases Distributors Gross by Genre/ Rating (PG-13) and Season Releases Distributors Gross by Genre/ Rating (R) and Season Releases Distributors Gross by Genre/ Rating and Season Releases Conclusions: Overall, the WB was the highest grossing distributor fueled
- 12. primarily by their PG13 movies They also have the highest total grossing R movies as well by are closely matched with Universal Paramount has the highest grossing PG movies while the WB is only 6th on the list PG movies are heavily dominated by Adventure type movies while R movies are dominated by Comedy movies There are only a small handful of G movies released every year In general, Adventure movies (the blockbusters) are released during the Spring and Summer periods Drama movies are most prevalent during the Fall and Holiday seasons which coincide the typical Oscar release dates for films $0M$50M$100M$150M$200M$250M$300M$350M$400M$450 M$500M$550M$600M$650M Gross $0M $20M $40M $60M $80M $100M $120M $140M $160M $180M $200M $220M O
- 13. p e n i n g G r o s s Cars 2 Brave Dr. Seuss' The Lorax Kung Fu Panda 2 Puss in Boots Captain America: The First Avenger Cowboys & Aliens Green Lantern Harry Potter and the Deathly Hallows: Part II MIB 3 Mission: Impossible - Ghost Protocol Pirates of the Caribbean: On Stranger Tides Sherlock Holmes: A Game of Shadows The Amazing Spider-Man The Avengers The Dark Knight Rises The Help The Hunger Games The Twilight Saga: Breaking Dawn, Part 1 Thor Transformers: Dark of the Moon Paranormal Activity 3 MPAA Rate G
- 20. 14 16 18 N u m b e r o f M o v i e s $0M $20M $40M $60M $80M $100M $120M $140M $160M A v g . G r o
- 21. s s 30.0% 12.5% 50.0%37.5% 18.2% 23.1% 12.5% 50.0% 15.4% 8.3% 9.1% Average Yearly Gross 18.2% 33.3% 10.0% 25.0% 30.8% 50.0% 7.7% 7.1% Average Yearly Gross 7.1%50.0% Avg. 3D Percentage Measure Names Avg. Gross Zac Efron $274M Will Smith $179M Vin Diesel $210M Tom Cruise $209M Shia LaBeouf $352M
- 22. Robert pattinson $340M Robert Downey Jr. $809M Ray Romano $158M Owen Wilson $244M Matt Damon $214M Mark Wahlberg $284M Kristen Wiig $169M Kelly Macdonald $234M Jonah Hill $169M Johnny Depp $457M Jesse Eisenberg $181M Jennifer Lawrence $408M James McAvoy $193M James Franco $195M Jack Black $165M Emma Stone $170M Daniel Radcliffe $435M Daniel Craig $224M
- 23. Christian Bale $442M Chris Hemsworth $181M Chris Evans $177M Bradley Cooper $344M Ben Stiller $250M Andrew Garfield $261M Adam Sandler $214M 0.0%100.0% Avg. Sequel Status Genre AdventureActionThriller/SuspenseComedyRomantic ComedyDramaHorrorMusical $0M $100M $200M $300M $400M $500M $600M $700M G r o s s $0M $100M $200M $300M
- 43. Thriller/Suspense MPAA Rate Null G PG PG-13 R Module 05 Written Assignment - Borrowing to Finance Growth Here is some additional information to help with your case study review: · MorrisAnderson is a turnaround firm that provides company assessments and creates complete action plans to help move companies forward. For more information visit their site at: http://www.morrisanderson.com/. · EBITDA = is an accounting measure calculated using a company's net earnings, before interest expenses, taxes, depreciation and amortization are subtracted, as a proxy for a company's current operating profitability, i.e., how much profit it makes with its present assets and its operations on the products it produces and sells, as well as providing a proxy for cash flow. (Investopedia) · SG&A = Selling, General & Administrative Expense - Reported on the income statement, it is the sum of all direct and indirect selling expenses and all general and administrative expenses of a company. (Investopedia) Write your answers in the space provided for each of the questions below: 1. Why is it more difficult for healthcare companies to get expansion financing in the current economic situation? 2. Do you think that the checklist for expansion in the article would provide an in-depth overview of the company? Which ones do you think would be the most helpful? 3. Why did the bank require a turnaround firm to review the
- 44. medical device manufacturer company’s loan request? How did their EBITDA change from 2011 to 2012? Was this an indicator that something was wrong? 4. What were some of the positive aspects about the medical device contract manufacturer company’s desired growth? Why should they be considered for additional financing? 5. What were the 2 major issues with the Caribbean expansion the turnaround company found and why do you think they were brought up? 6. How were they able to finally get the needed financing for expansion? 7. Why may healthcare companies need to look beyond their banks to secure financing? Active DutyDISTRIBUTION OF ACTIVE DUTY SERVICESBY SERVICE, RANK, SEX, AND RACE-WITH HISPANIC INDICATOR03/31/2010*Hispanic Indicator is determined from the Service member's ethnic affinity code. Mexican, Puerto Rican, Cuban, Latin American with Hispanic descent and Other Hispanic descent are classified as "Hispanic." All other values are classified as "Non- Hispanic."OFFICERARMYO01O02O03O04O05O06O07O08O09 O10TOTALTOTALAMI/ALNHISP2080100100120NON- HISP49561148935910003530.5TOTAL51561228936911003650. 5ASIANHISP1564310000200NON- HISP4735551,3646832548511003,4164.5TOTAL4745601,37068 72578611003,4364.5BLACKHISP2214372312100001090.1NON - HISP1,1441,3053,5062,1611,197450138319,78812.8TOTAL1,1 661,3193,5432,1841,209451138319,89712.9MULTIHISP000000
- 78. Accountable)Produced in April 2010 by Defense Manpower Data Center &C&P ReserveDISTRIBUTION OF SELECTED RESERVISTBY SERVICE, RANK, SEX, AND RACE-WITH HISPANIC INDICATOR03/31/2010*Hispanic Indicator is determined from the Service member's ethnic affinity code. Mexican, Puerto Rican, Cuban, Latin American with Hispanic descent and Other Hispanic descent are classified as "Hispanic." All other values are classified as "Non-Hispanic."OFFICERARMY NATIONAL GUARDO00O01O02O03O04O05O06O07O08O09O10TOTALT OTALAMI/ALNHISP0120100000040NON- HISP02936422516600001540.5TOTAL03038422616600001580. 5ASIANHISP03512000000110NON- HISP0152279254112501511008642.6TOTAL015528425511450 1511008752.6BLACKHISP045103110000240.1NON- HISP044463075945425272141002,6267.9TOTAL044863576945 725373141002,6508MULTIHISP0000000000000NON- HISP0000000000000TOTAL0000000000000P/IHISP000000000 0000NON- HISP0000000000000TOTAL0000000000000WHITEHISP11832 402422161464862001,0843.3NON- HISP63,6985,8147,3795,2543,4641,330131540027,13081.7TOT AL73,8816,0547,6215,4703,6101,378137560028,21484.9UNKH ISP18515919880351630005771.7NON- HISP113923022388421610007402.2TOTAL2224389421168773 240001,3174TOTALHISP22764114513021826592001,7005.1N ON- HISP74,4626,9898,6575,9333,8241,439147560031,51494.9TOT AL94,7387,4009,1086,2354,0061,504156580033,214100MALE AMI/ALNHISP0020000000020NON- HISP02030352313600001270.4TOTAL02032352313600001290. 4ASIANHISP0321100000070NON- HISP012324421091401411007242.2TOTAL0126246211924014 11007312.2BLACKHISP04493110000220.1NON- HISP032245453333919858131001,9185.8TOTAL032645854234