
Recommended
Recommended
More Related Content
Similar to Popular Culture Helps Students Engage in Multimedia Projects
Similar to Popular Culture Helps Students Engage in Multimedia Projects (20)
More from gilbertkpeters11344
More from gilbertkpeters11344 (20)
Recently uploaded
Recently uploaded (20)
Popular Culture Helps Students Engage in Multimedia Projects
- 1. 483 Salika A. Lawrence | Kelly McNeal | Melda N. YildizBy using popular culture, teachers can help students engage in a variety of multimedia projects that help them make connections between reading, writing, and technology. Summer Program Helps Adolescents Merge Technology, Popular Culture, Reading, and Writing for Academic Purposes Research has documented that adolescents engage in many literacy prac- tices outside of school (Cutler, 1999; Fisher, 2003; Hinchman, Alvermann, Boyd, Brozo, & Vacca, 2003/2004; Mahiri & Sablo, 1996; Moje, 2000), where they have the choice and freedom to make their own decisions with
- 2. few restrictions and opportunities to interact with a wide array of texts in different forms. Recent reports suggest that today’s adolescents have “mul- tiple literacies” (King & O’Brien, 2002) because they interact with multiple forms of nontraditional texts and different sources of information, access popular culture and mass media, and communicate with people from diverse backgrounds and perspectives through the use of new technologies (Moore, Bean, Birdyshaw, & Rycik, 1999). Adolescents’ current reliance on technol- ogy prompts a redefinition of literacy that represents a generation of youths who read less print-based text (Collier, 2007) and rely instead on visual im- ages as a means of comprehending text while sorting through a plethora of digital information, technology, and media. Although they now “read” more images, youths still need and use critical thinking skills such as exploring
- 3. and critiquing the “text” when they shift through different sources of digital information. Previous research falls short of distinguishing between the technological literacy practices adolescents engage in outside of school, namely e-mailing and surfing the Web (Moore et al., 1999), and the academic and critical lit- eracy expectations identified in media and visual literacy standards, name- ly evaluating sources, synthesizing information, and using different media. These practices ref lect “21st-century literacies...[which] includes new ideas about what can be considered texts” (Collier, 2007, p. 4) and students’ interac- tions with those texts. Collier (2007) reported that students in our 21st-century context increas- ingly interact with nontraditional texts such as rap lyrics and graphic nov- els. In this context teachers have had to reexamine their classroom practices
- 4. Journal of Adolescen t & Adul t L i teracy 5 2 (6) March 2 0 0 9 doi:10 .15 9 8 /JA A L . 5 2 . 6 . 3 © 2 0 0 9 In ternat ional Reading A ssociat ion (pp. 4 8 3 – 4 9 4) 484 J o u rn a l o f A d o le sc e n t &
- 5. A d u lt L it e ra cy 5 2 (6 ) M a rc h 2 0 0 9 because of the increasing inf luence of technology on students’ literacy practices. The problem is that
- 6. teachers...assume students already know all the “tech stuff,” and need only to have their writing and think- ing skills sharpened.... First, not all students have tech- nological knowledge; second, even those who do have it need to know how to manage these skills. (Collier, 2007, p. 5) Bringing students’ out-of-school knowledge and experiences into the classroom can help adoles- cents meet in-school expectations (Hinchman et al., 2003/2004) and can prepare them for the real-life expectations they will encounter in the workplace (Collier, 2007). Frey and Fisher (2004) and Schwarz (2006) used students’ prior knowledge of popular cul- ture, specifically graphic novels, to address deficiencies they saw in students’ reading and writing. They found that using graphic novels—bound books of stories in comic form—was effective when teaching traditional elements of high school English curriculum, specifi- cally reading strategies such as making inferences and understanding vocabulary in context and writing prac- tices such as addressing a prompt and different audienc- es and creating engaging leads (Frey & Fisher, 2004). This article provides a description of a three-week, campus-based summer literacy program that provided opportunities for adolescents to develop multiple lit- eracy skills. We, the university faculty working with a group of high school students, sought to build upon students’ interest in popular culture with traditional academic tasks such as reading, writing, and conduct- ing research to bridge the gap between adolescents’ in-school and out-of-school practices. We created a curriculum to build upon the proficiencies we be- lieved the students brought with them to the program
- 7. (e.g., technology skills and media literacy) to further develop their literacy skills in other areas, namely reading and writing. Although others have used com- ic books as a strategy to engage students as readers (Bitz, 2004), we sought to introduce the technology component to merge all of these literacy practices to- gether. We believed that if we used popular culture to engage a group of 12 urban high school students in a variety of multimedia projects, they would make con- nections between reading, writing, and technology. Description of the Context and Participants Four full-time faculty members, three of whom wrote this article, immersed students in a three-week exploration of graphic novels during the summer of 2007. The faculty included one literacy professor who teaches in a masters reading program and two pro- fessors who teach in a teacher education program for candidates seeking secondary certification. One of these faculty members is an urban education profes- sor, and the other is an educational media and tech- nology educator who teaches several online courses. The fourth faculty member who worked in this sum- mer program is a professor who teaches mathematical methods courses. The students who participated in the program are members of the Paterson Teachers for Tomorrow (PT4T) program, which is part of an urban, school– community partnership with the university. PT4T seeks to recruit, prepare, and support new teachers who commit to return to the Paterson Public School District once they complete their college education and teacher certification. Each summer the high school students participate in a three-week summer
- 8. program at the William Paterson University cam- pus in northern New Jersey. A group of 12 African American and Hispanic students participated in the 2007 summer program. In this article we use pseud- onyms to refer to the participants. The students participated in a series of two-hour sessions each day: SAT Math Test Prep, Technology, Reading, and Writing. This article focuses on the multiple literacy practices that occurred during tech- nology, reading, and writing sessions. The curriculum we developed for the reading and writing sessions fa- cilitated discussions about contemporary social issues that we believe moved students closer to becoming change agents in their communities. The activities provided opportunities for students to examine and discuss social issues in hopes of increasing their per- ceptions of themselves as community leaders and change agents. Ongoing ref lection during the three weeks of the program helped us integrate the ele- ment of social justice and grass roots with community change throughout the curriculum. 485 S u m m e r
- 11. a n d W ri ti n g f o r A ca d e m ic P u rp o se s Components of the program were also strongly
- 12. inf luenced by research on popular culture, students’ in- and out-of-school literacy practices, and the dif- ferences often evident in students’ literacy practices as they code switched when communicating in dif- ferent contexts and with different audiences (Ball, 1992, 1995, 1996; Cutler, 1999; Fisher, 2003; Frey & Fisher, 2004; Hinchman et al., 2003/2004; Mahiri & Sablo, 1996; Moje, 2000; Moje, Young, Readence, & Moore, 2000). Taking a cue from the studies we re- viewed, we chose several graphic novels for students to read as common texts and for independent read- ing. The common texts were Malcolm X: A Graphic Biography by Andrew Helfer and Randy Duburke and Persepolis 2: The Story of a Return by Marjane Satrapi. While several outcomes were noted with regard to students’ reading of graphic novels, this article focuses on the impact made when we combined technology, comics, and graphic novels and engaged students in reading and writing activities. We distinguished com- ics from graphic novels by noting that graphic novels are “a longer and more artful version of the comic book bound as a ‘real’ book” (Schwarz, 2006, p. 58) that provide a means for exploring and developing multiple literacies (Schwarz, 2006). Data Collection and Analysis Various artifacts, namely the students’ work, their comments, our lesson plans, ref lective notes, and the rubric we created to evaluate the students’ culminat- ing project, were obtained from the summer program. Students’ work consisted of their journal entries, re- sponses to the texts they read, and their individual and group projects. Students’ comments were ob- tained through surveys and conferences with faculty. Ref lective notes from faculty were obtained during meetings, and periodic modifications were made to
- 13. the curriculum. For instance, we did not initially have a rubric for students’ projects, so we decided to co- create a rubric with the students as we introduced the requirements of the project with them. This process helped clarify expectations for the students. We sought to examine the authentic practices of the participants as they occurred throughout the pro- gram. To this end, document and content analyses were used to review the artifacts we collected “as objective indicators of phenom- ena to which they re- fer, and [analyze] the content of a document” (Henn, Weinstein, & Foard, 2006, p. 98). Content analysis was also used to chunk the data (Wolcott, 2001). We used the themes that emerged as a way to gain insights into the learn- ing experiences and ac- tivities that both faculty and students engaged in during the program. Practices That Connect Reading, Writing, and Technology We (the faculty members) taught minilessons to model reading, writing, and technology strategies. These minilessons were presented in different set- tings. Although each subject was taught indepen- dently, we were each available for consultation or to visit the classrooms. Subject-specific minilessons
- 14. (e.g., technology, reading comprehension, writing) were incorporated into all three of our teaching ses- sions and included strategies for comprehending visual texts, writing comics, learning the research process, and understanding technological basics such as how to use a USB port as well as relevant technological applications. Minilessons were taught in the class- room because we had access to a console and projec- tion screen where we could model various strategies and tasks the students were expected to complete. After each minilesson, the class went to the computer lab where students had hands-on time working on the activities introduced and demonstrated in class. Students practiced using the strategies in groups and independently. Some of the lessons included search- ing for information on the Internet, deconstructing commercials, writing an online book review, and using reading strategies such as making connections and asking questions. We used comics and excerpts from graphic novels as shared texts to model read- ing strategies through think-alouds (Wilhelm, 2001). We did not initially have a rubric for students’ projects, so we decided to cocreate a rubric with the students as we introduced the
- 15. requirements of the project with them. 486 J o u rn a l o f A d o le sc e n t & A d
- 16. u lt L it e ra cy 5 2 (6 ) M a rc h 2 0 0 9 Minilessons also focused on discussing the impor- tance of word choice, voice, and tone encountered in text. We also asked students to write short pieces for wordless comics (Frey & Fisher, 2004), such as writ- ing captions and dialogues to change the tone and
- 17. voice of the text while matching visual elements in the pictures. Short stories written in comic form se- lected from Will Eisner’s New York: Life in the Big City were also used as writing prompts. During the reading sessions students participated in silent reading, whole-group and small-group dis- cussions about common texts (the graphic novels), journal writing about both common and independent texts, responding to reading through writing, one-on- one conferencing between faculty and students, and small-group activities to explore social issues discussed in class and in the texts. The writing minilessons fo- cused on writing for authentic purpose and real world audiences. Students were shown how to distinguish between narrative and informational texts. They were also provided with opportunities to closely exam- ine techniques used by the authors and illustrators of the graphic novels they were reading independently. We noted how the authors and illustrators used space on the page and the panels to lay out the story using images and different types of text. The writing ses- sions also focused on informational writing, research, and publishing writing using Microsoft Word and PowerPoint, as well as conducting Internet research. During the technology sessions, students used Macintosh computers to learn about the Comic Life Software by Plasq. Then they used the software to create comics that combined visual images with the text. Comic Life has a simple interface. This software application can be used to create greeting cards, photo albums, storybooks, instructional handouts and bro- chures, storyboarding video projects, and comics or graphic novels. The software provides students with the opportunity to create their own comic in digi-
- 18. tal form. It also has options for creating comics with different page layouts with boxes, images, and text. There are many different filters, effects, word and thought balloons, and templates that can be applied to create different types of documents that turn texts and images into comic form. For example, the students selected and inserted various fonts and manipulated the size of fonts and shapes of the images to choose the visuals that best fit their project. As indicated in Table 1, the minilessons and in-class media literacy activities sought to scaffold students through a learning process in which they gradually became more proficient with the software by completing different hands-on activi- ties. To increase students’ proficiencies in media lit- eracy, we taught lessons on deconstructing magazine and television advertisements, as well as news stories. Students had hands-on time working in two differ- ent computer labs: one lab had Macintosh computers loaded with Comic Life and the other had personal computers (PCs) loaded with Microsoft Office. In the PC lab, students used word-processing functions and prepared PowerPoint presentations in which they re- sponded to their individual texts. During the program students were asked to create four projects: an individual comic, a group research project and informational comic strip, an individual reader response project, and an individual book cri- tique. The two projects created using Comic Life, the individual comic and the group research project and informational comic strip, were vastly different. The former required that students write a comic strip about themselves. Students created narratives about their lives and used the software to produce a comic version of the story. During lab time, students used
- 19. techniques learned from the book Understanding Comics by Scott McCloud (1994) to explore concepts such as templates for manga and graphic novels. The latter project students created with Comic Life, the group research project and informational comic strip, was more comprehensive. To connect to the central theme of community in the PT4T program, we believed that a research project would provide opportunities for students to develop their critical literacy while increasing their awareness of issues relating to social justice. These kinds of academic tasks promote critical literacy because students were challenged to “make use of literacy tools to navigate, resist, construct, and reconstruct popular, academic, and work cultures” (Moje et al., 2000, p. 211). In class, we brainstormed several social problems facing their community today. Some of the topics were gang violence, homelessness, and hate crimes, to name a few. The students also dis- cussed other issues that exist on a larger scale, namely 487 S u m m e r P ro
- 22. d W ri ti n g f o r A ca d e m ic P u rp o se s digital camera. Some of the students drew their own illustrations and scanned them into the computer. Few of the students who used the digital camera
- 23. to take pictures for their project were familiar with how to upload pictures to the computer. With guid- ance from us, all of the students were able to success- fully do this task by the third week. Because the few students who owned computers did not have access to Macintosh computers at home, and therefore had dif- ficulty accessing and viewing their work, a minilesson was taught on how to export their comics as HTML, image, or QuickTime files and how to then e-mail these files to themselves so that they could work on the projects remotely if they had computers at home and so that they could share the projects with a wider audience. All of the students also printed hard copies of their comics to share with the class during their final presentation on the last day of the program. While creating individual comic strips, the stu- dents created title and speech bubbles in a variety of global warming, human trafficking, and modern-day slavery. It was expected that the informational comic strip they created should inform or persuade their au- dience to take action in response to the social problem depicted in their text. Using Technology to Facilitate Students’ Creation of Text We found that all of the students were engaged with technology while completing their tasks. While working with the Comic Life software, students
- 24. dragged and dropped various images onto the page to digitally alter photos and graphics to look like comic drawings. None of the students used the computer to draw images. Most of the images students used were downloaded from the Internet, pictures they had saved on their USB drives, or pictures downloaded from a personalized Flickr site, which was established to store pictures students were taking in class using a Table 1 Media, Information, and Technology Literacy Activities That Occurred During the Technology Workshop Week Activities/topics 1 Preproduction Day 1 Media literacy dia images and advertisement
- 25. Day 2 Computer basics time 2 Production Day 1 Information literacy (e.g., Google) -on lab time Day 2 Media production roject
- 26. individual project copies of the individual project -on lab time 3 Postproduction Work on group project during hands-on lab time -on lab time 488 J o u rn a l o f A d o le
- 28. 2 0 0 9 styles. They experimented with elements of the comic medium. Some students included speech bubbles out- side of the frame and captions to provide the reader with additional information about the story—these elements are often seen in comics. Students seemed excited to figure out the software and its capabilities— they cut and pasted text and images, manipulated the size and shapes of the layout, and shared new insights with the group when they found a layout pattern that enhanced the images and text they inserted. Other students were able to add text and bubbles with relative ease. We observed that this was often the first thing they did when they started working on a comic tem- plate. The students’ writing process consisted of iden- tifying the pictures (either downloading photographs from Flickr or inserting illustrations they created) and including them in the comic template. Then students wrote text to go along with the pictures. During con- ferences with the instructor, students were questioned and prompted to add more details, to rearrange text to better connect to the images they inserted, or to find a better image to connect with the text they wrote. While writing, students used various literary devices in their narrative such as dialogue, irony, and f lash- back. To support the limited text in each comic, the students also used transitional words, color, and set- ting to show time change. The students also tested how to alter their images and change them to comic form, but most of them left their pictures unfiltered in the final product.
- 29. For the culminating project students worked in groups to conduct research and share what they learned about their selected topic with a wider au- dience via an informational comic. Students were randomly assigned to groups ranging in size from two to four members. Each group selected a topic—a contemporary issue relating to social justice, which they knew little about. Once a topic was chosen, the groups researched this issue before creating their in- formational comic about the topic. The students cre- ated five- to six-panel comic strips using Comic Life by synthesizing and summarizing information in the form of texts and visuals that they obtained through research. Some modeling and guidance occurred in small groups where we provided students with one-on-one support. For example, when a group appeared to be having difficulty obtaining sources in the computer lab, one faculty member walked over to provide them with assistance: Faculty member: What are you guys doing? Patricia: We have thoughts in our head, but we want to see if there are other options. Faculty member: You want to combine pictures with your artwork? Patricia: We want to see if there are things that would make the messages [in their comic] stronger.
- 30. Faculty member: Have you looked at The New Yorker website? They have pictures of the environment or pollution. You can check there. Make sure you write that down as one of your sources. We used the one-on-one and small-group confer- ences for a variety of purposes: 1. Explaining how to complete tasks on the com- puter (e.g., inserting pictures, cutting and past- ing pictures into the Word document, changing the size and color of font in their projects) 2. Brainstorming options for presenting their work to the audience based on the type of text they wanted to share (e.g., poem about the character) 3. Modeling how to write and post an online book review, how to search the Internet for in- formation, and how to save to the USB drive 4. Providing students with suggestions and re- search strategies to help them progress through the writing process 5. Asking students questions to ascertain their needs and then guiding them through their projects Students were frequently observed using tech- niques that had been modeled by us during whole-class minilessons. For example, while conducting research in the computer lab for his group project, Brian was
- 31. overheard saying to his group member “She showed 489 S u m m e r P ro g ra m H e lp s A d o le sc
- 34. e m ic P u rp o se s by making connections to their prior knowledge and across texts (Gruber & Boreen, 2003). Students Use Technology When Responding to Text We provided students with a list of reader response options from which they could choose how to re- spond to the graphic novel they read independently. Some of the options included 1. Write and illustrate a poem 2. Write a critique of the book 3. Make text-to-text, text-to-self, and text-to- world connections For two weeks students worked on their read- er response project, which required them to select how they would respond to their independent read- ing book, to complete the response, and to prepare
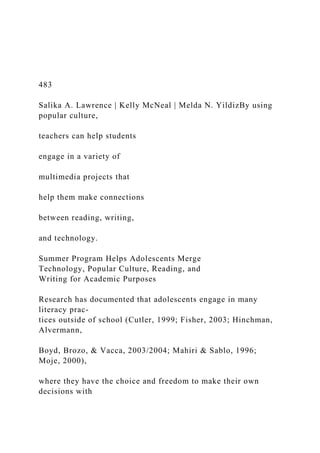
- 35. us Google.” He was referring to a minilesson where one faculty member modeled how to narrow a search using key terms through the advanced search op- tion on the Google search engine. During one lesson the students learned how to use the advanced search option to distinguish between .com, .gov, .org, and .net sites during the research process. The instruc- tor showed students how to explore different search engines for different purposes. She showed them how to eliminate commercial sites by putting (–) minus in front of “.com” or (+) in front of “.edu” to distinguish between sites. This technique introduced students to a strategy for refining the results that appear after an initial search using a search engine. As the instruc- tor modeled using the computer, she showed students how to scan the results from a search to distinguish government and nonprofit websites. She showed the class different websites and talked about the credibil- ity issues they might encounter with certain websites (e.g., false or incomplete information, out-of-date information). A close look at students’ group projects docu- ments students’ knowledge of the social issues they explored and their ability to critically analyze text when provided with the time to examine, research, and discuss texts with peers (Moje, 2000). The stu- dents created comics about pollution and global warming, genocide, and modern-day slavery. Figure 1 is the culminating project produced by one group of students, using Comic Life. These students were interested in researching and raising awareness in their readers about the topic of modern slavery. Students researched this issue and then chose a few key facts from their research to incorporate into this comic. This group then linked their background
- 36. knowledge of slavery in the United States, prior to the U.S. Civil War, to the issue of modern slavery. They searched the Internet and found relevant pic- tures to incorporate into their comic. We found that by the third session (4.5 hours of work) this group had researched and discussed the issue, obtained relevant graphics, and completed a comic that demonstrated their knowledge about the subject and connected it to prior knowledge. We learned that students’ in-class experiences led them to engage in more in-depth and evaluative conversations of issues in the larger society Figure 1 One Group’s Culminating Project About Modern Slavery Note. Images A, B, and F do not require copyright permission. Images C, D, and E are photography by cour tesy Shiho Fukada. B E F G D C A 490
- 38. ra cy 5 2 (6 ) M a rc h 2 0 0 9 In addition to using technology to enhance their reader responses and creating both individual and group comics, each student also wrote and uploaded to the Barnes and Noble website a critique of one of the graphic novels they read independently. As noted above, we showed students where to upload their book critiques onto the website. Despite the lessons taught and comments students made to us about their dislike of some of the books, we found that students only wrote and submitted positive reviews of their inde- pendent reading graphic novels; none of the students wrote negative critiques. We observed this disparity
- 39. numerous times while working with the students. For example, many students complained to us that a presentation using PowerPoint. Students’ journals revealed that the majority of the students were able to produce concise and informative responses as the sessions progressed, to incorporate dialogue into their stories, and to expand their written vocabularies. Most of the students responded to their reading by writing songs and poetry. Students also used word processing to produce final drafts of their responses. Several stu- dents manipulated the font sizes and styles to convey meaning or ideas in their response. The students were required to present their read- er responses to the class and had the option of using PowerPoint. Figure 2 is an example of slides from one student’s presentation of a poem that she wrote. Figure 2 One Student’s Reader Response Presentation • Wanting to do well for parents sake • The need to fit in, to be accepted, a change in pace • A change in her face, problems create anxiety • And then every thing subsides and there is peace. Persepolis Poem By CN
- 40. • Alone and confused out of place • A foreign place, not the same • A bitter sweet taste • Lonely in a world confusing and over bearing not at ease • An outsider in a new place • Small cramped space 491 S u m m e r P ro g ra m H e lp
- 43. f o r A ca d e m ic P u rp o se s Natasha: Mine say Background [sic]. Oharia [pointing to the computer screen]: Click this. Click this. OK. Click this one. While showing Natasha how to change the back- ground of her PowerPoint slide, Oharia didn’t realize that she could click on the drop down menu to see options for changing the background. When Natasha opened the drop down window, Oharia moved her chair over to Natasha’s computer and continued to give directions by pointing to the screen.
- 44. By the end of the program, students developed proficiency using various technology tools, such as PowerPoint, Comic Life, and uploading as well as downloading pictures. Many of the students were ob- served multitasking while working on their projects. They were observed visiting social networking sites like MySpace and Facebook, checking e-mail, im- porting pictures to Flickr, as well as visiting YouTube and watching music videos. Students were observed simultaneously talking to peers and working indepen- dently on their PowerPoint presentations and typing the final draft of their reader response in the word pro- cessor or working on their group projects. Working on all of these tasks simultaneously did not appear to hinder their progress or concentration. During lab times, students were engaged in their project while helping one another with technology and sharing their ideas. While working on the computer, students had multiple screens open (i.e., one for search engine, one for Comic Life, one for background music). In one breath, the students sought examples and guidance for their projects from peers, and in the next, they talked about a video the rest of the group should look at on YouTube. During the groups’ presentations of their comics, all of the students effectively used technol- ogy to present their work. For their final comics, they overlaid text and pictures in the panels and used differ- ent panel shapes. In addition, during the final presen- tations we saw that most of the students incorporated pictures, different colors and font sizes, different layout designs and backgrounds, sound, and animation. Discussion and Implications Lattimer (2003) believed that teachers need to or- ganize the curriculum to provide students with
- 45. they did not enjoy reading McCloud’s Understanding Comics, but none of the students choose to critique this text online. Similarly, one student spoke pas- sionately about the book King, Volume 2 by Ho Che Anderson, expressing his grave dissatisfaction with the period of Martin Luther King’s life depicted in the text. Although this student was encouraged to cri- tique the book online, the student chose to submit a favorable review of another book he read—Malcolm X: A Graphic Biography—instead of the book he dis- liked—King, Volume 2. It appears that the students who spoke critically about several of the texts were not confident enough about their own opinions to write and upload to the Internet their negative views of published works. Students’ Knowledge of Technology Our initial sessions in the computer labs revealed that at least half of the students were not familiar with how to use spell check in PowerPoint, and about the same amount had difficulty changing font and spacing sen- tences in Word. More than half of the students did not know how to use PowerPoint past opening the appli- cation and using black font on white background. The majority of the students (8 out of 12) had difficulty saving to a USB drive, and none of the students knew how to use Excel. We learned that 5 out of 12 students had comput- ers at home. One student who did not have a computer at home indicated that she goes to her friend’s house to use the computer. Only 2 of the 12 students, who were seniors in high school, said they had taken technology classes in school. From the inception, we saw that there were some students who were more proficient with the technology than others. We also observed that the
- 46. more proficient students often helped less technology- literate students prepare their PowerPoint slides and search for online images and music to enhance their presentations. Below is an interaction documenting how one student, Oharia, helped a less proficient stu- dent, Natasha, while they each worked on their re- spective PowerPoint projects in the lab. Oharia: OK. Go here to Format and click on Background. Mine don’t say Background [sic]. 492 J o u rn a l o f A d o le sc e
- 48. 0 9 students bring a vast knowledge of technological lit- eracy, and teachers can tap into them as a resource in the classroom. Students in our summer program who were knowledgeable about comics and graphic novels as well as technology were used as resources in the class to help those students who were less profi- cient in those areas. Students who previously had little knowledge of graphic novels became more interested in reading graphic novels and comics about different people and topics because of the visual composition of these texts. Similarly, the students were motivated to complete innovative computer-based tasks. We were surprised to see that most of the students struggled with what we perceived to be basic tech- nology skills such as changing fonts, uploading pic- tures, using USB drives, and using different software, namely PowerPoint. The culminating project we as- signed was an important part of the students’ multiple literacy development. With support from peers and us during the three-week program, all students demon- strated improvement in informational literacy. While conducting research for their culminating project— the informational comic about a social issue—students further developed their research skills. The process we used for this project can be a blueprint for secondary teachers who want to engage students in conducting meaningful research. Specifically, teachers should ask students to 1. Select research topics, issues, or problems with social significance
- 49. 2. Use a variety of online sources to learn about the issue and, if applicable, identify solutions to this problem 3. Summarize and synthesize the information they gather via research 4. Identify an audience with whom to share their research 5. Create informational text and visuals to share with a wider audience using a nontraditional format (e.g., comic) We recognize that facilitating activities similar to those we used in our summer program might be difficult for some teachers who have limited experi- ences with technology. This should not deter teachers opportunities to interact with a wide variety of texts and that students need opportunities to produce their own text. The curriculum we cre- ated for our summer program helped us see the benefits of provid- ing students with the opportunity to produce their own text when using technology. Our students were able to increase their understanding of communicating with texts and visuals, develop their writing by synthesiz-
- 50. ing informational text, and increase their knowledge of technology. Connecting reading, writing, visual, and technological literacy provided students with op- portunities to write for wider audiences and to pro- duce authentic texts such as online book reviews. Cambourne (2002) talked about the importance of immersing learners in environments that support their literacy development. Biancarosa and Snow (2003, 2004) believed that learning experiences of students should include opportunities that help stu- dents see connections between topics and help them make connections to the real world. When imple- menting a curriculum, secondary teachers can select materials and media resources to teach media literacy and provide opportunities for students to produce their own media by immersing students in learn- ing environments that facilitate their understanding of text and visuals. Integrating a variety of materials and instructional approaches provides teachers with the opportunity to better meet the needs of students through interdisciplinary connections, which pre- vious research as well as this research project dem- onstrates are meaningful to adolescent learners by connecting to their prior knowledge and experiences outside of school. Additionally, secondary teachers can ask students to work in groups to complete proj- ects that connect reading, writing, visual, media, and technological literacies We believe that teachers should use students’ pri- or knowledge and familiarity with popular culture to teach reading and writing (Frey & Fisher, 2004). Some The curriculum we created for our
- 51. summer program helped us see the benefits of providing students with the opportunity to produce their own text when using technology. 493 S u m m e r P ro g ra m H e lp
- 54. f o r A ca d e m ic P u rp o se s from trying because there are a few things they can do to begin incorporating technology into the cur- riculum. Collier (2007) suggested that teachers can help “students thrive in the world of 21st-century literacy...[by becoming] f luent in the language of newer technologies” (p. 4). Additionally, to facilitate meaningful experiences that merge technology with reading and writing, “teachers...need to develop three dimensions of knowledge” ( Jones & Moreland, 2004, p. 123)—knowledge about technology as a content area, knowledge in technology, and knowledge about teaching technology. This knowledge of teaching
- 55. technology also requires that teachers are aware of the teaching and learning process so they understand “stu- dents learn more effectively when the teacher struc- tures new information, [by] relating it to [their] prior knowledge, monitoring the learning and providing effective feedback” to students ( Jones & Moreland, 2004, p. 124). We found that our students were able to increase their experiences with technology after listening to minilessons, attending conferencing ses- sions, and drawing on the support from peers who were more proficient in technology. Although some educators may be reluctant to promote the incorporation of graphic novels comic creation into their curriculum (Méndez, 2004), Potter (1998) argued that it is important to provide students with tools to produce their own media. We believe that by incorporating new literacies into our curricu- lum we effectively created activities for students to read and write for enjoyment, further develop infor- mation literacy and research skills such as summariz- ing and synthesizing information from a variety of sources, and increase students’ awareness of audience by creating their own informational text. In contrast, using technology to produce their own reader responses did little to increase students’ ability and willingness to critique the texts. Future research should explore how secondary English lan- guage arts teachers can help adolescents develop criti- cal literacy by using alternative forms of nontraditional texts. These studies should document the extent to which students engage in critical literacy practices and their perceptions of these acts and the extent to which classroom contexts facilitate or hinder adolescents’ critical literacy practices.
- 56. Re f er ence s Ball, A.F. (1992). Cultural preference and the expository writing of African American adolescents. Written Communication, 9(4), 501–532. doi:10.1177/0741088392009004003 Ball, A.F. (1995). Text design patterns in the writing of urban African American students: Teaching to the cultural strengths of students in multicultural settings. Urban Education, 30(3), 253–289. doi:10.1177/0042085995030003002 Bal l, A.F. (1996). Expositor y wr iting patter ns of A fr ican American students. English Journal, 85(1), 27–36. Biancarosa, G., & Snow, C. (2003). Adolescent literacy and the achievement gap: What do we know and where do we go from here? New York: Carnegie Corporation of New York. Retrieved November 1, 20 04, f rom w w w.a l l4ed.org/resources/ CarnegieAdolescentLiteracyReport.pdf Biancarosa, G., & Snow, C. (2004). Reading next—A vision for action and research in middle and high school literacy: A report to Carnegie Corporation of New York. Washington, DC: Alliance for Excellent Education. Bitz, M. (2004). The comic book project: Forging alternative pathways to literacy. Journal of Adolescent & Adult Literacy, 47(7), 574–586. Cambourne, B. (2002). Holistic, integrated approaches to reading and language arts instruction: The constructivist framework
- 57. of an instructional theory. In A.E. Farstrup & S.J. Samuels (Eds.), What research has to say about reading instruction (pp. 25– 47). Newark, DE: International Reading Association. Collier, L. (2007). The shift to 21st-century literacies. The Council Chronicle, 17(2), 4–8. Cutler, C.A. (1999). Yorkville crossing: White teens, hip hop, and African American English. Journal of Sociolinguistics, 3(4), 428–442. doi:10.1111/1467-9481.00089 Fisher, M.T. (2003). Open mics and open minds: Spoken word poetry in African diaspora participatory literacy communi- ties. Harvard Educational Review, 73(3), 362–389. Frey, N., & Fisher, D. (2004). Using graphic novels, anime, and the Internet in an urban high school. English Journal, 93(3), 19–25. doi:10.2307/4128804 Gruber, S., & Boreen, J. (2003). Teaching critical thinking: Using experience to promote learning in middle school and college students. Teachers and Teaching: Theory and Practice, 9(1), 5– 19. doi:10.1080/1354060032000049878 Henn, M., Weinstein, M., & Foard, N. (2006). A short introduction to social research. London: Sage. Hinchman, K.A., Alvermann, D.E., Boyd, F.B., Brozo, W.G., & Vacca, R.T. (2003/2004). Supporting older students’ in- and out-of-school literacies. Journal of Adolescent & Adult
- 58. Literacy, 47(4), 304–310. Jones, A., & Moreland, J. (2004). Enhancing practicing primary school teachers’ pedagogical content knowledge in technol- ogy. International Journal of Technology and Design Education, 14(2), 121–140. doi:10.1023/B:ITDE.0000026513.48316.39 King, J., & O’Brien, D. (2002). Adolescents’ multiple literacies and their teachers’ needs to know: Toward a digital détente. In D.E. Alvermann (Ed.), Adolescents and literacies in a digital world (pp. 40–50). New York: Peter Lang. Lattimer, H. (2003). Thinking through genre: Units of study in reading and writing workshops 4–12. Portland, ME: Stenhouse. 494 J o u rn a l o f A d
- 60. h 2 0 0 9 Ma h ir i, J., & Sablo, S. (1996). Wr it ing for their l ives: The non-school literacy of Califor nia’s urban A fr ican American youth. Journal of Negro Education, 65(2), 164–180. doi:10.2307/2967311 McCloud, S. (1994). Understanding comics: The invisible art. New York: HarperCollins. Méndez, T. (2004, October 12). Hamlet too hard? Try a comic book. The Christian Science Monitor. Retrieved November 30, 2008, from www.csmonitor.com/2004/1012/p11s01-legn .html Moje, E.B. (2000). “All the stories that we have”: Adolescents’ in- sights about literacy and learning in secondary schools. Newark, DE: International Reading Association. Moje, E.B., Young, J.P., Readence, J.E., & Moore, D.W. (2000). Reinventing adolescent literacy for new times: Perennial and millennial issues. Journal of Adolescent & Adult Literacy, 43(5), 400–410. Moore, D.W., Bean, T.W., Birdyshaw, D., & Rycik, J.A. (1999).
- 61. Adolescent literacy: A position statement for the Commission on Adolescent Literacy of the International Reading Association. Newark, DE: International Reading Association. Potter, W.J. (1998). Media literacy. London: Sage. Schwarz, G. (2006). Expanding literacies through graphic novels. English Journal, 95(6), 58–64. Wilhelm, J.D. (2001). Improving comprehension with think- aloud strategies: Modeling what good readers do. New York: Scholastic. Wolcott, H.F. (2001). Writing up qualitative research (2nd ed.). Thousand Oaks, CA: Sage. Lawrence teaches at William Paterson University, Wayne, New Jersey, USA; e-mail [email protected] McNeal teaches at William Paterson University; e-mail [email protected] teaches at William Paterson University; e-mail [email protected]
- 62. Net Present Value: First Principles of Finance Appendix 4A Copyright © 2013 by the McGraw-Hill Companies, Inc. All rights reserved. McGraw-Hill/Irwin * 4A-* Key Concepts and SkillsUnderstand the theoretical foundations of the Net Present Value (NPV) rule * 4A-* Appendix Outline 4A.1 Making Consumption Choices over Time 4A.2 Making Investment Choices 4A.3 Illustrating the Investment Decision * 4A-* Making Consumption Choices over TimeAn individual can alter
- 63. his consumption across time periods through borrowing and lending.We can illustrate this by graphing consumption today versus consumption in the future.This graph will show intertemporal consumption opportunities. * 4A-* Intertemporal Consumption Opportunity Set A person with $95,000 who faces a 10% interest rate has the following opportunity set. One choice available is to consume $40,000 now; invest the remaining $55,000; consume $60,500 next year. $0 $20,000 $40,000 $60,000 $80,000 $100,000 $120,000 Consumption today
- 64. $0 $20,000 $40,000 $60,000 $80,000 $100,000 $120,000 Consumption at t+1 * 4A-* Intertemporal Consumption Opportunity Set $0 $20,000 $40,000 $60,000 $80,000 $100,000 $120,000 $0 $20,000 $40,000 $60,000 $80,000 $100,000
- 65. $120,000 Consumption today Consumption at t+1 Another choice available is to consume $60,000 now; invest the remaining $35,000; consume $38,500 next year. * 4A-* Taking Advantage of Our Opportunities $0 $20,000 $40,000 $60,000 $80,000 $100,000 $120,000 $0 $20,000 $40,000 $60,000 $80,000 $100,000 $120,000 Consumption today Consumption at t+1 A person’s preferences will determine what point on the
- 66. opportunity set she will choose. Ms. Patience Ms. Impatience * 4A-* Changing Our Opportunities $0 $20,000 $40,000 $60,000 $80,000 $100,000 $120,000 $0 $20,000 $40,000 $60,000 $80,000 $100,000 $120,000 Consumption today Consumption at t+1 A rise in interest rates will make saving more attractive … …and borrowing less attractive.
- 67. Consider an investor who has chosen to consume $40,000 now and to consume $60,000 next year. * The point at which the intertemporal opportunity set pivots depends upon where your endowment is when interest rates change. If the person had $95,000 in current consumption and no future consumption, the pivot would have been at the x-axis intercept. 4A-* Illustrating the Investment DecisionConsider an investor who has an initial endowment of income of $40,000 this year and $55,000 next year.Suppose that she faces a 10-percent interest rate and is offered the following investment. Cash inflows Time Cash outflows 0 1 -$25,000 $30,000 * 4A-*
- 68. Illustrating the Investment Decision $0 Consumption today Our investor begins with the following opportunity set: endowment of $40,000 today, $55,000 next year and a 10% interest rate. One choice available is to consume $15,000 now; invest the remaining $25,000 in the financial markets at 10%; consume $82,500 next year. $0 $99,000 Consumption at t+1 $90,000 $55,000 $82,500 $40,000 $15,000 * 4A-* Illustrating the Investment Decision $0
- 69. Consumption today A better alternative would be to invest in the project instead of the financial markets. She could consume $15,000 now; invest the remaining $25,000 in the project at 20%; consume $85,000 next year. $0 $99,000 Consumption at t+1 $90,000 $55,000 $82,500 $40,000 $85,000 $15,000 With borrowing or lending in the financial markets, she can achieve any pattern of cash flows she wants—any of which is better than her original opportunities. *
- 70. 4A-* Illustrating the Investment Decision $0 Consumption today Note that we are better off in that we can command more consumption today or next year. $0 $99,000 Consumption at t+1 $101,500 $101,500 = $15,000×(1.10) + $85,000 $90,000 $92,273 $55,000 $82,500 $40,000 $85,000 $15,000 $92,273 = $15,000 +
- 71. * 4A-* Net Present ValueThe value created by the investment opportunity increased our possible consumption.This opportunity, therefore, created value.The current value of the opportunity is the investment’s NPV. * 4A-* Quick QuizWhat factors determine our consumption next year?How do investment opportunities create value? * 1 1 ) 10 . 1 ( 000 , 85
- 72. $ Discounted Cash Flow Valuation Chapter 4 Copyright © 2013 by the McGraw-Hill Companies, Inc. All rights reserved. McGraw-Hill/Irwin * 4-* Key Concepts and SkillsBe able to compute the future value and/or present value of a single cash flow or series of cash flowsBe able to compute the return on an investmentBe able to use a financial calculator and/or spreadsheet to solve time value problemsUnderstand perpetuities and annuities * 4-* Chapter Outline 4.1 Valuation: The One-Period Case 4.2 The Multiperiod Case 4.3 Compounding Periods
- 73. 4.4 Simplifications 4.5 Loan Amortization 4.6 What Is a Firm Worth? * 4-* 4.1 The One-Period CaseIf you were to invest $10,000 at 5- percent interest for one year, your investment would grow to $10,500. $500 would be interest ($10,000 × .05) $10,000 is the principal repayment ($10,000 × 1) $10,500 is the total due. It can be calculated as: $10,500 = $10,000×(1.05) The total amount due at the end of the investment is call the Future Value (FV). * 4-* Future ValueIn the one-period case, the formula for FV can be written as: FV = C0×(1 + r) Where C0 is cash flow today (time zero), and
- 74. r is the appropriate interest rate. * It may be helpful to identify r as the opportunity cost. 4-* Present ValueIf you were to be promised $10,000 due in one year when interest rates are 5-percent, your investment would be worth $9,523.81 in today’s dollars. The amount that a borrower would need to set aside today to be able to meet the promised payment of $10,000 in one year is called the Present Value (PV). Note that $10,000 = $9,523.81×(1.05). * 4-* Present ValueIn the one-period case, the formula for PV can be written as: Where C1 is cash flow at date 1, and r is the appropriate interest rate. *
- 75. 4-* Net Present ValueThe Net Present Value (NPV) of an investment is the present value of the expected cash flows, less the cost of the investment.Suppose an investment that promises to pay $10,000 in one year is offered for sale for $9,500. Your interest rate is 5%. Should you buy? * 4-* Net Present Value The present value of the cash inflow is greater than the cost. In other words, the Net Present Value is positive, so the investment should be purchased. * 4-* Net Present Value In the one-period case, the formula for NPV can be written as: NPV = –Cost + PV If we had not undertaken the positive NPV project considered on the last slide, and instead invested our $9,500 elsewhere at 5 percent, our FV would be less than the $10,000 the investment promised, and we would be worse off in FV terms :
- 76. $9,500×(1.05) = $9,975 < $10,000 * 4-* 4.2 The Multiperiod CaseThe general formula for the future value of an investment over many periods can be written as: FV = C0×(1 + r)T Where C0 is cash flow at date 0, r is the appropriate interest rate, and T is the number of periods over which the cash is invested. * 4-* Future ValueSuppose a stock currently pays a dividend of $1.10, which is expected to grow at 40% per year for the next five years.What will the dividend be in five years? FV = C0×(1 + r)T $5.92 = $1.10×(1.40)5 *
- 77. 4-* Future Value and CompoundingNotice that the dividend in year five, $5.92, is considerably higher than the sum of the original dividend plus five increases of 40-percent on the original $1.10 dividend: $5.92 > $1.10 + 5×[$1.10×.40] = $3.30 This is due to compounding. * 4-* Future Value and Compounding 0 1 2 3 4 5
- 78. * 4-* Present Value and DiscountingHow much would an investor have to set aside today in order to have $20,000 five years from now if the current rate is 15%? $20,000 PV 0 1 2 3 4 5 *
- 79. 4-* 4.5 Finding the Number of Periods If we deposit $5,000 today in an account paying 10%, how long does it take to grow to $10,000? * It may be good at this point to discuss the difficulty of calculating time periods and interest rates, particularly without the help of a financial calculator. Rule of 72 says that 72/r gives an estimate of the number of periods it will take something (e.g., an investment) to double. 4-* Assume the total cost of a college education will be $50,000 when your child enters college in 12 years. You have $5,000 to invest today. What rate of interest must you earn on your investment to cover the cost of your child’s education? What Rate Is Enough? About 21.15%. *
- 80. 4-* Calculator KeysTexas Instruments BA-II PlusFV = future valuePV = present valueI/Y = periodic interest rateP/Y must equal 1 for the I/Y to be the periodic rateInterest is entered as a percent, not a decimalN = number of periodsRemember to clear the registers (CLR TVM) after each problemOther calculators are similar in format * We are providing information on the Texas Instruments BA-II Plus – other calculators are similar. We choose this calculator since it is one that is allowable for use in taking the CFA exam and TI provides a simulator software that can be used in class. If you recommend or require a specific calculator other than this one, you may want to make the appropriate changes. Note: the more information students have to remember to enter, the more likely they are to make a mistake. For this reason, I normally tell my students to set P/Y = 1 and leave it that way. Then I teach them to work on a period basis, which is consistent with using the formulas. If you want them to use the P/Y function, remind them that they will need to set it every time they work a new problem and that CLR TVM does not affect P/Y. If students are having difficulty getting the correct answer, make sure they have done the following:Set decimal places to floating point (2nd Format, Dec = 9 enter) or show 4 to 5
- 81. decimal places if using and HPDouble check and make sure P/Y = 1Make sure to clear the TVM registers after finishing a problem (or before starting a problem). It is important to point out that CLR TVM clears the FV, PV, N, I/Y and PMT registers. C/CE and CLR Work DO NOT affect the TVM keys. 4-* Multiple Cash Flows Consider an investment that pays $200 one year from now, with cash flows increasing by $200 per year through year 4. If the interest rate is 12%, what is the present value of this stream of cash flows?If the issuer offers this investment for $1,500, should you purchase it? * 4-* Multiple Cash Flows Present Value < Cost → Do Not Purchase 0 1 2 3 4 200
- 82. 400 600 800 178.57 318.88 427.07 508.41 1,432.93 * 4-* Valuing “Lumpy” Cash Flows First, set your calculator to 1 payment per year. Then, use the cash flow menu: CF2 CF1 F2 F1 CF0 1 200 1
- 83. 1,432.93 0 400 I NPV 12 CF4 CF3 F4 F3 1 600 1 800 * 4-* 4.3 Compounding Periods Compounding an investment m times a year for T years provides for future value of wealth: * 4-* Compounding Periods For example, if you invest $50 for 3 years at 12% compounded
- 84. semi-annually, your investment will grow to: * 4-* Effective Annual Rates of Interest A reasonable question to ask in the above example is “what is the effective annual rate of interest on that investment?” The Effective Annual Rate (EAR) of interest is the annual rate that would give us the same end-of-investment wealth after 3 years: * 4-* Effective Annual Rates of Interest So, investing at 12.36% compounded annually is the same as investing at 12% compounded semi-annually. *
- 85. 4-* Effective Annual Rates of InterestFind the Effective Annual Rate (EAR) of an 18% APR loan that is compounded monthly.What we have is a loan with a monthly interest rate rate of 1½%.This is equivalent to a loan with an annual interest rate of 19.56%. * 4-* EAR on a Financial Calculator Texas Instruments BAII Plus keys: description: [2nd] [ICONV] Opens interest rate conversion menu [↓] [EFF=] [CPT] 19.56 [↓][NOM=] 18 [ENTER] Sets 18 APR. [↑] [C/Y=] 12 [ENTER] Sets 12 payments per year *
- 86. 4-* Continuous CompoundingThe general formula for the future value of an investment compounded continuously over many periods can be written as: FV = C0×erT Where C0 is cash flow at date 0, r is the stated annual interest rate, T is the number of years, and e is a transcendental number approximately equal to 2.718. ex is a key on your calculator. * e is a transcendental number because it transcends the real numbers. 4-* 4.4 SimplificationsPerpetuityA constant stream of cash flows that lasts foreverGrowing perpetuityA stream of cash flows that grows at a constant rate foreverAnnuityA stream of constant cash flows that lasts for a fixed number of periodsGrowing annuityA stream of cash flows that grows at a constant rate for a fixed number of periods *
- 87. 4-* Perpetuity A constant stream of cash flows that lasts forever … 0 1 C 2 C 3 C * 4-* Perpetuity: Example What is the value of a British consol that promises to pay £15 every year for ever? The interest rate is 10-percent. … 0 1 £15
- 88. 2 £15 3 £15 * 4-* Growing Perpetuity A growing stream of cash flows that lasts forever … 0 1 C 2 C×(1+g) 3 C ×(1+g)2 *
- 89. 4-* Growing Perpetuity: Example The expected dividend next year is $1.30, and dividends are expected to grow at 5% forever. If the discount rate is 10%, what is the value of this promised dividend stream? … 0 1 $1.30 2 $1.30×(1.05) 3 $1.30 ×(1.05)2 * It is important to note to students that in this example the year 1 cash flow was given. If the current dividend were $1.30, then we would need to multiply it by one plus the growth rate to estimate the year 1 cash flow. 4-* Annuity A constant stream of cash flows with a fixed maturity 0
- 90. 1 C 2 C 3 C T C * 4-* Annuity: Example If you can afford a $400 monthly car payment, how much car can you afford if interest rates are 7% on 36-month loans? 0 1 $400 2 $400 3
- 91. $400 36 $400 * 4-* What is the present value of a four-year annuity of $100 per year that makes its first payment two years from today if the discount rate is 9%? 0 1 2 3 4 5 $100 $100 $100 $100 $323.97 $297.22 4-* * Ordinary Annuity vs. Annuity Due: It should be emphasized that annuity factor tables (and the annuity factors in the formulas) assumes that the first payment occurs one period from the present, with the final payment at the end of the annuity’s life. If the first payment occurs at the beginning of the period, then
- 92. FV’s have one additional period for compounding and PV’s have one less period to be discounted. Consequently, you can multiply both the future value and the present value by (1 + r) to account for the change in timing. The values can also be computed directly by changing the setting in the financial calculator. 4-* Growing Annuity A growing stream of cash flows with a fixed maturity 0 1 C 2 C×(1+g) 3 C ×(1+g)2 T C×(1+g)T-1 *
- 93. 4-* Growing Annuity: Example A defined-benefit retirement plan offers to pay $20,000 per year for 40 years and increase the annual payment by 3% each year. What is the present value at retirement if the discount rate is 10%? 0 1 $20,000 2 $20,000×(1.03) 40 $20,000×(1.03)39 * 4-* Growing Annuity: Example You are evaluating an income generating property. Net rent is received at the end of each year. The first year's rent is expected to be $8,500, and rent is expected to increase 7% each year. What is the present value of the estimated income stream
- 94. over the first 5 years if the discount rate is 12%? $34,706.26 0 1 2 3 4 5 * 4-* 4.5 Loan AmortizationPure Discount Loans are the simplest form of loan. The borrower receives money today and repays a single lump sum (principal and interest) at a future time.Interest-Only Loans require an interest payment each period, with full principal due at maturity.Amortized Loans require repayment of principal over time, in addition to required interest.
- 95. * 4-* Pure Discount LoansTreasury bills are excellent examples of pure discount loans. The principal amount is repaid at some future date, without any periodic interest payments.If a T-bill promises to repay $10,000 in 12 months and the market interest rate is 7 percent, how much will the bill sell for in the market?PV = 10,000 / 1.07 = 9,345.79 * Remind students that the value of an investment is the present value of expected future cash flows. 1 N; 10,000 FV; 7 I/Y; CPT PV = -9,345.79 4-* Interest-Only LoanConsider a 5-year, interest-only loan with a 7% interest rate. The principal amount is $10,000. Interest is paid annually.What would the stream of cash flows be?Years 1 – 4: Interest payments of .07(10,000) = 700Year 5: Interest + principal = 10,700This cash flow stream is similar to the cash flows on corporate bonds, and we will talk about them in greater detail later. *
- 96. 4-* Amortized Loan with Fixed Principal PaymentConsider a $50,000, 10 year loan at 8% interest. The loan agreement requires the firm to pay $5,000 in principal each year plus interest for that year.Click on the Excel icon to see the amortization table * Sheet1YearBeginning BalanceInterest PaymentPrincipal PaymentTotal PaymentEnding Balance150,0004,0005,0009,00045,000245,0003,6005,0008,600 40,000340,0003,2005,0008,20035,000435,0002,8005,0007,8003 0,000530,0002,4005,0007,40025,000625,0002,0005,0007,00020 ,000720,0001,6005,0006,60015,000815,0001,2005,0006,20010, 000910,0008005,0005,8005,000105,0004005,0005,4000 4-* Amortized Loan with Fixed PaymentEach payment covers the interest expense plus reduces principalConsider a 4 year loan with annual payments. The interest rate is 8% ,and the principal amount is $5,000.What is the annual payment?4 N8 I/Y5,000 PVCPT PMT = -1,509.60Click on the Excel icon to see the amortization table * Sheet1YearBeginning BalanceTotal PaymentInterest
- 97. PaidPrincipal PaidEnding Balance15,000.001,509.60400.001,109.603,890.4023,890.401,5 09.60311.231,198.372,692.0332,692.031,509.60215.361,294.24 1,397.7941,397.791,509.60111.821,397.780.01Totals6,038.401, 038.414,999.99Note: The ending balance of .01 is due to rounding. The last payment would actually be 1,509.61. 4-* 4.6 What Is a Firm Worth?Conceptually, a firm should be worth the present value of the firm’s cash flows.The tricky part is determining the size, timing, and risk of those cash flows. * 4-* Quick QuizHow is the future value of a single cash flow computed?How is the present value of a series of cash flows computed.What is the Net Present Value of an investment?What is an EAR, and how is it computed?What is a perpetuity? An annuity? * 05.1 000,10$ r C PV
- 108. 500,8$ 2 )07.1(500,8$ 095,9$ 65.731,9$ 3 )07.1(500,8$ 87.412,10$ 4 )07.1(500,8$ 77.141,11$ McGraw-Hill/Irwin Copyright © 2013 by The McGraw-Hill Companies, Inc. All rights reserved.
- 109. Financial Statements Analysis and Financial Models Chapter 3 * 3-* Key Concepts and SkillsKnow how to standardize financial statements for comparison purposesKnow how to compute and interpret important financial ratiosBe able to develop a financial plan using the percentage of sales approachUnderstand how capital structure and dividend policies affect a firm’s ability to grow * 3-* Chapter Outline 3.1 Financial Statements Analysis 3.2 Ratio Analysis 3.3 The DuPont Identity 3.4 Financial Models 3.5 External Financing and Growth 3.6 Some Caveats Regarding Financial Planning Models *
- 110. 3-* 3.1 Financial Statements AnalysisCommon-Size Balance SheetsCompute all accounts as a percent of total assetsCommon-Size Income StatementsCompute all line items as a percent of salesStandardized statements make it easier to compare financial information, particularly as the company grows.They are also useful for comparing companies of different sizes, particularly within the same industry. * 3-* 3.2 Ratio AnalysisRatios also allow for better comparison through time or between companies.As we look at each ratio, ask yourself:How is the ratio computed?What is the ratio trying to measure and why?What is the unit of measurement?What does the value indicate?How can we improve the company’s ratio? * 3-* Categories of Financial RatiosShort-term solvency or liquidity ratiosLong-term solvency or financial leverage ratiosAsset management or turnover ratiosProfitability ratiosMarket value ratios
- 111. * The ratios in the following slides will be computed using the 2012 information from the Balance Sheet (Table 3.1) and Income Statement (Table 3.4) given in the text. 3-* Computing Liquidity RatiosCurrent Ratio = CA / CL708 / 540 = 1.31 timesQuick Ratio = (CA – Inventory) / CL(708 - 422) / 540 = .53 timesCash Ratio = Cash / CL98 / 540 = .18 times * The firm is able to cover current liabilities with it’s current assets by a factor of 1.3 to 1. The ratio should be compared to the industry – it’s possible that this industry has a substantial amount of cash flow and that they can meet their current liabilities out of cash flow instead of relying solely on the liquidation of current assets that are on the books. The quick ratio is quite a bit lower than the current ratio, so inventory seems to be an important component of current assets. This company carries a low cash balance. This may be an indication that they are aggressively investing in assets that will provide higher returns. We need to make sure that we have enough cash to meet our obligations, but too much cash reduces the return earned by the company. 3-* Computing Leverage RatiosTotal Debt Ratio = (TA – TE) /
- 112. TA(3588 - 2591) / 3588 = 28%Debt/Equity = TD / TE(3588 – 2591) / 2591 = 38.5%Equity Multiplier = TA / TE = 1 + D/E1 + .385 = 1.385 * Note that these are often called solvency ratios. TE = total equity, and TA = total assets. The numerator in the total debt ratio could also be found by adding all of the current and long-term liabilities. The firm finances approximately 28% of its assets with debt. Another way to compute the D/E ratio if you already have the total debt ratio: D/E = Total debt ratio / (1 – total debt ratio) = .28 / .72 = .39 Note the rounding error as compared to the direct method applied in the slide. The EM is one of the ratios that is used in the Du Pont Identity as a measure of the firm’s financial leverage. 3-* Computing Coverage RatiosTimes Interest Earned = EBIT / Interest691 / 141 = 4.9 timesCash Coverage = (EBIT + Depreciation + Amortization) / Interest(691 + 276) / 141 = 6.9 times * Remember that depreciation (and amortization) is a non-cash deduction. A better indication of a firm’s ability to meet interest payments may be to add back the depreciation and
- 113. amortization to get an estimate of cash flow before taxes. You can also calculate a type of inverse value as follows: Interest Bearing Debt / EBITDA = (196 + 457) / 967 = .68 Values less than one are indicative of a stable position. 3-* Computing Inventory RatiosInventory Turnover = Cost of Goods Sold / Inventory1344 / 422 = 3.2 timesDays’ Sales in Inventory = 365 / Inventory Turnover365 / 3.2 = 114 days * Inventory turnover can be computed using either ending inventory or average inventory when you have both beginning and ending figures. It is important to be consistent with whatever benchmark you are using to analyze the company’s strengths or weaknesses. It is also important to consider seasonality in sales. If the balance sheet is prepared at a time when there is a large inventory build-up to meet seasonal demand, then the inventory turnover will be understated and you might believe that the company is not performing as well as it is. On the other hand, if the balance sheet is prepared when inventory has been drawn down due to seasonal sales, then the inventory turnover would be overstated and the company may appear to be doing better than it really is. Averages using annual data may not fix this problem. If a company has seasonal sales, you may want to look at quarterly averages to get a better indication of turnover. 3-*
- 114. Computing Receivables RatiosReceivables Turnover = Sales / Accounts Receivable2311 / 188 = 12.3 timesDays’ Sales in Receivables = 365 / Receivables Turnover365 / 12.3 = 30 days * Technically, the sales figure should be credit sales. This is often difficult to determine from the income statements provided in annual reports. If you use total sales instead of credit sales, you will overstate your turnover level. You need to recognize this bias when credit sales are unavailable, particularly if a large portion of the sales are cash sales. As with inventory turnover, you can use either ending receivables or an average of beginning and ending. You also run into the same seasonal issues as discussed with inventory. Probably the best benchmark for days’ sales in receivables is the company’s credit terms. If the company offers a discount (1/10 net 30), then you would like to see days’ sales in receivables less than 30. If the company does not offer a discount (net 30), then you would like to see days’ sales in receivables close to the net terms. If days’ sales in receivables is substantially larger than the net terms, then you first need to look for biases, such as seasonality in sales. If this does not provide an explanation for the difference, then the company may need to take another look at its credit policy (who it grants credit to and its collection procedures). 3-* Computing Total Asset TurnoverTotal Asset Turnover = Sales / Total Assets2311 / 3588 = .64 timesIt is not unusual for TAT <
- 115. 1, especially if a firm has a large amount of fixed assets. * Having a TAT of less than one is not a problem for most firms. Fixed assets are expensive and are meant to provide sales over a long period of time. This is why the matching principle indicates that they should be depreciated instead of immediately expensed. This is one of the ratios that will be used in the Du Pont identity. 3-* Computing Profitability MeasuresProfit Margin = Net Income / Sales363 / 2311 = 15.7%Return on Assets (ROA) = Net Income / Total Assets363 / 3588 = 10.1%Return on Equity (ROE) = Net Income / Total Equity363 / 2591 = 14.0%EBITDA Margin = EBITDA / Sales967 / 2311 = 41.8% * You can also compute the gross profit margin and the operating profit margin. GPM = (Sales – COGS) / Sales OPM = EBIT / Sales Profit margin is one of the components of the Du Pont identity and is a measure of operating efficiency. It measures how well the firm controls the costs required to generate the revenues. It tells how much the firm earns for every dollar in sales. In the example, the firm earns almost $0.16 for each dollar in sales. Note that the ROA and ROE are returns on accounting numbers.
- 116. As such, they are not directly comparable with returns found in the marketplace. ROA is sometimes referred to as ROI (return on investment). As with many of the ratios, there are variations in how they can be computed. The most important thing is to make sure that you are computing them the same way as the benchmark you are using. ROE will always be higher than ROA as long as the firm has debt (and ROA is positive). The greater the leverage, the larger the difference will be. ROE is often used as a measure of how well management is attaining the goal of owner wealth maximization. The Du Pont identity is used to identify factors that affect the ROE. 3-* Computing Market Value MeasuresMarket Capitalization = $88 per share x 33 million shares = 2904 millionPE Ratio = Price per share / Earnings per share88 / 11 = 8 timesMarket-to-book ratio = market value per share / book value per share88 / (2591 / 33) = 1.12 timesEnterprise Value (EV) = Market capitalization + Market value of interest bearing debt – cash2904 + (196 + 457) – 98 = 3465EV Multiple = EV / EBITDA3465 / 967 = 3.6 times * See Table 3.6, as well as the instructor’s manual (chapter 3 appendix), for a summary list of financial ratios. 3-* Using Financial StatementsRatios are not very helpful by themselves: they need to be compared to somethingTime-Trend
- 117. AnalysisUsed to see how the firm’s performance is changing through timePeer Group AnalysisCompare to similar companies or within industriesSIC and NAICS codes * SIC codes have been used many years to identify industries and allow for comparison with industry average ratios. The SIC codes are limited, however, and have not kept pace with a rapidly changing environment. Consequently, the North American Industry Classification System was introduced in 1997 to alleviate some of the problems with SIC codes. Click on the web surfer to go the NAICS home page. It provides information on the change to the NAICS and conversion between SIC and NAICS codes. 3-* 3.3 The DuPont IdentityROE = NI / TEMultiply by 1 and then rearrange:ROE = (NI / TE) (TA / TA)ROE = (NI / TA) (TA / TE) = ROA * EMMultiply by 1 again and then rearrange:ROE = (NI / TA) (TA / TE) (Sales / Sales)ROE = (NI / Sales) (Sales / TA) (TA / TE)ROE = PM * TAT * EM * 3-* Using the DuPont IdentityROE = PM * TAT * EMProfit margin is a measure of the firm’s operating efficiency – how well it controls costs.Total asset turnover is a measure of the firm’s
- 118. asset use efficiency – how well it manages its assets.Equity multiplier is a measure of the firm’s financial leverage. * Improving our operating efficiency or our asset use efficiency will improve our return on equity. If the TAT is low compared to our benchmark, then we can break it down into more detail by looking at inventory turnover and receivables turnover. If those areas are strong, then we can look at fixed asset turnover and cash management. We can also improve our ROE by increasing our leverage – up to a point. Debt affects a lot of other factors, including profit margin, so we have to be a little careful here. We want to make sure we have enough debt to utilize our interest tax credit effectively, but we don’t want to overdo it. 3-* Calculating the DuPont IdentityROA = 10.1% and EM = 1.39ROE = 10.1% * 1.385 = 14.0%PM = 15.7% and TAT = 0.64ROE = 15.7% * 0.64 * 1.385 = 14.0% * 3-* Potential ProblemsThere is no underlying theory, so there is no way to know which ratios are most relevant.Benchmarking is difficult for diversified firms.Globalization and international competition makes comparison more difficult because of
- 119. differences in accounting regulations.Firms use varying accounting procedures.Firms have different fiscal years.Extraordinary, or one-time, events * 3-* 3.4 Financial ModelsInvestment in new assets – determined by capital budgeting decisionsDegree of financial leverage – determined by capital structure decisionsCash paid to shareholders – determined by dividend policy decisionsLiquidity requirements – determined by net working capital decisions * 3-* Financial Planning IngredientsSales Forecast – many cash flows depend directly on the level of sales (often estimate sales growth rate)Pro Forma Statements – setting up the plan as projected (pro forma) financial statements allows for consistency and ease of interpretationAsset Requirements – the additional assets that will be required to meet sales projectionsFinancial Requirements – the amount of financing needed to pay for the required assetsPlug Variable – determined by management decisions about what type of financing will be used (makes the balance sheet balance)Economic Assumptions – explicit assumptions about the coming economic environment
- 120. * 3-* Percent of Sales ApproachSome items vary directly with sales, others do not.Income StatementCosts may vary directly with sales - if this is the case, then the profit margin is constantDepreciation and interest expense may not vary directly with sales – if this is the case, then the profit margin is not constantDividends are a management decision and generally do not vary directly with sales – this affects additions to retained earnings * 3-* Percent of Sales ApproachBalance SheetInitially assume all assets, including fixed, vary directly with sales.Accounts payable also normally vary directly with sales.Notes payable, long-term debt, and equity generally do not vary with sales because they depend on management decisions about capital structure.The change in the retained earnings portion of equity will come from the dividend decision.External Financing Needed (EFN)The difference between the forecasted increase in assets and the forecasted increase in liabilities and equity. *
- 121. 3-* Percent of Sales and EFNExternal Financing Needed (EFN) can also be calculated as: * The first term measures the increase in assets, which is based on the capital intensity ratio. The second and third terms capture the increase in liabilities and equity, respectively. 3-* 3.5 External Financing and GrowthAt low growth levels, internal financing (retained earnings) may exceed the required investment in assets.As the growth rate increases, the internal financing will not be enough, and the firm will have to go to the capital markets for financing.Examining the relationship between growth and external financing required is a useful tool in financial planning. * 3-* The Internal Growth RateThe internal growth rate tells us how much the firm can grow assets using retained earnings as the only source of financing.Using the information from the
- 122. Hoffman Co.ROA = 66 / 500 = .132b = 44/ 66 = .667 * The information for these calculations is given in Table 3.13. This firm could grow assets at 9.65% without raising additional external capital. Relying solely on internally generated funds will increase equity (retained earnings are part of equity) and assets without an increase in debt. Consequently, the firm’s leverage will decrease over time. If there is an optimal amount of leverage, as we will discuss in later chapters, then the firm may want to borrow to maintain that optimal level of leverage. This idea leads us to the sustainable growth rate. 3-* The Sustainable Growth RateThe sustainable growth rate tells us how much the firm can grow by using internally generated funds and issuing debt to maintain a constant debt ratio.Using the Hoffman Co.ROE = 66 / 250 = .264b = .667 * Note that no new equity is issued. The sustainable growth rate is substantially higher than the internal growth rate. This is because we are allowing the company to issue debt as well as use internal funds. Commonly, sustainable growth is calculated as only the numerator of our formula (ROE * b), but this assumes we calculate ROE based on beginning, rather than ending, equity.
- 123. 3-* Determinants of GrowthProfit margin – operating efficiencyTotal asset turnover – asset use efficiencyFinancial leverage – choice of optimal debt ratioDividend policy – choice of how much to pay to shareholders versus reinvesting in the firm * The first three components come from the ROE and the Du Pont identity. It is important to note at this point that growth is not the goal of a firm in and of itself. Growth is only important so long as it continues to maximize shareholder value. 3-* 3.6 Some CaveatsFinancial planning models do not indicate which financial polices are the best.Models are simplifications of reality, and the world can change in unexpected ways.Without some sort of plan, the firm may find itself adrift in a sea of change without a rudder for guidance. * 3-*
- 124. Quick QuizHow do you standardize balance sheets and income statements?Why is standardization useful?What are the major categories of financial ratios?How do you compute the ratios within each category?What are some of the problems associated with financial statement analysis? * 3-* Quick QuizWhat is the purpose of financial planning?What are the major decision areas involved in developing a plan?What is the percentage of sales approach?What is the internal growth rate?What is the sustainable growth rate?What are the major determinants of growth? * 565$ )667.0125013.0()2503.0()2503( )1(Sales) Projected(ΔSales Sales LiabSpon Sales Sales Assets
- 125. dPM %65.9 0965. 667.132.1 667.132. bROA - 1 bROA RateGrowth Internal %4.21 214. 667.264.1 667.264. bROE-1 bROE RateGrowth eSustainabl
- 126. McGraw-Hill/Irwin Copyright © 2013 by The McGraw-Hill Companies, Inc. All rights reserved. Introduction to Corporate Finance Chapter 1 * 1-* Key Concepts and Skills Know the basic types of financial management decisions and the role of the Financial Manager Know the financial implications of the various forms of business organization Know the goal of financial management Understand the conflicts of interest that can arise between owners and managers Understand the various regulations that firms face * 1-* Chapter Outline 1.1 What is Corporate Finance? 1.2 The Corporate Firm
- 127. 1.3 The Importance of Cash Flows 1.4 The Goal of Financial Management 1.5 The Agency Problem and Control of the Corporation 1.6 Regulation * 1-* 1.1 What Is Corporate Finance? Corporate Finance addresses the following three questions: What long-term investments should the firm choose? How should the firm raise funds for the selected investments? How should short-term assets be managed and financed? *Capital budgetingCapital structureWorking capital 1-* Balance Sheet Model of the Firm Current Assets Fixed Assets 1 Tangible 2 Intangible Total Value of Assets: Shareholders’ Equity Current Liabilities Long-Term Debt Total Firm Value to Investors:
- 128. * It is sometimes helpful to relate corporate decisions to individual circumstances. For example, consider discussing how individuals choose to buy cars or homes and how this decision would affect a personal balance sheet. 1-* The Capital Budgeting Decision Current Assets Fixed Assets 1 Tangible 2 Intangible Shareholders’ Equity Current Liabilities Long-Term Debt What long-term investments should the firm choose? * 1-* The Capital Structure Decision How should the firm raise funds for the selected investments? Current Assets
- 129. Fixed Assets 1 Tangible 2 Intangible Shareholders’ Equity Current Liabilities Long-Term Debt * 1-* Short-Term Asset Management How should short-term assets be managed and financed? Net Working Capital Shareholders’ Equity Current Liabilities Long-Term Debt Current Assets Fixed Assets 1 Tangible 2 Intangible * 1-*
- 130. The Financial Manager The Financial Manager’s primary goal is to increase the value of the firm by: Selecting value creating projects Making smart financing decisions * Note, these actions explicitly relate to the three questions addressed in slide 3. 1-* Hypothetical Organization Chart Chairman of the Board and
- 131. Chief Executive Officer (CEO) President and Chief Operating Officer (COO) Vice President and Chief Financial Officer (CFO) Treasurer Controller Cash Manager Capital Expenditures Credit Manager Financial Planning Tax Manager Financial Accounting Cost Accounting Data Processing Board of Directors *
- 132. 1-* 1.2 The Corporate FirmThe corporate form of business is the standard method for solving the problems encountered in raising large amounts of cash.However, businesses can take other forms. * 1-* Forms of Business OrganizationThe Sole ProprietorshipThe PartnershipGeneral PartnershipLimited PartnershipThe Corporation * It may be beneficial to discuss S-Corporations and LLCs in the context of this slide. 1-* A Comparison Corporation Partnership
- 133. Liquidity Shares can be easily exchanged Subject to substantial restrictions Voting Rights Usually each share gets one vote General Partner is in charge; limited partners may have some voting rights Taxation Double Partners pay taxes on distributions Reinvestment and dividend payout Broad latitude
- 134. All net cash flow is distributed to partners Liability Limited liability General partners may have unlimited liability; limited partners enjoy limited liability Continuity Perpetual life Limited life * 1-* Cash flow from firm (C) 1.3 The Importance of Cash Flow
- 135. Taxes (D) Retained cash flows (F) Invests in assets (B) Dividends and debt payments (E) Current assets Fixed assets Short-term debt Long-term debt Equity shares Ultimately, the firm must be a cash generating activity. The cash flows from the firm must exceed the cash flows from the financial markets. Firm issues securities (A) Government Firm Financial markets * It is important to remind students that net income is NOT cash flow.
- 136. 1-* 1.4 The Goal of Financial ManagementWhat is the correct goal?Maximize profit?Minimize costs?Maximize market share?Maximize shareholder wealth? * 1-* 1.5 The Agency ProblemAgency relationshipPrincipal hires an agent to represent his/her interestStockholders (principals) hire managers (agents) to run the companyAgency problemConflict of interest between principal and agent * A common example of an agency relationship is a real estate broker – in particular if you break it down between a buyers agent and a sellers agent. A classic conflict of interest is when the agent is paid on commission, so they may be less willing to let the buyer know that a lower price might be accepted or they may elect to only show the buyer homes that are listed at the high end of the buyer’s price range. Direct agency costs – the purchase of something for management that can’t be justified from a risk-return standpoint, monitoring costs. Indirect agency costs – management’s tendency to forgo risky or expensive projects that could be justified from a risk-return standpoint.
- 137. 1-* Managerial GoalsManagerial goals may be different from shareholder goalsExpensive perquisitesSurvivalIndependenceIncreased growth and size are not necessarily equivalent to increased shareholder wealth * 1-* Managing ManagersManagerial compensationIncentives can be used to align management and stockholder interestsThe incentives need to be structured carefully to make sure that they achieve their intended goalCorporate controlThe threat of a takeover may result in better managementOther stakeholders * Incentives – discuss how incentives must be carefully structured. For example, tying bonuses to profits might encourage management to pursue short-run profits and forego projects that require a large initial outlay. Stock options may work, but there may be an optimal level of insider ownership. Beyond that level, management may be in too much control and may not act in the best interest of all stockholders. The type of stock can also affect the effectiveness of the incentive. Corporate control – ask the students why the threat of a takeover might make managers work towards the goals of stockholders.
- 138. Other groups also have a financial stake in the firm. They can provide a valuable monitoring tool, but they can also try to force the firm to do things that are not in the owners’ best interest. 1-* 1.6 RegulationThe Securities Act of 1933 and the Securities Exchange Act of 1934 Issuance of Securities (1933)Creation of SEC and reporting requirements (1934)Sarbanes-Oxley (“Sarbox”)Increased reporting requirements and responsibility of corporate directors * 1-* Quick QuizWhat are the three basic questions Financial Managers must answer?What are the three major forms of business organization?What is the goal of financial management?What are agency problems, and why do they exist within a corporation?What major regulations impact public firms? * James Bucky Carter
- 139. A s a graphic novel specialist and teacher educator, I travel across the United States sharing informa- tion on how teachers can use this media in their classrooms to expand student literacy skills. The questions, comments, and occasional resistance I’ve encountered have led me to conclude that some misinfor- mation concerning the pedagogical potential of graphic novels is circulating among teachers. Some believe that graphic novels are too risky to bring into the curriculum, others resist any form of new literacy altogether, and many think that sequential art narratives are only useful for remedial or reluctant readers. To clear up these misconceptions, I’d like to share a few facts about the form and a few practical suggestions for teachers considering integrating graphic novels into their classes. As Old as Cave Paintings Sequential art narratives— broadly defined as images placed in sequence to tell a story—have been steadily gaining attention over the last couple of decades as teachers, literacy experts, and librarians have sought new means to engage reluctant readers and inspire more motivated ones. Practitioners and researchers have found these texts, usually published as graphic novels or comic books, to be of great use in increasing library circula-
- 140. tion, creating new readers, helping English language learners, motivating male readers, and even assisting gifted and talented students. In many ways, it seems that the graphic novel as accepted pedagogical text has “arrived.” Actually, comics are not a new phenomenon, nor are the attempts to connect them to education. Some would argue that sequential art narratives date back to the earliest cave paintings. Comic books, which grew out of the news- paper comic strips that gained popularity in the 1880s and 1890s, have existed in the United States since the 1920s. Superhero comics debuted in 1938 with Action Comics #1, the first appearance of Superman. Not even the recently popular Japanese import comics, Manga, are 21st- century inventions. There is a long history of the form being used for teaching, including hiero- 68 E D U C AT I O N A L L E A D E R S H I P /M A R C H 2009 Going Understanding what graphic novels are— and aren’t—can help teachers make the best use of this literary form.
- 141. © S U S IE F IT Z H U G H Special Topic glyphics, tapestries, and stained glass windows (McCloud, 1999). M. Thomas Inge’s Comics as Culture (1990), Bradford Wright’s Comic Book Nation (2001), and Steven Krashen’s The Power of Reading (2004) all cite studies from education and sociological journals that date back at least to the late 1930s. The term graphic novel has been in use in the United States since around 1964 and gained widespread recognition in 1978 when Will Eisner prominently placed the term on the cover of the paperback edition of A Contract with God and Other Tenement Stories. Although teachers have paid more attention to sequential art narration of late, comics and graphic novels are better considered as “new to
- 142. you” rather than literally new. An Art Form, Not a Genre Another misconception is that graphic novels and comics are a genre of litera- ture (Carter, 2008). Westerns, romances, science fiction, and fantasy are genres. All-American Western, All True Romance, Star Trek, and Sandman are comics that feature each of these genres, respectively. This distinction is important because teachers may be more willing to use sequential art narra- tives to supplement existing curricu- lums by looking for genre connections rather than teaching comics in isolation. In fact, I believe that integrating comics into existing thematic units can be more effective than studying the form in isolation. Studying how a graphic novelist frames a story benefits students’ devel- oping sense of craft and composition. Comparing how Art Spiegelman uses words and art to tell about his family’s experiences during the Holocaust in Maus to the conventions that Elie Wiesel or Lois Lowry or Anne Frank (or all of them) use when writing about the same topic is even better. Teachers should weigh their decision to teach comics through study units focusing solely on the form with the possibly more expan- sive and connection-building method of
- 143. using this material to supplement existing curriculums. Not Just for Reluctant Readers Much recent attention to graphic novels results from the admirable efforts of librarians who noticed drastic increases in circulation once graphic novels were added to their libraries. Articles from their professional literature often proclaim that young people who never saw themselves as readers suddenly devoured books once they were exposed to graphic novels. On the basis of these claims, educators began using graphic novels to engage low-level or reluctant readers. There is evidence that certain popula- tions (boys, for example) prefer visual texts over those without visual elements (Smith & Wilhelm, 2002) and that allowing students to read comics may engage students who are otherwise less interested or less proficient in English (Cary, 2004). Research has also shown that comic book readers have a tendency to read more varied texts and that comic book reading often acts as a gateway to both more reading and more A S S O C I AT I O N F O R S U P E RV I S I O N A N D C U R R I C U L U M D E V E L O P M E N T 69 © S
- 144. U S IE F IT Z H U G H varied reading (Krashen, 2004). Comics do have potential to motivate reluctant readers, but the study of sequential art can also benefit students who are already motivated readers. For example, Mitchell and George (1996) used superhero comics to examine morality and ethical issues with gifted students, and I have observed teachers using graphic novels as literature with honors-level seniors. I have used sequential art texts with students of various reading levels with an age range that extends from 6th grade to graduate school. Not Necessarily “Kid Stuff” Another assumption that may prevent teachers from sharing worthwhile comics with older and more motivated students or that may lead teachers to
- 145. make unwise decisions about appropri- ateness in the classroom is that comics are written for a young audience. The notion that comic books are for children is long-standing, and surely young people have always been drawn to them. But, countering these assumptions, exemplary graphic novels of the past 30 years have dealt with such mature topics as date rape, teen pregnancy, the Iraq war, Hurricane Katrina, genocide, and gang violence, as well as all of the major issues that adolescents face: coming of age, identity formation, friendship, and change. Even superhero comics have explored such weighty issues as drug addiction, mental illness, HIV infection, and land mine safety. Teachers can make mistakes easily when they assume that all comic book–style productions are for children. At a recent talk in Normal, Illinois, a teacher told me that a local 4th grade teacher was having her students read Persepolis, a wonderful coming-of-age story about a young woman dealing with the Iranian revolution of the 1970s and 1980s. Although there are parts of the novel where the narrator is at the equivalent age of a U.S. 4th grader, there are also explicit visual depictions