SlideShare a Scribd company logo
1 of 127
46053 C PHNJ B&E A B P N 360 C/M/Y/K DESIGN
SERVICES OF
360
M13_BOVE5352_09_SE_C12.QXD 5/18/07 2:46 PM Page
360
46053 C PHNJ B&E A B P N 361 C/M/Y/K DESIGN
SERVICES OF
CHAPTER 12
Designing Visual Communication
LEARNING OBJECTIVES
After studying this chapter, you will be able to
1 Describe the communication power of visuals
2 Discuss six principles of graphic design thatcan improve the
quality of your visuals
3 Explain how to avoid ethical lapses when usingvisuals
4 Explain how to choose which points in yourmessage to
illustrate
5 Describe the most common options forpresenting data in a
visual format
6 Identify five guidelines for using photographseffectively
7 List three criteria to review in order to verifythe quality of
your visuals
COMMUNICATION CLOSE-UP
AT STONE YAMASHITA
PARTNERS
www.stoneyamashita.com
Keith Yamashita doesn’t look or act like the stereo-
typical business consultant, but that hasn’t
stopped him from developing enthusiastic fans
among top executives at IBM, Mercedes-Benz, Nike, General
Electric, and other firms who have worked with his com-
pany, Stone Yamashita Partners (SYP).
Yamashita and designer Robert Stone started SYP in
1994, after working together at Apple Computer. Gradually,
they assembled a diverse team that includes designers,
writers, technologists, a poet, a sociologist, and a former
lawyer—but very few MBAs. This eclectic group specializes
in helping companies examine, revamp, and sometimes
reinvent their vision and mission, business strategy, image,
and company culture.
That kind of fundamental change affects everyone in a
company, from the most senior executive to the newest hire.
People tend to resist change, at least initially, but communi-
cation that is effective and compelling can help turn such re-
sistance into commitment.
Communication is SYP’s specialty, but Yamashita’s
team never relies on words alone. Instead, it uses strong vi-
sual elements to paint a picture—sometimes literally—of a
company’s new direction. Everything it produces is full of
compelling visual cues, whether it’s a short video, an inter-
active website, a pocket-size book, a giant story scroll, or a
full-size store mockup. Highly visual content and offbeat
Compelling visual messages are critical to the success of
consulting partners Keith Yamashita and Robert Stone.
M13_BOVE5352_09_SE_C12.QXD 5/18/07 2:46 PM Page
361
1 L E A R N I N G O B J E C T I V E
Describe the communication
power of visuals
362 PART 4 Supporting Messages with Quality Information
46053 C PHNJ B&E A B P N 362 C/M/Y/K DESIGN
SERVICES OF
UNDERSTANDING VISUAL COMMUNICATION
Project teams from Stone Yamashita Partners (profiled in the
chapter-opening “Communica-
tion Close-Up) look for new ways to connect and explore
business ideas through creative
visuals, often helping clients see important concepts and
relationships that weren’t obvious
using textual communication alone. Although the primary focus
of this course is written mes-
sages, visual communication has become an important skill for
today’s business profession-
als and managers. This chapter helps you appreciate the power
of images and the visual
evolution of business communication. It then explains how to
identify which points in your
messages to illustrate; how to select the best visual for each of
those points; and how to create
effective visuals in any media, from memos to reports to
webpages to electronic presentations.
The Power of Images
Well-designed visual elements can enhance the communication
power of textual messages
and, in some instances, even replace textual messages. Visuals
can often convey some mes-
sage points (such as spatial relationships, correlations,
procedures, and emotions) more ef-
fectively and more efficiently than words. Generally speaking,
in a given amount of time,
well-designed images can convey much more information than
text.2 In the numbers-
oriented world of work, people rely heavily on trend lines,
distribution curves, and visual
presentations of numerical quantities. Visuals attract and hold
people’s attention, helping
your audience understand and remember your message. Busy
readers often jump to visuals
to try to get the gist of a message, and attractive visuals can
draw readers deeper into your
reports and presentations. Pictures are also an effective way to
communicate with the di-
verse audiences that are common in today’s business
environment.
In addition to their direct information value, visuals often
convey connotative mean-
ing as well. As you read in Chapter 5, many words and phrases
carry connotative meanings,
which are all the mental images, emotions, and other
impressions that the word or phrase
evokes in audience members. A significant part of the power—
and risk—of visual elements
derives from their connotative meanings as well. Even
something as simple as a watermark
symbol embedded in letterhead stationery can boost reader
confidence in whatever mes-
sage is printed on the paper.3 Many colors, shapes, and other
design elements have visual
symbolism; and their symbolic, connotative meaning can evolve
over time and mean dif-
ferent things in different cultures (see Figure 12.1). Being
aware of these symbolic mean-
Like words, visuals often carry
connotative or symbolic meanings.
FIGURE 12.1 Visual Symbolism
A red cross (with equal-length arms) on a white background is
the well-known symbol of the Red
Cross relief organization. It is also used to indicate the medical
branches of many nations’ military
services. The red cross symbol is based on the flag of
Switzerland (where the first Red Cross
organization was formed), which over the course of hundreds of
years developed from battle flags
that originally used the Christian cross symbol. Although the
Red Cross emblem is not based
directly on the Christian symbol, the organization uses a red
crescent in countries where Islam is
the dominant religion and is known as the Red Crescent. To
avoid association with religious
symbols, the International Federation of Red Cross and Red
Crescent Societies (the global umbrella
organization for all national Red Cross and Red Crescent
organizations), recently adopted the Red
Crystal as its new symbol.
presentation can make a message more tangible and thus
more effective for employees, customers, and investors.
Both partners know that the right visuals can inspire peo-
ple to move from resistance to commitment to action. “Strat-
egy is not something that’s done in a box with only a rational
hat on,” says Stone. “It needs to be visceral, human, and of-
ten emotional.” Yamashita agrees, and adds, “We’re trying to
move people to a place where it makes sense to act.”1
M13_BOVE5352_09_SE_C12.QXD 5/18/07 2:46 PM Page
362
CHAPTER 12 Designing Visual Communication 363
46053 C PHNJ B&E A B P N 363 C/M/Y/K DESIGN
SERVICES OF
Thanks to advances in technology
and changing audience expectations,
business communication is becoming
more visual.
Visual literacy is the ability to both
create and interpret visuals.
ings and using them to your advantage are important aspects of
being an effective business
communicator.
Because they have so much power to communicate, visuals must
be carefully planned,
created, and integrated with text. An awkward sentence or
grammatical error deep within a
report might not be noticed by the majority of readers, but a
poorly chosen or clumsily im-
plemented visual will be noticed by most—and can confuse or
alienate audiences and dam-
age your credibility. You don’t need to be a professional
designer to use visuals effectively,
but you do need be aware of some basic design principles if you
want to avoid making high-
visibility mistakes. This chapter gives you enough background
to begin creating your own
business visuals, and with some practice you’ll be able to craft
effective visuals for nearly any
communication project you might encounter.
The Visual Evolution in Business Communication
Several technological and social factors are contributing to the
increasing use—and
importance—of visuals in business communication. The process
of creating and work-
ing with visual elements used to be the domain of experts with
complex and expensive
tools. However, digital technology has changed this situation
dramatically. Digital cam-
eras that can produce high-quality images and video are
inexpensive and easy enough
for anyone to use; the software needed to create diagrams,
process photos, edit video, and
prepare other visual elements continues to get both easier and
more powerful all the
time; the global reach of the Internet makes it easy to send
images almost instantly; and
more Internet users have high-speed connections that can handle
the larger computer
files that visuals tend to require. Design and production tasks
that used to take days can
now be completed in hours or even minutes. As technologies
such as wireless network-
ing continue to advance, business communicators will continue
to reach wider audiences
in less time, using equipment that costs less and requires fewer
skills.4
While technology has been putting visual design and production
into the hands of
everyday business communicators in recent years, audience
skills and expectations have
been evolving as well. Two changes in particular could affect
your communication efforts in
the coming years. First, U.S. government research indicates that
only half of the adult
population in the United States now have the literacy skills
considered necessary for
success in today’s workplace.5 In other words, depending on the
nature of your work,
you could find yourself communicating with audiences whose
skills could keep them
from successfully reading your documents. Visuals could play a
vital role in communi-
cating your messages to audiences with lower reading skills.
Second, as technology has
multiplied the ways in which communicators can create visuals
and as people grow up
and live in a more visual, media-saturated environment,
audiences may well expect
messages to be more visual.
As a result of these changes in both the tools and the
communication environment,
visual literacy, the ability (as a sender) to create effective
images and (as a receiver) to
correctly interpret visual messages, has become a key business
skill.6 Whether you need
to use images to reach an audience with limited reading skills or
want to use images to
magnify the impact of your written messages, knowing how to
help your audience see
what you see will help you become a more effective
communicator.
Visual Design Principles
Just as creating effective sentences, paragraphs, and documents
requires working knowl-
edge of the principles of good writing, creating effective visuals
requires some knowledge
of the principles of good design. Even though few
businesspeople have the opportunity
to formally study the “language”of line, mass, space, size,
color, pattern, and texture, any-
one can learn enough of the basic concepts to craft effective
basic visuals.
When you encounter visuals that you find appealing or
unappealing, or effective or
ineffective, stop and ask yourself why you responded the way
you did. Did a particular
design grab you and practically force you to pay attention, or
did you pass right by with
hardly a notice? Did one graph reveal its information quickly
and easily while another
Creating effective visuals and correctly
interpreting visuals that other people
create are important business skills.
M13_BOVE5352_09_SE_C12.QXD 5/18/07 2:46 PM Page
363
2 L E A R N I N G O B J E C T I V E
Discuss six principles of
graphic design that can
improve the quality of your
visuals
364 PART 4 Supporting Messages with Quality Information
46053 C PHNJ B&E A B P N 364 C/M/Y/K DESIGN
SERVICES OF
made you spend time decoding its confusing message? Did one
photo appeal to you at an
emotional level and therefore draw you into a document,
whereas another repulsed you for
some reason and caused you to lose interest in the document?
By thinking about your own
reactions to visual designs, you can become a more effective
designer yourself.
As you consider your reactions to various designs and create
designs of your own, you’ll
begin to see how six fundamental principles help distinguish
ineffective and effective de-
signs: consistency, contrast, balance, emphasis, convention, and
simplicity (see Figure 12.2):
● Consistency. Audiences view a series of visuals as a whole
and assume that design ele-
ments will be consistent from one page to the next. For
instance, if your first chart shows
data for Division A in blue and for Division B in green, the
audience will get confused if
you later switch to green for Division A and red for Division B.
Think of consistency as
visual parallelism, in the same way that textual parallelism
helps audiences understand
and compare a series of ideas.7 You can achieve visual
parallelism in a variety of ways,
through the consistent use of color, shape, size, texture,
position, scale, or typeface.
● Contrast. Readers expect visual distinctions to match verbal
ones. To emphasize differ-
ences, depict items in contrasting colors, such as red and blue,
or black and white. But to
emphasize similarities, make color differences more subtle. In a
pie chart, you might show
two similar items in two shades of blue and a dissimilar item in
yellow. Keep in mind that
accent colors draw attention to key elements, but they lose their
effect if you overdo them.
● Balance. The human eye tends to compare visual images with
physical structures, and
images that appear to be out of balance can be as unsettling as a
building that looks like
it’s about to tip over. Balance can be either formal, in which the
elements in the images
are arranged symmetrically around a central point or axis, or
informal, in which ele-
ments are not distributed evenly but stronger and weaker
elements are arranged in such
a way that achieves an overall effect of balance. A common
approach to informal bal-
ance is weighing one visually dominant element against several
smaller or weaker ele-
ments.8 Generally speaking, formal balance is more calming
and serious, whereas
informal balance tends to feel more dynamic and engaging
(which is why most adver-
tising uses this approach, for example).
● Emphasis. Audiences usually assume that the dominant
element in a design is the most
important, so make sure that the visually dominant element
really does represent the
most important information. You can do this through color,
position, size, or place-
ment, for instance. Conversely, be sure to visually downplay
less important items. For
instance, avoid using strong colors for minor support points,
and de-emphasize back-
ground features such as the grid lines on a chart.
● Convention. Visual communication is guided by a variety of
generally accepted rules
or conventions, just as written communication is guided by an
array of spelling, gram-
mar, punctuation, and usage conventions. These conventions
dictate virtually every as-
pect of design.9 Moreover, many conventions are so ingrained
that people don’t even
realize they are following conventions. For example, if English
is your native language,
you assume that ideas progress across the page from left to
right, because that’s the di-
rection in which English text is written. Whether it’s the
sequence of steps in a process
diagram or elapsed time along the bottom of a graph, you
automatically expect this left-
to-right flow. However, if you are a native Arabic or Hebrew
speaker, you might auto-
matically assume that flow on a page or screen is from right to
left, because that is the
direction in which these languages are written. Flouting
conventions often causes
breakdowns in communication, but in some cases, it can be done
to great effect.10 For
instance, flipping an organization chart upside down to put the
customers at the top,
with front-line employees directly beneath them and on down to
the chief executive at
the bottom, can be an effective way to emphasize that customers
come first and the re-
sponsibility of managers is supporting employees in their
efforts to satisfy customers.
● Simplicity. As a general rule, simpler is better when it comes
to visuals for business
communication. When you’re designing graphics for your
documents, remember
that you’re conveying information, not decorating an apartment
or creating artwork.
Limit the number of colors and design elements you use, and
take care to avoid
chartjunk, a term coined by visual communication specialist
Edward R. Tufte for dec-
Nearly every aspect of visual design
is governed by conventions that set
audience expectations.
M13_BOVE5352_09_SE_C12.QXD 5/18/07 2:46 PM Page
364
CHAPTER 12 Designing Visual Communication 365
46053 C PHNJ B&E A B P N 365 C/M/Y/K DESIGN
SERVICES OF
Inappropriate emphasis
draws the eye to the
red rectangle, which is
not central to the
message
Inconsistent bullets
force audience to
interpret symbols to
see if they contain
some additional
message
Cluttered design forces
audience to hunt for
the message
Headline is clearly
emphasized
Conventional
left-to-right,
top-to-bottom
arrangement makes it
easy to find the
message
Unconventional
arrangement forces
the audience to
read from lower
left to upper right
Poor design buries
the slide title in
an image, rather
than visually
emphasizing it
Consistent use
of bullets lets
audience focus
on the message,
not the mechanics
(a) Ineffective Design
(b) Effective Design
FIGURE 12.2 Ineffective and Effective Design
The slide in Figure 12.2a violates numerous principles of
effective design, as you can see in the annotations.
Figure 12.2b will never win any awards for exciting or
innovative design, but it does its job efficiently and effectively.
orative elements that clutter documents and potentially confuse
readers without
adding any relevant information.11 Computers make it far too
easy to add chartjunk,
from clip art illustrations to three-dimensional bar charts that
display only two di-
mensions of data (see Figure 12.3). When you need to show
distinctions between vi-
sual elements, follow Tufte’s strategy of the smallest effective
difference. In his words,
“Make all visual distinctions as subtle as possible, but still clear
and effective.”12 For
example, the slices in a pie chart don’t need to be distinguished
by both color and
texture; one or the other will do the job more efficiently.
M13_BOVE5352_09_SE_C12.QXD 5/18/07 2:46 PM Page
365
366 PART 4 Supporting Messages with Quality Information
46053 C PHNJ B&E A B P N 366 C/M/Y/K DESIGN
SERVICES OF
(a)
(b)
FIGURE 12.3 The Power
of Simplicity
These two graphs contain
the same information, but
Figure 12.3a is much easier to
interpret. None of the additional
elements in Figure 12.3b,
including the extra colors,
background design, and three-
dimensional structure, add any
information value—and they
make the graph harder to
interpret. Adding a false third
dimension to two-dimensional
information such as these sales
figures is a common mistake.
The Ethics of Visual Communication
Power always comes with responsibility—and the potential
power of visuals places an eth-
ical burden on every business communicator. This situation
involves not only the obvious
requirement of avoiding intentional ethical lapses but the more
complicated and often more
subtle requirement of avoiding unintentional lapses as well.
Ethical problems can range
from photos that play on racial or gender stereotypes to images
that imply cause-and-effect
relationships that may not exist to graphs that distort data (see
Figure 12.4).
Just as subtle word choices shade the meaning of your writing,
seemingly minor design
variations can influence the message your readers take away
from your business graphics. If
all three graphs in Figure 12.4 show the same data, which—if
any—would be more “hon-
Remember that the ability to
communicate with visuals comes
with the responsibility to
communicate ethically.
M13_BOVE5352_09_SE_C12.QXD 5/18/07 2:46 PM Page
366
3 L E A R N I N G O B J E C T I V E
Explain how to avoid ethical
lapses when using visuals
CHAPTER 12 Designing Visual Communication 367
46053 C PHNJ B&E A B P N 36 C/M/Y/K DESIGN SERVICES
OF
200
175
150
125
100
75
50
25
0
Jan
(c) Measured Impurities
Feb
Pa
rt
s
p
er
M
ill
io
n
Mar Apr May Jun Jul Aug Sep Oct Nov Dec
110
100
90
80
70
60
Jan
(b) Measured Impurities
Feb
Pa
rt
s
p
er
M
ill
io
n
Mar Apr May Jun Jul Aug Sep Oct Nov Dec
120
100
80
60
40
20
0
Jan
(a) Measured Impurities
Feb
Pa
rt
s
p
er
M
ill
io
n
Mar Apr May Jun Jul Aug Sep Oct Nov Dec
FIGURE 12.4 Influencing
Perception Through
Visual Design
Figure 12.4a shows impurities
measured over the course of a
12-month period; the vertical
scale is set from 0 to 120,
sufficient to cover the range of
variations in the data. However,
what if you wanted to make the
variations from month to month
look more severe? Less severe?
Figure 12.4b, with the scale
“zoomed in” to a narrow range
of 60 to 110, makes the
variations look much more
dramatic. The result could be a
stronger emotional impact on
the reader, creating the
impression that these impurities
are out of control. In contrast,
Figure 12.4c expands the scale,
from 0 to 200, which appears to
minimize the variations in the
data. This graph is visually
“calmer,” potentially creating the
opposite impression—that
there’s really nothing to worry
about. The data shown in all
three graphs are identical, but
they send three different
messages to the reader.
est” than the others? The answer to this question depends on
your intent and your audi-
ence’s information needs. For instance, if dramatic swings in
the measurement from month
to month suggest a problem with the quality of your product or
the safety of a process that
affects the public, then visually minimizing the swings might
well be considered dishonest.
Altering the scale of data charts is just one of many ways that
visuals can be designed to
emphasize or de-emphasize certain aspects of information. For
example, photographs can
influence perceptions of physical size (and perhaps of quality,
value, danger, or other asso-
ciated variables), depending on the way the various elements
are arranged in the picture. To
increase the perceived size of a product, an advertiser might
show a close-up of it being held
by someone with smaller-than-average hands. Conversely, a
large hand would make the
product seem smaller.
You can work to avoid ethical lapses in your visuals by
following these guidelines:13
● Consider all possible interpretations—and misinterpretations.
Try to view your
visuals from your audience members’ perspective; will their
biases, beliefs, or
backgrounds lead them to different conclusions than you’ve
intended? For instance,
You can take many steps to
emphasize or de-emphasize specific
elements in your visuals, but make
sure you don’t inadvertently
commit an ethical lapse while
doing so.
M13_BOVE5352_09_SE_C12.QXD 5/18/07 2:46 PM Page
367
368 PART 4 Supporting Messages with Quality Information
46053 C PHNJ B&E A B P N 368 C/M/Y/K DESIGN
SERVICES OF
Visuals can’t always speak for
themselves; make sure your
audience has enough context to
interpret your visuals correctly.
assume that you want to show how easy your product is to use,
and the photograph
you’ve chosen just happens to show a woman operating the
product. Will anyone
conclude that what you really mean to say is that your product
is so simple that “even
a woman can use it”? In other words, while trying to
compliment your product, are
you unintentionally insulting women?
● Provide context. Even when they are completely accurate, all
visuals can show only a
partial view of reality. This limitation ranges from the obvious
(photos can show only
what is within the camera’s view) to the subtle (graphs that
appear to show variations
in the quantity being measured when the differences are actually
measurement errors).
Part of your responsibility as a communicator is to provide not
only accurate visuals
but enough background information to help audiences interpret
the visual information
correctly.
● Don’t hide or minimize negative information that runs counter
to your argument.
Let’s say you’re responsible for employee satisfaction in all 10
of your company’s divi-
sions, and you measure the results of your efforts every quarter
through employee sur-
veys. If satisfaction scores are up in four divisions, unchanged
in three divisions, and
down in three divisions, you can’t legitimately “prove” that
you’re being successful with
a graph that highlights only the four positive data points.
● Don’t exaggerate information that supports your argument.
Similarly, you have a re-
sponsibility not to oversell information in support of your
argument. If employee sat-
isfaction in those four divisions is improved but still lower than
it should be, don’t
manipulate the graph to imply that all the problems have been
solved. You should also
resist the temptation to alter or enhance photographs and other
images in ways that
support your arguments. In skilled hands, image-processing
software can alter photos
in ways that most viewers cannot detect. The ethical burden
rests on business commu-
nicators to ensure that all of their visuals are complete, honest,
and truly representative
of the underlying information.
● Don’t oversimplify complex situations. By their very nature,
visuals tend to present
simplified views of reality. This is usually a benefit and one of
the key reasons for using
visuals, such as when you use a flowchart to provide an
overview of a complicated
process. However, take care not to mislead an audience by
hiding complications that are
important to the audience’s understanding of the situation.
● Don’t imply cause-and-effect relationships without providing
proof that they ex-
ist. For example, if you create a line chart that shows how
increasing sales seem to
track increasing advertising expenditures, you can claim a
correlation but not nec-
essarily a causal relationship between the two. You can claim a
causal relationship
(meaning that the increase in advertising spending caused the
increase in sales) only
if you can isolate advertising spending as the only factor that
can account for the in-
crease in sales.
● Avoid emotional manipulation or other forms of coercion.
Visuals, particularly pho-
tographs and video, can be persuasive elements to use in
emotional appeals. However,
you must take care not to overstep into unethical manipulation.
For instance, a photo-
graph of an unhappy child being treated as a social outcast
because he or she doesn’t
wear the latest fashions or own the trendiest new toys could be
considered an unethical
way to persuade parents to buy those products for their children.
● Be careful with the way you aggregate data. Preparing charts,
graphs, and tables that pres-
ent data often involves decisions about aggregating, or
grouping, data. For example, you
could summarize the output from one of your factories in a
variety of ways. To show out-
put over the course of one year, you could total the data by
month, creating a graph with
just 12 data points. This approach would emphasize monthly or
seasonal variations, but it
would hide weekly or daily variations that could be meaningful
to your audience. You
might find that production drops for the first few days of every
quarter, for instance, per-
haps because the staff has to work extra hard at the end of the
quarter to meet quarterly
production goals, then eases off for a few days to
compensate.Or you could present the data
from a different angle completely, such as showing average
output per hour over the course
The ways in which you aggregate
data for display can affect the
messages and meanings that your
audience extracts from your
visuals.
M13_BOVE5352_09_SE_C12.QXD 5/18/07 2:46 PM Page
368
CHAPTER 12 Designing Visual Communication 369
46053 C PHNJ B&E A B P N 369 C/M/Y/K DESIGN
SERVICES OF
Ethics Detective
Is Something Hiding Behind These Numbers?
You’ve been assigned to present the results of an industrywide
study of the effects of insecticide. Your audience consists of the
department heads in your company, whose experience and edu-
cation backgrounds vary widely, from chemical engineering to
insurance to law. You’re convinced you need to keep your
report
as simple and as jargon-free as possible.You’ll then invite
content-
area specialists to contact you if they have technical questions.
You’re not a scientific expert in insecticides, but your su-
pervisor has introduced you to a scientist who works for a
trade association that represents chemical producers, includ-
ing your firm. The scientist is familiar with the study you’ll be
reporting on, and she has experience in communicating tech-
nical subjects to diverse audiences. You jumped at the chance
to have such a knowledgeable person review your presentation
for technical accuracy, but you’re uncomfortable with some of
her feedback. In particular, you question her advice to replace
the following line chart, which shows the number of insecti-
cide poisonings and deaths by age.
She suggests that this chart is too busy and too difficult for
nonspecialists to read. As an alternative, she provides a bar
chart that selects four specific ages from the entire range. She
says this chart communicates the same basic idea as the line
chart but is much easier to read.
Ethics Detective
Poisonings
Deaths
0 2 4 6 8 10 12 14 16 18 20
Insecticide Accidents
Age of victim
80
70
60
50
40
30
20
10
0
N
um
b
er
o
f
in
ci
d
en
ts
Poisonings
Deaths
1 6 12 18
Insecticide Accidents
Age of victim
60
50
40
30
20
10
0
N
um
b
er
o
f
in
ci
d
en
ts
ANALYSIS
You agree with the scientist that the line chart is visually busy
and takes more effort to process, but something bothers you
about the bar chart. Does it present the insecticide situation
accurately and honestly? Why or why not?
of the eight-hour workday, which might highlight completely
different concerns. Low
output in the first hour of the day could signal people frequently
coming in late or
problems getting the machinery up and running every morning.
Whatever the situa-
tion, the decisions you make about aggregating the data can
have a profound effect on
the message your audience receives (see “Ethics Detective: Is
Something Hiding Behind
These Numbers?”).
M13_BOVE5352_09_SE_C12.QXD 5/18/07 2:46 PM Page
369
4 L E A R N I N G O B J E C T I V E
Explain how to choose which
points in your message to
illustrate
370 PART 4 Supporting Messages with Quality Information
46053 C PHNJ B&E A B P N 3 0 C/M/Y/K DESIGN SERVICES
OF
Effective visuals are clear, complete,
concise, connected, and compelling.
IDENTIFYING POINTS TO ILLUSTRATE
To help identify which parts of your message can benefit from
visuals, either to support your
textual message or perhaps to replace a section of text entirely,
step back and consider the
flow of your entire message from the audience’s point of view.
Which parts of the message
are likely to seem complex, open to misinterpretation, or even
just a little bit dull? Are there
any connections between ideas or data sets that might not be
obvious if they are addressed
only in text? Is there a lot of numerical data or other discrete
factual content that would be
difficult to read if presented in paragraph form? Is there a
chance that the main idea won’t
“jump off the page” if it’s covered only in text? Will readers
greet the message with skepti-
cism and therefore look for plenty of supporting evidence?
If you answer yes to any of these questions, you probably need
one or more visuals.
For instance, detailed facts and figures may be confusing and
tedious in paragraph form,
but tables and charts can conveniently organize and display
such detail with clarity. Some
points may require a detailed description of physical
relationships or procedures, in
which case you might want to use flowcharts, drawings, or
photographs to clarify the dis-
cussion. Or you may simply want to draw attention to a
particular fact or detail by rein-
forcing the message visually. When you’re deciding which
points to present visually, think
of the five Cs:
● Clear. The human mind is extremely adept at processing
visual information, whether
it’s something as simple as the shape of stop sign or as
complicated as the floor plan for
a new factory. If you’re having difficultly conveying an idea in
words, take a minute to
brainstorm some visual possibilities.
● Complete. Visuals, particularly tables, often serve to provide
the supporting details for
your main idea or recommendation. Moreover, the process of
summarizing, conclud-
ing, or recommending often requires you to narrow down your
material or exclude de-
tails; a table or other visual can provide these details without
getting in the way of your
main message.
● Concise. You’ve probably heard the phrase “A picture is
worth a thousand words.”
If a particular section of your message seems to require
extensive description or
explanation, see whether there’s a way to convey this
information visually. With a
picture working in conjunction with text, you may be able to
reduce your word
count considerably.
● Connected. A key purpose of many business messages is
showing connections of some
sort—similarities or differences, correlations, cause-and-effect
relationships, and so on.
Whenever you want readers to see such a connection, see
whether a chart, diagram, or
other illustration can help.
● Compelling. Your readers live in a highly visual world. Will
one or more illustrations
make your message more persuasive, more interesting, more
likely to get read? You
never want to insert visuals simply for decorative purposes, of
course, but even if a par-
ticular point can be expressed equally well via text or visuals,
consider adding the visual
in order to make your report or presentation more compelling.
As you identify which points in your document would benefit
from a visual, make sure
that each visual you decide on has a clear purpose (see Table
12.1).
SELECTING THE RIGHT TYPE OF VISUAL
Once you’ve identified which points would benefit most from
visual presentation, your next
decision is choosing which type of visual to use for each
message point. As you can see in
Figure 12.5, you have many choices for business graphics. For
certain types of information,
M13_BOVE5352_09_SE_C12.QXD 5/18/07 2:46 PM Page
370
5 L E A R N I N G O B J E C T I V E
Describe the most common
options for presenting data in
a visual format
CHAPTER 12 Designing Visual Communication 371
46053 C PHNJ B&E A B P N 3 1 C/M/Y/K DESIGN SERVICES
OF
TABLE 12.1 When to Use Visuals
PURPOSE APPLICATION
To clarify Support text descriptions of “graphic” topics:
quantitative or
numerical information, explanations of trends, descriptions.
To simplify Break complicated descriptions into components
that can be depicted
with conceptual models, flowcharts, organization charts, or
diagrams.
To emphasize Call attention to particularly important points by
illustrating them
with line, bar, and pie charts.
To summarize Review major points in the narrative by
providing a chart or table that
sums up the data.
To reinforce Present information in visual and written form to
increase reader’s
retention.
To attract Make material seem more interesting by decorating
the cover or title
page and by breaking up the text with visual aids.
To impress Build credibility by putting ideas into visual form to
convey the
impression of authenticity and precision.
To unify Depict the relationship among points—for example,
with a flowchart.
You have many types of visuals to
choose from, and each is best suited
to particular communication tasks.
the decision is usually obvious. To present a large set of
numerical values or detailed textual
information, a table is the obvious choice in most cases.
However, if you’re presenting data
broken down geographically, a color-coded map might be more
effective to show overall
patterns rather than individual data points. Also, certain visuals
are used more commonly
for certain applications, so your audience is likely to expect line
charts and bar charts to
show trends. Line charts usually show data variations relative to
a time axis (such as sales
month by month), whereas bar charts more often compare
discrete groups (such as sales by
demographic segment). Although a bar chart can show the
percentages that make up a
whole, this job is usually reserved for pie charts.
The following sections explore the most common types of
visuals in more detail, start-
ing with visuals designed to present data.
Presenting Data
Business professionals have a tremendous number of choices for
presenting data, from
general purpose line, bar, and pie charts to specialized charts
for product portfolios, finan-
cial analysis, and other professional functions. The visuals most
commonly used to pre-
sent data include tables; line and surface charts; bar charts,
pictograms, and Gantt charts;
scatter and bubble diagrams; and pie charts.
Tables
When you need to present detailed, specific information, choose
a table, a systematic
arrangement of data in columns and rows. Tables are ideal when
your audience needs infor-
mation that would be either difficult or tedious to handle in the
main text.
Most tables contain the standard parts illustrated in Table 12.2.
Every table includes
vertical columns and horizontal rows, with useful headings
along the top and side. The
number of columns and rows you can comfortably fit in a table
depends on the medium.
For printed documents, you can adjust font size and column and
row spacing to fit a
considerable amount of information on the page and still
maintain readability. For on-
line documents, you’ll need to reduce the number of columns
and rows to make sure
Printed tables can display extensive
amounts of data, but tables for
online display and electronic
presentations need to be simpler.
M13_BOVE5352_09_SE_C12.QXD 5/18/07 2:46 PM Page
371
Gospel Benson
Gospel Benson
Gospel Benson
Gospel Benson
Gospel Benson
Gospel Benson
Gospel Benson
Gospel Benson
Gospel Benson
Gospel Benson
372 PART 4 Supporting Messages with Quality Information
46053 C PHNJ B&E A B P N 3 2 C/M/Y/K DESIGN SERVICES
OF
Communication Challenge
Table
Line chart,
bar chart
Bar chart,
line chart
Pie chart
Scatter chart,
bubble chart
Map
Flowchart,
diagram
Drawing
Photograph
Animation,
video
To present individual,
exact values
To show trends in one or
more variables, or the
relationship between those
variables, over time
To compare two or more
sets of data
To show frequency or
distribution of parts in a
whole
To compare entities against
two or three variables
To show geographic
relationships or comparisons
To illustrate processes or
procedures
To show conceptual or
spatial relationships
(simplified)
To show spatial relationships
(realistic)
To show processes,
transformations, and so
on in action
Effective Visual Choice
Presenting Data
Presenting Information, Concepts, and Ideas
4,500
4,250
4,000
3,750
3,500
3,250
3,000
2,750
2,500
0
2001 2002 2003 2004 2005
Operating Revenue
M
ill
io
n
$
2500
2000
1500
1000
500
0
8:
00
A
M
8:
30
A
M
9:
00
A
M
9:
30
A
M
10
:0
0
AM
10
:3
0
AM
11
:0
0
AM
11
:3
0
AM
12
:0
0
AM
12
:3
0
AM
1:
00
A
M
1:
30
A
M
2:
00
A
M
2:
30
A
M
3:
00
A
M
3:
30
A
M
4:
00
A
M
4:
30
A
M
5:
00
A
M
Average Kiln Temperatures, North Island Facility, Day Shift
Kiln A
Kiln BT
em
p
er
at
ur
e
˚
F
100%
90%
80%
70%
60%
50%
40%
30%
20%
10%
0
E-mail Desktop
Publishing
SreadsheetsGraphicsInstant
Messaging
Database
Development
HTML/XML
Programming
CommuniCo Staff Computer Skills
100%
90%
80%
70%
60%
50%
40%
30%
20%
10%
0
North America
2003
Worldwide Market Share
2004 2005
Central/
South America
Asis/Pacific Europe/Africa/
Middle East
30%
25%
20%
15%
10%
5%
0%
Competitor Financial Health
0% 10% 20% 30%
Revenue Growth Rate
Pr
of
it
M
ar
g
in
40% 50% 60% 70%
30%
25%
20%
15%
10%
5%
0%
Competitor Financial Health
0% 10% 20% 30%
Revenue Growth Rate
Pr
of
it
M
ar
g
in
40% 50% 60% 70%
Year-End Head Count by Function
Assemblers, 67
Engineers, 27
Marketing/sales, 28
Admin support, 25
Shipping, 17
Facilities, 14
Accounting, 14
Executives, 8
Verify overage with
requesting dept.
Return invoice
to vendor
Submit to accounts
payable
No
Yes
Yes
Valid
purchase
order?
Receive invoice
No
Amount
within
PO limit?
Accepted? NoYes
9,300
5,500
3,700
1,700
600
49,300
9,300
5,500
3,700
1,700
(11 states)
(9)
(10)
(11)
(9)
to
to
to
to
to
U.S. Population Projections for 2025 (in thousands)
27,183
1,812
885
6,412
2,883
2,312
1,739
7,808
4,349
49,285
6,250
4,057
3,108
2,612
5,188
694
1,121
729
866
13,440 6,546
6,665
4,314
8,466
9,349
9,8695,2243,142
3,055
5,133
1,930
3,040
5,510
5,867
11,744
10,078
12,683
19,830
1,423
FIGURE 12.5 Selecting the Best Visual
For each point you want to illustrate, make sure you choose the
most effective type
of visual.
your tables are easily readable online. Tables for oral
presentations usually need to be the
simplest of all, because you can’t expect audiences to read
detailed information from the
screen.
Although complex information may require formal tables that
are set apart from
the text, you can present some data more simply within the text.
You make the table, in
essence, a part of the paragraph, typed in tabular format. Such
text tables are usually in-
troduced with a sentence that leads directly into the tabulated
information. Here’s an
example:14
M13_BOVE5352_09_SE_C12.QXD 5/18/07 2:46 PM Page
372
CHAPTER 12 Designing Visual Communication 373
46053 C PHNJ B&E A B P N 3 3 C/M/Y/K DESIGN SERVICES
OF
Here is how the five leading full-service restaurant chains
compare in terms of number of
locations and annual revenue:
OSI RESTAURANT
PARTNERS APPLEBEE’S CARLSON BRINKER DARDEN
Major Chain(s) Outback Steakhouse,
Carrabba’s
Applebee’s TGI Friday’s,
Pick Up Stix
Chili’s,
Romano’s
Red Lobster,
Olive Garden
Locations 1,300 1,800 900 1,600 1,400
Revenue ($ Million) $3,602 $1,217 $2,400 $4,151 $5,721
Source: Hoover’s Online [accessed 17 November 2006]
www.hoovers.com.
Line charts are commonly used to
show trends over time or the
relationship between two or more
variables.
When you prepare tables, follow these guidelines to make your
tables easy to read:
● Use common, understandable units, and clearly identify the
units you’re using, whether
it’s dollars, percentages, price per ton, or whatever.
● Express all items in a column in the same unit and round off
for simplicity.
● Label column headings clearly and use a subhead if
necessary.
● Separate columns or rows with lines or extra space to make
the table easy to follow; in
complex tables, consider highlighting every other row or
column in a pale, contrasting
color.
● Provide totals or averages of columns or rows when relevant.
● Document the source of the data using the samze format as a
test footnote (see
Appendix II).
Although numerical tables are more common, tables can also
contain words, symbols,
or other facts and figures. Word tables are particularly
appropriate for presenting survey
findings or for comparing various items against a specific
standard.
Line and Surface Charts
A line chart illustrates trends over time or plots the relationship
of two or more variables.
In line charts showing trends, the vertical, or y, axis shows the
amount, and the horizontal,
or x, axis shows the time or other quantity against which the
amount is being measured.
Both axes often start at zero in the lower left-hand corner, but
you can exercise a fair amount
of flexibility with both axes in order to present your data as
clearly as possible. For instance,
to show both positive and negative values (such as profit and
loss), you can have the y axis
span from a negative value up to a positive value, with zero
somewhere in between. Of
course, you should always avoid distorting the data in ways that
could mislead your audi-
ence, as “The Ethics of Visual Communication” noted on page
366.
TABLE 12.2 Parts of a Table
MULTICOLUMN HEAD*
STUB HEAD SUBHEAD SUBHEAD SINGLE-COLUMN HEAD
SINGLE-COLUMN HEAD
Row head XXX XXX XX XX
Row head
Subhead XX XXX XX X
Subhead XX XXX XX XX____ ____ ___ ___
Total XXX XXX XX XX
Source: (In the same format as a text footnote; see Appendix B.)
*Footnote (For an explanation of elements in the table, a
superscript number or small letter may be used instead of an
asterisk or other symbol.)
M13_BOVE5352_09_SE_C12.QXD 5/18/07 2:46 PM Page
373
Gospel Benson
374 PART 4 Supporting Messages with Quality Information
46053 C PHNJ B&E A B P N 3 4 C/M/Y/K DESIGN SERVICES
OF
90,000
80,000
70,000
60,000
50,000
40,000
30,000
20,000
10,000
0
2001 2002 2003 2004 2005 20072006
Home Game Ticket Sales
Other
Students
Families
Alumni
Staff
A
ve
ra
g
e
p
er
G
am
e
FIGURE 12.7 Surface
Chart
Surface or area charts can show
a combination of trends over
time and the individual
contributions of the components
of a whole.
2,500
2,000
1,500
1,000
500
0
8:
00
A
M
8:
30
A
M
9:
00
A
M
9:
30
A
M
10
:0
0
AM
10
:3
0
AM
11
:0
0
AM
11
:3
0
AM
12
:0
0
PM
12
:3
0
PM
1:
00
PM
1:
30
PM
2:
00
PM
2:
30
PM
3:
00
PM
3:
30
PM
4:
00
PM
4:
30
PM
5:
00
PM
Average Kiln Temperatures, North Island Facility, Day Shift
Kiln A
Kiln BT
em
p
er
at
ur
e
˚F
FIGURE 12.6 Line Chart
This two-line chart compares the
temperatures measured inside
two cement kilns from 8:00 A.M.
to 5:00 P.M.
If you need to compare two or more sets of data, you can plot
them on the same chart
for instant visual comparison (see Figure 12.6). Two or three
lines on a single chart are usu-
ally easy to read, but beyond that, things can get confusing,
particularly if the lines cross.
By their very nature, line charts often raise the question, “What
happens next?” For in-
stance, if you present sales data for the past 12 months, your
audience may well ask what you
think will happen in the next 12 months. Predicting the future is
always a risky endeavor, but
you can use your spreadsheet’s forecasting tools to extend a line
into the future using a sta-
tistical technique known as regression analysis. Check your
spreadsheet’s Help function for
more information on using its linear regression, trend line, or
forecasting functions. However,
when using these tools, be aware that all they can do is extract
patterns from past data and
extend those patterns into the future. They don’t have any
awareness of the “real-life” factors
that shaped that past data—and may or may not produce that
same pattern in the future.
A surface chart, also called an area chart, is a form of line chart
with a cumulative ef-
fect; all the lines add up to the top line, which represents the
total (see Figure 12.7). This
form of chart helps you illustrate changes in the composition of
something over time. One
common use is showing how sales of individual products
contribute to the company’s over-
all revenue.15 When preparing a surface chart, put the most
important segment on the bot-
tom and build up from there.
Bar Charts, Pictograms, and Gantt Charts
A bar chart portrays numbers by the height or length of its
rectangular bars, making a series
of numbers easy to read or understand. Bar charts are
particularly valuable when you want to
● Compare the size of several items at one time
● Show changes in one item over time
A spreadsheet offers ways to predict
future values based on past values
shown in a line chart.
M13_BOVE5352_09_SE_C12.QXD 5/18/07 2:46 PM Page
374
Gospel Benson
CHAPTER 12 Designing Visual Communication 375
46053 C PHNJ B&E A B P N 3 5 C/M/Y/K DESIGN SERVICES
OF
100%
90%
80%
70%
60%
50%
40%
30%
20%
10%
0
E-mail Desktop
Publishing
BloggingGraphicsInstant
Messaging
Podcasting HTML/XML
Programming
(a) CommuniCo Staff Computer Skills FIGURE 12.8 The
Versatile Bar Chart
Here are six of the dozens of
variations possible with bar
charts: singular (12.8a),
grouped (12.8b),
deviation (12.8c). (continued)
100%
90%
80%
70%
60%
50%
40%
30%
20%
10%
0
North America
2005
(b) Worldwide Market Share
2006 2007
Central/
South America
Asia/Pacific Europe/Africa/
Middle East
$50.00
$45.00
$40.00
$35.00
$30.00
12/5
low
open
close
high
(c) CommuniCo Stock Price
12/6 12/7 12/8 12/9
You can create bar charts in a wide
variety of formats; choose the form
that best illustrates the data and
relationships in your message.
● Indicate the composition of several items over time
● Show the relative size of components of a whole
As the charts in Figure 12.8 show, bar charts can appear in
various forms. Grouped bar
charts compare more than one set of data, using a different
color or pattern for each set.
Deviation bar charts identify positive and negative values, or
winners and losers. Segmented
bar charts, also known as stacked bar charts, show how
individual components contribute
to a total number, using a different color or pattern for each
component. Combination bar
and line charts compare quantities that require different
intervals. Paired bar charts show
the correlations between two items.
Figure 12.8 also suggests how creative you can be with bar
charts.You might align the bars
either vertically or horizontally, or you might use bar charts to
show both positive and nega-
tive quantities. Be careful, however, to keep all the bars in the
chart the same width; different
widths could suggest a relative importance to the viewer. In
addition, space the bars evenly and
place them in a logical order, such as chronological or
alphabetical. Most of the software you’ll
M13_BOVE5352_09_SE_C12.QXD 5/18/07 2:46 PM Page
375
be using to create charts makes these choices for you; just be
sure to verify what the software
has done and override any settings that don’t seem to work well
for a given chart.
You can also convert the bars into lines of symbols, so that the
number or length of the
symbols indicates the relative value of each item. A chart that
portrays data as symbols in-
stead of words or numbers is known as a pictogram. The chief
value of pictograms is their
novelty and ability to convey a more literal, visual message, but
they tend to be more diffi-
cult to read and can present a less professional tone than a
straightforward bar chart.
Closely related to the bar chart is the time line chart, which
shows how much time is
needed to complete each task in a given project. When you want
to track progress toward com-
pleting a project, you can use a type of time line chart known as
a Gantt chart (see Figure 12.9).
Scatter and Bubble Diagrams
If you need to compare several entities (companies, markets,
employees, and so on) by two
variables, such as revenue and profit margin, use a scatter
diagram, also known as an XY
diagram. This diagram is similar to a line chart in the sense that
one variable is plotted along
the x (horizontal) axis and another along the y (vertical) axis.
However, in a scatter diagram,
individual points are plotted, not continuous lines. The bubble
diagram expands to three
variables, with the size of the bubble representing the third
variable (see Figure 12.10).
376 PART 4 Supporting Messages with Quality Information
46053 C PHNJ B&E A B P N 3 6 C/M/Y/K DESIGN SERVICES
OF
100%
90%
80%
70%
60%
50%
40%
30%
20%
10%
0
Sales
IM
(d) CommuniCo Preferred Communication Media
Engineering Admin
E-Mail Telephone Text Messaging Face-to-Face
FIGURE 12.8 Continued
Segmented (12.8d), combination
(12.8e), and paired (12.8f).
16,000
14,000
12,000
10,000
8,000
6,000
4,000
2,000
0
$8,000,000
$7,000,000
$6,000,000
$5,000,000
$4,000,000
$3,000,000
$2,000,000
$1,000,000
$0
2002
Headcount Training Costs
(e) CommuniCo Employee Training Costs
2003 2004 2005 2006 2007
H
ea
d
co
un
t
Training
C
osts
Women in
Attendance
Men in
Attendance
600
800
450
750
590
950
(f) Conference Attendance by Gender
San Diego Conference
Las Vegas Conference
Miami Conference
Scatter diagrams compare entities
against two variables; bubble
diagrams compare them against
three.
M13_BOVE5352_09_SE_C12.QXD 5/18/07 2:46 PM Page
376
Gospel Benson
Pie Charts
Like segmented bar charts and area charts, a pie chart shows
how the parts of a whole are
distributed. However, pie charts have the advantage of
familiarity; most people expect parts
of a whole to be displayed via a pie chart. Each segment
represents a slice of a complete cir-
cle, or pie. As you can see in Figure 12.11, pie charts are an
effective way to show percentages
or to compare one segment with another. You can also combine
pie charts with tables to ex-
pand the usefulness of such visuals.
When creating pie charts, try to restrict the number of slices in
the pie. Otherwise, the
chart looks cluttered and is difficult to label. If necessary, lump
the smallest pieces together
in a “miscellaneous” category. Ideally, the largest or most
important slice of the pie, the seg-
ment you want to emphasize, is placed at the 12 o’clock
position; the rest are arranged clock-
wise either in order of size or in some other logical progression.
CHAPTER 12 Designing Visual Communication 377
46053 C PHNJ B&E A B P N 3 C/M/Y/K DESIGN SERVICES
OF
1
2
3
4
5
6
7
8
9
10
11
Design Phase
Design Project
Prototype Design
Test Prototype
Prototype Complete
Marketing Research Phase
Preliminary Research
Conduct Focus Groups
Interviews
Analyze Research Results
Create Marketing Plan
6/20/07
6/20/07
8/3/07
8/24/07
8/31/07
8/3/07
8/3/07
8/10/07
8/12/07
8/17/07
8/31/07
8/31/07
7/31/07
8/21/07
8/28/07
8/31/07
9/25/07
8/7/07
8/11/07
8/14/07
8/28/07
9/25/07
73d
42d
19d
5d
0d
54d
5d
2d
3d
12d
26d
90.00
100.00
100.00
0.00
0.00
25.00
100.00
100.00
100.00
0.00
0.00
June SeptemberAugustJuly
2007
ID Project Time line Start Date End Date Duration Percentage
Complete
%
FIGURE 12.9 Gantt Chart
This Gantt chart shows the activities involved in designing the
prototype and conducting the
marketing research for a new product. The maroon bars indicate
completed tasks, the blue bars
indicate activities not yet completed, and the black diamond is a
milestone—in this case the
prototype’s due date.
30%
25%
20%
15%
10%
5%
0%
Competitor Financial Health
0% 10% 20% 30%
Revenue Growth Rate
Pr
of
it
M
ar
g
in
40% 50% 60% 70%
Extan (Annual sales: $155M/yr)
Flizel (Annual sales: $700M/yr)
Zenach (Annual sales: $850M/yr)
MooreComp (Annual sales: $1.4B/yr)
FIGURE 12.10 Bubble
Diagram
The bubble diagram shows three
variables: distance along the x
and y axes, plus the diameter of
each bubble. In this case, the
rate of revenue growth is plotted
on the x axis, profit margin is
plotted on the y axis, and the
size of the bubbles represents
annual revenues. For instance,
MooreComp has the greatest
revenues but the lowest profit
margin, although it is growing
faster than two of its three
competitors.
Most readers expect pie charts to
show the distribution of parts
within a whole.
M13_BOVE5352_09_SE_C12.QXD 5/18/07 2:46 PM Page
377
Gospel Benson
Gospel Benson
378 PART 4 Supporting Messages with Quality Information
46053 C PHNJ B&E A B P N 3 8 C/M/Y/K DESIGN SERVICES
OF
Year-End Head Count by Function
Assemblers, 67
Engineers, 28
Marketing/sales, 27
Admin support, 25
Shipping, 17
Facilities, 14
Accounting, 14
Executives, 8
FIGURE 12.11 Pie Chart
When creating pie charts, use
different colors or patterns to
distinguish the various pieces.
Label all the segments and
indicate their value in either
percentages or units of measure
so that your readers will be able
to judge the value of the wedges.
Be sure to distinguish the slices in
the pie chart with different colors
or patterns.
Use flowcharts to show a series of
steps in a process or other
sequential relationships.
Use organization charts to depict
the interrelationships among the
parts of a whole.
Use different colors (or patterns, if you’ll be printing or
reproducing charts in black and
white) to distinguish the various pieces. If you want to draw
attention to the segment that
is of the greatest interest to your readers, use a brighter color
for that segment, draw an ar-
row to the segment, or explode it by pulling the segment away
from the rest of the pie. In any
case, label all the segments and indicate their value in either
percentages or units of mea-
sure so that your readers will be able to judge the value of the
wedges. Remember, the seg-
ments must add up to 100 percent if percentages are used or to
the total number if numbers
are used.
Presenting Information, Concepts, and Ideas
In addition to facts and figures, you’ll need to present other
types of information, from spa-
tial relationships to abstract ideas. As Keith Yamashita and his
colleagues at SYP demon-
strate, words aren’t always the best way to communicate
information, concepts, or ideas, so
these professionals often look for visual solutions to
complement or even replace textual in-
formation. The most common types of visuals for these
applications include flowcharts and
organization charts; maps; drawings, diagrams, and
photographs; and animation and video.
Flowcharts and Organization Charts
If you need to show physical or conceptual relationships rather
than numerical ones, you
might want to use a flowchart or an organization chart. A
flowchart (see Figure 12.12) il-
lustrates a sequence of events from start to finish; it is
indispensable when illustrating
processes, procedures, and sequential relationships. For general
business purposes, you
don’t need to be too concerned about the specific shapes, but
keep them consistent. How-
ever, be aware that there is a formal flowchart “language” in
which each shape has a specific
meaning (diamonds are decision points, rectangles are process
steps, and so on). If you’re
communicating with computer programmers and others who are
accustomed to formal
flowcharting, make sure you use the correct symbols in each
case to avoid confusion. Graph-
ics programs that have flowchart symbols usually label their
functions, making it easy to use
the right ones.
As the name implies, an organization chart illustrates the
positions, units, or functions
of an organization and the way they interrelate (Figure 12.13).
These charts aren’t limited
to organizational structures, of course; as you saw in Chapter 4,
they can also be used to out-
line messages.
Maps
Maps can be used in a variety of ways to show location,
distance, points of interest (such as
competitive retail outlets), and geographic distribution of data,
such as sales by region or
population by state. In addition to presenting facts and figures,
maps are useful for showing
market territories, distribution routes, and facilities locations.
Maps are sometimes used in
conjunction with aerial photographs to provide a richer view
(see Figure 12.14).
Use maps for such tasks as
representing statistics by
geographic area or showing spatial
relationships.
M13_BOVE5352_09_SE_C12.QXD 5/18/07 2:46 PM Page
378
CHAPTER 12 Designing Visual Communication 379
46053 C PHNJ B&E A B P N 3 9 C/M/Y/K DESIGN SERVICES
OF
Verify overage with
requesting dept.
Return invoice
to vendor
Submit to accounts
payable
No
Yes
Yes
Valid
purchase
order?
Receive invoice
No
Amount
within
PO limit?
Accepted? NoYes
FIGURE 12.12
Flowchart
Flowcharts show sequences of
events and are most valuable
when the process or procedure
has a number of decision points
and variable paths.
Board of Trustees
President
Dean of the
College
Dean of
Students
Dean of
Administration
Dean of Technical
Education Division
Dean of General
Education Division
Dean of Continuing
Education Division
Technical
Education
Division Faculty
General Education
Division Faculty
Continuing
Education
Division Faculty
Business
Manager
Personnel
Manager
Admissions
Director
Counselor Registrar
Administration and Faculty of Atlantic College
FIGURE 12.13 Organization Chart
An organization chart is the expected way to illustrate the
hierarchy of positions in an organization.
M13_BOVE5352_09_SE_C12.QXD 5/18/07 2:46 PM Page
379
380 PART 4 Supporting Messages with Quality Information
46053 C PHNJ B&E A B P N 380 C/M/Y/K DESIGN
SERVICES OF
9,300
5,500
3,700
1,700
600
49,300
9,299
5,499
3,699
1,699
(11 states)
(9)
(10)
(11)
(9)
to
to
to
to
to
U.S. Population Projections for 2030 (in thousands)
(a) Map Showing Statistical Data
(b) Map Generated by a Geographical Information System
27,183
1,812
885
6,412
2,883
2,312
1,739
7,808
4,349
49,285
6,250
4,057
3,108
2,612
5,188
694
1,121
729
866
13,440 6,546
6,665
4,314
8,466
9,349
9,349
20,710
1,845
1,439
1,439
678
9,8695,2243,142
3,055
5,133
1,930
3,040
5,510
5,867
11,744
10,078
12,683
19,830
1,423
9,349
3,739
9,558
861
6,274
FIGURE 12.14 Map
Maps offer many opportunities
for displaying data and
information. The map in Figure
12.14a shows population
projections for each state in the
United States. Figure 12.14b is a
simple version of a geographic
information system, in this case
showing hotels and motels in a
neighborhood near New York’s
La Guardia Airport. A company
looking for sites to build a hotel
in this area could use such a
map to identify potential
competitors, traffic patterns, and
other important variables.
Simple maps are available via clip art libraries for your word
processor and presen-
tation software, but more powerful uses (such as automatically
generating color-coded
maps based on data inputs) usually require the specialized
capabilities of geographic in-
formation systems. You may also want to explore online
resources such as Google Earth
(http://earth.google.com) and Windows Live
(http://maps.live.com), which offer a variety
of mapping and aerial photography features.
M13_BOVE5352_09_SE_C12.QXD 5/18/07 2:46 PM Page
380
6 L E A R N I N G O B J E C T I V E
Identify five guidelines for
using photographs
effectively
CHAPTER 12 Designing Visual Communication 381
46053 C PHNJ B&E A B P N 381 C/M/Y/K DESIGN
SERVICES OF
Use drawings and diagrams to
show how something works or how
it is made or used; drawings are
sometimes better than photographs
because they let you focus on the
most important details.
Macintosh
Computers
Mobile
Professionals
Telecommuters
OS/2 PCs
Legacy DOS PCs
ISON
Dial-up
UNIX X terminals
Portable
Windows
Tablets
Wireless
LAN-based
Desktop PCs
UNIX Workstations
Cross-Platform
Desktops
Web Computing
Server
Microsoft Windows or Linux
Branch
Offices
Remote
Computing
Wireless Terminals and
Information Appliances
Internet
Network
LAN
WAN
FIGURE 12.15 Diagram
Clearly drawn diagrams can help
audiences grasp technical
information quickly.
Drawings, Diagrams, and Photographs
Although drawings, diagrams, and photographs are often created
by people working in
communication specialties such as web design or technical
writing, all managers encounter
situations in which such images can help get their messages
across (see Figure 12.15). For
example, when Brian Lamkin, an executive at Adobe Systems,
wants to inform his staff
about new competitive products being demonstrated at trade
shows or the way Adobe prod-
ucts are being displayed in a particular retail store, he uses his
digital camera to share im-
ages.16 Simple drawings can show the network of suppliers in
an industry, the flow of funds
through a company, or the process for completing the payroll
each week. More complex di-
agrams can convey technical topics such as the operation of a
machine or repair procedures.
Word processors and presentation software provide basic
drawing capabilities, but for
more precise and professional illustrations you’ll need a
specialized package such as Mi-
crosoft Visio or Adobe Illustrator. Moving a level beyond those
programs, computer-aided
design (CAD) systems such as Autodesk’s Autocad can produce
extremely detailed architec-
tural and engineering drawings.
Photographs offer both functional and decorative value. In the
past, their use was lim-
ited to specialized documents such as annual reports and
product brochures; however, with
low-cost digital photography now widely available, virtually all
writers can have the ability
to add photographs to print documents, presentations, and
webpages. In addition, photo li-
braries such as Getty Images (www.gettyimages.com) and photo
search engines such as the
one provided by AltaVista (www.altavista.com/image) make it
easy to find digital photo-
graphs. Some of these photos are available for free, but the
professional collections, such as
Getty Images, require either a one-time payment for unlimited
use (often called royalty free)
or an annual payment or other limited-use purchase (often
called rights managed).
However, as with all computer advances, “easy” doesn’t always
mean “effective.” To use
photographs successfully, consider these five guidelines:
● Consider whether a diagram would be more effective than a
photograph.
Photographs are often unmatched in their ability to
communicate spatial relationships,
sizes, shapes, and other physical parameters, but sometimes
they communicate too
Use photographs for visual appeal
and to show exact appearances.
M13_BOVE5352_09_SE_C12.QXD 5/18/07 2:46 PM Page
381
382 PART 4 Supporting Messages with Quality Information
46053 C PHNJ B&E A B P N 382 C/M/Y/K DESIGN
SERVICES OF
Match the resolution of your photo
files to the application; use higher
resolution for print and lower
resolution for electronic display.
much information. For example, to show how to adjust a
specific part of a complicated
machine, a photo can be confusing because it shows all the parts
within the camera’s
view. A simplified diagram is often more effective because it
allows you to emphasize
the specific parts that are relevant to the problem at hand.
● Learn how to use basic image-processing tools. For instance,
you can drop photo-
graphs directly into your word processor or presentation files,
then use that program to
change the size of the file to fit the available space, but this
isn’t always the best ap-
proach. Rather than simply resizing, you might be better off
cropping, or electronically
cutting away part of the photo.
● Match the file to the application. Digital photos vary widely
in resolution, which is the
amount of detail in the image. Resolution can be expressed in
one of two ways. Digital
cameras are usually specified in pixels, the total number of
picture elements in the file.
For example, a 5-megapixel camera produces a photo with 5
million pixels in the im-
age. Printers and scanners are usually specified in dots per inch,
or dpi, which is the num-
ber of discrete points per linear inch. A 600 dpi office printer,
therefore, outputs 360,000
(600 ! 600) discrete dots per square inch. Up to the limits of the
printer, greater reso-
lution is usually better for printed documents, but it isn’t
always helpful for online use.
High-resolution image files are significantly larger than low-
resolution image files, so
they consume more storage space and take longer to transmit or
download. In addition,
most computer monitors and other electronic displays have less
than 100 dpi resolution
and therefore can’t display all the fine detail in high-resolution
images anyway. (To be
accurate, it is possible to show all the detail, but doing so
requires scaling up the photo
to large and unwieldy sizes.) If you plan to use photos on a
website or online report, use
the “save for web” feature in your image-processing software to
reduce the resolution
and therefore the file size.
● Make sure the photographs have communication value. Just
because it’s easy to drop
photos into documents doesn’t mean you should automatically
do so, naturally. Judge
photographs with the same discerning eye you use for every
other element of your re-
port or presentation.
● Be aware of copyrights and model permissions. Just as with
the textual information
that you find online, you can’t simply insert online photographs
into your documents.
Unless they are specifically offered for free, you have to assume
someone owns the pho-
tos and is entitled to payment or at least a photo credit. In
addition, professional pho-
tographers are careful to have any person who poses in photos
sign a model release
form, which gives the photographer permission to use the
person’s image.
Technology makes it easy to use photographs in reports and
presentations, but it also
presents an important ethical concern. Software tools such as
Photoshop and Paint Shop
Pro allow you to easily make dramatic changes to photos—
without leaving a clue that
they’ve been altered. Altering photos in small ways has been
possible for a long time (more
than a few students have had blemishes airbrushed out of their
yearbook photos), but com-
puters make drastic changes easy and undetectable. You can
remove people from photo-
graphs, put Person A’s head on Person B’s body, and make
products look more attractive
than they really are. Most people would agree that it’s
acceptable to make cosmetic improve-
ments, such as brightening an underexposed photo to make it
easier to view. But to avoid
ethical lapses, don’t make any alterations that mislead the
viewer or substantially change the
message conveyed by the photo.17
Animation and Video
Computer animation and video are among the most specialized
forms of business visuals;
when they are appropriate and done well, they offer
unparalleled visual impact. At a simple
level, you can animate shapes and text within electronic
presentations (see Chapter 17). At
a more sophisticated level, software such as Macromedia Flash
enables the creation of mul-
timedia files that include computer animation, digital video, and
other elements. A wide va-
riety of tools are also available for digital video production.
Whether you use these tools
yourself or employ a specialist to create animation or video for
you, make sure the results
follow all the guidelines for effective business messages.
Altering or enhancing photographs
can create ethical problems.
M13_BOVE5352_09_SE_C12.QXD 5/18/07 2:46 PM Page
382
CHAPTER 12 Designing Visual Communication 383
46053 C PHNJ B&E A B P N 383 C/M/Y/K DESIGN
SERVICES OF
PRODUCING AND INTEGRATING VISUALS
Now that you understand the communication power of visuals
and have chosen the best visuals to illustrate key points in your
report, website, or presentation, it’s time to get creative. This
section offers advice on creating visuals, integrating them with
your text, and verifying the quality of your visual elements.
Creating Visuals
Technology has put powerful graphics tools in the hands of
virtually every business computer user, so you no longer have
to rely on professional designers as much as businesspeople
had to only a few years ago. Unfortunately, computers can’t
provide the specialized training and hands-on experience of
a professional designer. Computers make it easy to create vi-
suals, but they also make it easy to create ineffective, distract-
ing, and even downright ugly visuals. However, by following
the basic design principles discussed on pages 363 to 365, you
can create all the basic visuals you need—visuals that are both
attractive and effective.
Whether you’re using the charting functions offered in a
spreadsheet or the design features of a specialized graphics pro-
gram, take a few minutes to familiarize yourself with the soft-
ware’s quirks and capabilities. For instance, spreadsheets can
create charts with just a few clicks of the mouse, but the default
colors, fonts, or other design elements might not be the best for
your particular needs. If possible, have a professional designer
set
up a template for the various types of visuals you and your col-
leagues need to create. In addition to helping ensure an
effective
design, using templates saves you the time of making numerous
design decisions every time you create a chart or graphic.
However, be careful with the templates included with
some commercial software programs. Some are “overde-
signed” and inappropriate for serious business uses, and some
clutter the image with fancy borders and backgrounds that can
distract an audience from your real message.
No matter which tools you’re using, take care to match the
style and quality of your visuals with the subject matter and
the situation at hand. The style of your visuals communicates
a subtle message about your relationship with the audience. A
simple sketch might be fine for a working meeting but inap-
propriate for a formal presentation or report. On the other
hand, elaborate, full-color visuals may be viewed as extravagant
for an informal report but
may be entirely appropriate for a message to top management or
influential outsiders.
Integrating Visuals with Text
For maximum effectiveness and minimum disruption for the
reader, visual elements need
to be carefully integrated with the text of your message. In
some instances, visual elements
are somewhat independent from the text, as in the sidebars that
occasionally accompany
magazine articles. Such images are related to the content of the
main story, but they aren’t
referred to by a specific title or figure number. This sort of
treatment is used most often in
promotional materials such as brochures and advertisements.
For reports and most other business documents, however,
visuals are tightly integrated
with the text so that readers can move back and forth between
text and visuals with as little
To show investors what a new building would look like in its
environment, an artist combined a photograph of a scale model
of
the building with a photograph of the actual street scene.
Because
the target audience clearly understands that the building doesn’t
exist, this sort of image manipulation is not unethical.
M13_BOVE5352_09_SE_C12.QXD 5/22/07 3:39 PM Page
383
384 PART 4 Supporting Messages with Quality Information
46053 C PHNJ B&E A B P N 384 C/M/Y/K DESIGN
SERVICES OF
To tie visuals to the text, introduce
them in the text and place them
near the points they illustrate.
disruption as possible. Successful integration involves four
decisions: maintaining a
balance between visuals and text, referring to visuals in the
text, placing the visuals in
the document, and writing titles and other descriptions.
Maintaining a Balance Between Illustrations and Words
Strong visuals enhance the descriptive and persuasive power of
your writing, but put-
ting too many visuals into a report can distract your readers. If
you’re constantly refer-
ring to tables, drawings, and other visual elements, the effort to
switch back and forth
from words to visuals can make it difficult for readers to
maintain focus on the thread
of your message. The space occupied by visuals can also disrupt
the flow of text on the
page or screen.
The pacing of visuals throughout the text is also an important
consideration. If
most of your visuals are bunched in one section of the report,
readers might spend
more time there and less time in the text-heavy sections.
Although it isn’t always possi-
ble to have perfect distribution throughout the report, try to
have a fairly even flow of
text and visuals from page to page or screen to screen.
As always, take your readers’ specific needs into account. If
you’re addressing an au-
dience with multiple language backgrounds or widely varying
reading skills, you can
shift the balance toward more visual elements to help get
around any language barri-
ers. The professional experience, education, and training of
your audience should in-
fluence your approach as well. For instance, detailed statistical
plots and mathematical
formulas are everyday reading material for quality-control
engineers but not for most
salespeople or top executives.
Referencing Visuals
Unless a visual element clearly stands on its own, as in the
sidebars you often see in mag-
azines, visuals should be clearly referred to by number in the
text of your report. Some re-
port writers refer to all visuals as “exhibits” and number them
consecutively throughout the
report; many others number tables and figures separately
(everything that isn’t a table is re-
garded as a figure). In a long report with numbered sections,
illustrations may have a dou-
ble number (separated by a period or a hyphen) representing the
section number and the
individual illustration number within that section. Whichever
scheme you use, make sure
it’s clear and easy to follow.
Help your readers understand the significance of visuals by
referring to them before
readers encounter them in the document or on the screen. The
following examples show
how you can make this connection in the text:
Figure 1 summarizes the financial history of the motorcycle
division over the past five years,
with sales broken into four categories.
Total sales were steady over this period, but the mix of sales by
category changed dramati-
cally (see Figure 2).
The underlying reason for the remarkable growth in our sales of
youth golf apparel is sug-
gested by Table 4, which shows the growing interest in junior
golf around the world.
When describing the data shown in your visuals, be sure to
emphasize the main point you
are trying to make. Don’t make the mistake of simply repeating
the data to be shown. Para-
graphs that do are guaranteed to put the reader to sleep:
Among women who replied to the survey, 17.4 percent earn less
than $5 per hour; 26.4 per-
cent earn $5 to $7; 25.7 percent, $8 to $12; 18.0 percent, $13 to
$24; 9.6 percent, $25 to $49;
and 2.9 percent, $50 and over.
The visual will (or at least should) provide all these details;
there is no need to repeat them
in the text. Instead, use round numbers that sum up the message:
Over two-thirds of the women who replied earn less than $12
per hour.
The use of color in visuals accelerates
learning, retention, and recall by 55
percent to 78 percent, and it increases
motivation and audience participation
up to 80 percent.
M13_BOVE5352_09_SE_C12.QXD 5/18/07 2:46 PM Page
384
7 L E A R N I N G O B J E C T I V E
List three criteria to review in
order to verify the quality of
your visuals
CHAPTER 12 Designing Visual Communication 385
46053 C PHNJ B&E A B P N 385 C/M/Y/K DESIGN
SERVICES OF
Place each visual as close as
possible to its in-text reference to
help readers understand the
illustration’s relevance and to
minimize the effort of reading.
Placing Visuals
Try to position your visuals so that your audience won’t have to
flip back and forth (in
printed documents) or scroll (on screen) between the visuals and
the text. Ideally, it’s best
to place each visual within, beside, or immediately after the
paragraph it illustrates so that
readers can consult the explanation and the visual at the same
time. This scheme works
well both in print and online. If at all possible, avoid bunching
visuals at the end of a sec-
tion or the end of a document; doing so asks a lot of the reader.
(Bunching is unavoidable
in some cases, such as when you have multiple visuals that ac-
company a single section of text.) Word-processing, desktop-
publishing, and web-design programs let you place graphical
elements virtually anywhere you wish, so take advantage of
this flexibility.
Writing Titles, Captions, and Legends
Titles and legends provide two more opportunities to connect
your visual and textual messages. A title is similar to a sub-
heading, providing a short description that identifies the con-
tent and purpose of the visual, along with whatever label and
number you’re using to refer to the visual. A caption usually
offers additional discussion of the visual’s content and can be
several sentences long if appropriate. Captions can also alert
readers that additional discussion is available in the accompa-
nying text. Titles usually appear above visuals and captions
appear below, but effective de-
signs can place these two elements in other positions.
Sometimes titles and captions are
combined in a single block of text as well. As with all design
decisions, be consistent
throughout your report or website. A legend helps readers
“decode” the visual by explain-
ing what various colors, symbols, or other design choices mean.
Legends aren’t necessary for
simple graphs, such as a line chart or bar chart with only a
series of data, but they are in-
valuable with more complex graphics.
By considering your word choices for all three of these textual
elements, you can help
readers link the visuals with the text and quickly grasp the most
important points of each
visual. Readers should be able to grasp the point of the visual
without digging into the sur-
rounding text. For instance, a title that says simply,
“Refineries” doesn’t say much at all. “Ac-
tive Petroleum Refineries in the United States” provides a much
better idea of what the chart
is all about. You may also want to use informative titles, rather
than basic descriptive titles.
A descriptive title simply identifies the topic of the illustration,
whereas an informative
title calls attention to the conclusion that ought to be drawn
from the data. Here’s an exam-
ple of the difference:
DESCRIPTIVE TITLE INFORMATIVE TITLE
Relationship Between Petroleum Demand Refinery Capacity
Declines as Petroleum
and Refinery Capacity in the United States Demand Continues
to Grow
Regardless of whether your titles and legends are informative or
descriptive, phrase
them consistently throughout the report.
Verifying the Quality of Your Visuals
Visuals have a particularly strong impact on your readers and
on their perceptions of you
and your work, so verifying their quality is vital. Take a few
extra minutes to make sure that
your visuals are absolutely accurate, properly documented, and
honest:
● Is the visual accurate? Be sure to check visuals for mistakes
such as typographical er-
rors, inconsistent color treatment, confusing or undocumented
symbols, and mis-
aligned elements. Also verify that information in visuals and
text matches. For data
presentations, particularly if you’re producing charts with a
spreadsheet, verify any
Descriptive titles simply identify
the topic of an illustration;
informative titles help the reader
understand the conclusion to be
drawn from the illustration.
D O C U M E N T M A K E OV E R
IMPROVE THIS REPORT SUMMARY AND VISUALS
To practice correcting drafts of actual documents, visit your
online course or the access-code-protected portion of the
Companion Website. Click “Document Makeovers,” then
click Chapter 12. You will find a competitive analysis report
summary that contains problems and errors relating to what
you’ve learned in this chapter about communicating infor-
mation through visuals. Use the Final Draft decision tool to
create an improved version of this summary. Check the mes-
sage for appropriate formatting of visuals and proper use of
text with visuals.
The title of a visual functions in the
same way as a subheading, whereas
the caption provides additional
detail if needed.
M13_BOVE5352_09_SE_C12.QXD 5/18/07 2:46 PM Page
385
386 PART 4 Supporting Messages with Quality Information
46053 C PHNJ B&E A B P N 386 C/M/Y/K DESIGN
SERVICES OF
✓ CHECKLIST: Creating Effective Visuals
• Emphasize visual consistency to connect parts of a
whole and minimize audience confusion.
• Avoid arbitrary changes of color, texture, typeface,
position, or scale.
• Highlight contrasting points through color, position,
and other design choices.
• Decide whether you want to achieve formal or
informal balance.
• Emphasize dominant elements and de-emphasize
less-important pieces in a design.
• Understand and follow (at least most of the time) the
visual conventions your audience expects.
• Strive for simplicity and clarity; don’t clutter your
visuals with meaningless decoration.
• Follow the guidelines for avoiding ethical lapses.
• Carefully consider your message, the nature of your
information, and your audience to choose which
points to illustrate.
• Select the proper types of graphics for the information
at hand and for the objective of the message.
• Be sure the visual contributes to overall
understanding of the subject.
• Understand how to use your software tools to
maximize effectiveness and efficiency.
• Integrate visuals and text by maintaining a balance
between illustrations and words, clearly referring to
visuals within the text, and placing visuals carefully.
• Use titles, captions, and legends to help readers
understand the meaning and importance of your
visuals.
• Verify the quality of your visuals by checking for
accuracy, proper documentation, and honesty.
formulas used to generate the numbers, and make sure you’ve
selected the right num-
bers for each chart. When you’re in a hurry, it’s easy to select
the wrong column of
numbers in a spreadsheet or the wrong set of numbers within a
column. For flow-
charts, organizational charts, diagrams, photos, and other
visuals, compare the visuals
you created with the visuals you had planned to create. Does
each visual deliver your
message accurately? Have you inserted the right photos, maps,
or other files?
● Is the visual properly documented? As with the textual
elements in your reports and
presentations, visuals based on other people’s research,
information, and ideas require
full citation. (Even if the graphical design is entirely yours, any
underlying information
taken from other sources needs to be documented.) Also, try to
anticipate any questions
or concerns your audience may have and address them with
additional information as
needed. For instance, if you’re presenting the results of survey
research, many readers
will want to know who participated in the survey, how many
people responded, and
when the questions were asked.You could answer these
questions with a note in the cap-
tion along the lines of “652 accountants, surveyed the week of
January 17.” Similarly, if
you found a visual in a secondary source, list that source on or
near the graphic to help
readers assess the information. Alternatively, you can list
sources in an appendix.
● Is the visual honest? As a final precaution, step back and
make sure your visuals com-
municate truthful messages. Make sure they don’t hide
information the audience needs,
imply conclusions that your information doesn’t support, or
play on audience emo-
tions in manipulative or coercive ways.
For a review of the important points to remember when creating
visuals, see “Check-
list: Creating Effective Visuals.”
Review each visual to make sure it
doesn’t intentionally or
unintentionally distort the
meaning of the underlying
information.
M13_BOVE5352_09_SE_C12.QXD 5/18/07 2:46 PM Page
386
CHAPTER 12 Designing Visual Communication 387
46053 C PHNJ B&E A B P N 38 C/M/Y/K DESIGN SERVICES
OF
COMMUNICATION CHALLENGES
AT STONE YAMASHITA PARTNERS
In Canada, the Tim Horton’s chain is famous for its
coffee and donuts. However, with over 2,600
shops, Tim’s has saturated the Canadian market
and is looking to grow in the United States, where it has just
over 300 shops. That growth won’t be easy: Tim’s faces
Dunkin’ Donuts, Krispy Kreme, and Starbucks in their home
territory.
Individual Challenge: Tim’s has hired SYP to help recruit
franchise owners for its southward expansion, and Keith
Yamashita is planning an event for the 100 most promising po-
tential franchisees. To help illustrate the business opportunity,
he has asked you to create compelling visuals for the follow-
ing items:
● Compare the size of several items at one time
● Show changes in one item over time
● Indicate the composition of several items over time
● The planned growth in the number of Tim’s outlets in
four U.S. regions (North, West, South, and East) over
the next 10 years
Decide what kind of visual to use for each item. Create ex-
ample visuals by making up any data you need.
Team Challenge: SYP often uses life-size mockups to help
people visualize new possibilities, such as the interior layout
of a Tim’s franchise. In a small group, brainstorm the layout
of a coffeehouse that you think would appeal to customers
on or near your college campus. Write a brief e-mail explain-
ing how you could “stage” a life-size mockup of your store
layout to help potential franchisors see what a Tim’s store is
like inside.
SUMMARY OF LEARNING OBJECTIVESSUMMARY OF
LEARNING OBJECTIVES
1 Describe the communication power of visuals. Visualsenhance
the communication impact of your writing and
in some cases even replace writing. First, visuals can con-
vey some types of information better than text can. Sec-
ond, visuals are an effective way to reach audiences of
diverse professional and cultural backgrounds. Third,
busy readers who may lack the time or inclination to read
your entire message often look to visuals to quickly grasp
the essence of what you’re trying to communicate.
2 Discuss six principles of graphic design that can im-prove the
quality of your visuals. When preparing vi-
suals, (1) use elements of design consistently so you don’t
confuse your audience; (2) use color and other elements
to show contrast effectively; (3) strive for a visual bal-
ance, either formal or informal, that creates a feel that is
appropriate for your overall message; (4) use design
choices to draw attention to key elements and to visually
downplay less important items; (5) understand and fol-
low design conventions that your audience expects (even
if the expectation is subconscious), although you can
consider unconventional design choices if they promise
to convey your message more effectively; and (6) strive
for simplicity in all your visuals, making design decisions
that enhance the reception and understanding of infor-
mation, rather than obscuring or confusing it.
3 Explain how to avoid ethical lapses when using
visuals.Communicators have the responsibility to avoid both
intentional and unintentional ethical lapses when us-
ing visual elements. They can work to avoid these
lapses by (1) considering all possible interpretations—
and misinterpretations—of their messages and avoiding
design choices that could lead to unwanted interpreta-
tions; (2) providing sufficient context, whether visual
or verbal, for audiences to understand the meaning and
significance of visuals; (3) not hiding or minimizing nega-
tive information that runs counter to their arguments;
(4) not exaggerating information that supports their argu-
ments; (5) not oversimplifying complex situations by hid-
ing complications that are relevant to the audience’s
understanding; (6) not implying cause-and-effect relation-
ships without providing proof that they exist; (7) avoiding
emotional manipulation or other forms of coercion;
and (8) being careful with the way they aggregate data.
4 Explain how to choose which points in your message
toillustrate. To decide which points to illustrate, first
step back and consider the overall flow of your message
from the audience’s point of view. Identify elements of
the message that might be complex, vulnerable to misin-
terpretation, or even dull. Look for connections between
ideas that should be highlighted or extensive collections
M13_BOVE5352_09_SE_C12.QXD 5/18/07 2:46 PM Page
387
388 PART 4 Supporting Messages with Quality Information
46053 C PHNJ B&E A B P N 388 C/M/Y/K DESIGN
SERVICES OF
of data and other discrete factual content that might be
difficult to read in textual format.
5 Describe the most common options for presentingdata in a
visual format. The visuals most commonly
used to present data include tables, line and surface
charts, bar charts, pictograms, Gantt charts, and pie
charts. You will probably use line, bar, and pie charts
most often in your business communication efforts.
6 Identify five guidelines for using photographs effec-tively.
First, consider whether a diagram would com-
municate more effectively than a photograph. Second,
learn how to use basic image-processing tools so that
you can crop, size, and perform other necessary tasks
with photos. Third, match the file to the application;
high-resolution photos are usually desirable for printed
documents but not for most online and electronic dis-
play applications. High-resolution images take up more
storage space and take longer to transmit electronically,
and the typical computer monitor can’t display all the
details in high-resolution photos. Fourth, make sure
every photo has communication value and isn’t just a
decoration or distraction. Fifth, be aware of copyrights
and model permissions.
7 List three criteria to review in order to verify the qual-ity of
your visuals. Make sure every visual you use is
accurate (there are no mistakes or missing information),
properly documented (the creator of any underlying data
used in the visual has been given complete credit), and
honest (the visual honestly reveals the real meaning of
the underlying data or information).
Test Your Knowledge
1. What type of visual would you use to compare one part
with a whole?
2. What type of visual would you use to present detailed, exact
values?
3. What type of visual would you use to compare one item
with another?
4. What type of visual would you use to illustrate trends over
time?
5. When are combination bar and line charts used?
6. For what purposes are Gantt charts used?
7. How does a flowchart differ from an organization chart?
8. When would you use a bubble diagram instead of a scatter
diagram?
9. What is the purpose of adding titles, captions, and legends
to visuals in reports?
10. How do you check a visual for quality?
Apply Your Knowledge
1. What similarities do you see between visuals and nonverbal
communication? Explain your answer.
2. You’re writing a report to the director of human resources
on implementing team-based management throughout
your company. You want to emphasize that since the new
approaches were implemented six months ago, absenteeism
and turnovers have been sharply reduced in all but two
departments. How do you visually present your data in the
most favorable light while still maintaining honest
communication? Explain.
3. Besides telling readers why an illustration is important, why
refer to it in the text of your document?
4. When you read a graph, how can you be sure that the visual
impression you are receiving is an accurate reflection of
reality? Please explain.
5. Ethical Choices What ethical issue is raised by the use of
technology to alter photographs in reports?
Practice Your Knowledge
Messages for Analysis
Message 12.A: Analyzing Pie Charts
Examine the pie charts in Figure 12.16 and point out any prob-
lems or errors you notice.
Message 12.B: Analyzing a Line Chart
Examine the line chart in Figure 12.17 and point out any prob-
lems or errors you notice.
Exercises
For active links to all websites discussed in this chapter, visit
this
text’s website at www.prenhall.com/bovee. Locate your book
and
click on its Companion Website link. Then select Chapter 12,
and
click on “Featured Websites.” Locate the name of the page or
the
URL related to the material in the text. Please note that links to
sites that become inactive after publication of the book will be
re-
moved from the Featured Websites section.
12.1 Improving Visual Design Find a communication example
that you believe could be improved by applying the visual
design principles you learned in this chapter. It can be
from any medium—a webpage, a magazine ad, a
promotional e-mail message, an illustration from a
report—anything that you can either copy or scan into a
word-processing file. With the image in your word
processor, annotate it with notes that identify visual
weaknesses and describe ways to fix those weaknesses. (In
Microsoft Word, for example, you can use the “AutoShapes
Callouts” feature to place notes wherever you’d like on the
page.) In a paragraph of accompanying text, explain why
you believe the message isn’t as effective as it could be and
how your suggestions would make it more effective.
12.2 Preparing Pie Charts As a market researcher for a
statewide chain of car dealerships, you’re examining car
M13_BOVE5352_09_SE_C12.QXD 5/18/07 2:46 PM Page
388
CHAPTER 12 Designing Visual Communication 389
46053 C PHNJ B&E A B P N 389 C/M/Y/K DESIGN
SERVICES OF
Individual
37%
Individual
50%
Group
29%
Group
44%
Credit
20%
Credit 5%
Industrial
14%
Industrial 1%
2005 2007
What Types of Life Insurance Policies Are in Effect?
FIGURE 12.16 Pie Charts for Analysis
and truck ownership and lease patterns among single
drivers in various age groups. By discovering which age
groups have the highest percentages of owners, you will
be better able to target advertising that promotes the
leasing option. Using the information that follows,
prepare a bar chart comparing the number of owners
with the number of leasers in each age category. Be sure to
label your chart, and include combined totals for owners
and leasees (“total drivers”). Then prepare a pie chart
showing the proportion of owners and leasers in the one
age group that you think holds the most promise for
leasing a new vehicle. Write a sentence that prepares your
company’s management for the information shown in the
pie chart.
1
0.9
0.8
0.7
0.6
0.5
0.4
0.3
0.2
0.1
0
Jan Feb Mar Apr May Jun Jul Aug Sep Oct Nov Dec
Mowers
Tractors
Snowblowers
Customer Satisfaction
FIGURE 12.17 Line Chart for Analysis
M13_BOVE5352_09_SE_C12.QXD 5/18/07 2:46 PM Page
389
390 PART 4 Supporting Messages with Quality Information
46053 C PHNJ B&E A B P N 390 C/M/Y/K DESIGN
SERVICES OF
Number of Owners Number of Leasees
Age Group (in Thousands) (in Thousands)
18–24 1,830 795
25–29 1,812 1,483
30–34 1,683 1,413
35–44 1,303 1,932
45–54 1,211 1,894
46053 C PHNJ B&E A B P N 360 CMYK DESIGN SERVICES OF360.docx

More Related Content

Similar to 46053 C PHNJ B&E A B P N 360 CMYK DESIGN SERVICES OF360.docx

BEST GRAPHIC & VIDEO DESIGN SERVICES IN UAE
BEST GRAPHIC & VIDEO DESIGN SERVICES IN UAEBEST GRAPHIC & VIDEO DESIGN SERVICES IN UAE
BEST GRAPHIC & VIDEO DESIGN SERVICES IN UAEasiyahanif9977
 
Business communication today-_Bovée, Courtland L._ Thill, John V. -Pearson E...
Business communication today-_Bovée, Courtland  L._ Thill, John V. -Pearson E...Business communication today-_Bovée, Courtland  L._ Thill, John V. -Pearson E...
Business communication today-_Bovée, Courtland L._ Thill, John V. -Pearson E...AakashBhalla2
 
Portfolio Dave.Morehouse 7.25.11
Portfolio Dave.Morehouse 7.25.11Portfolio Dave.Morehouse 7.25.11
Portfolio Dave.Morehouse 7.25.11davemorehouse
 
Data Visualization & Why it is Important in Your Business
Data Visualization & Why it is Important in Your BusinessData Visualization & Why it is Important in Your Business
Data Visualization & Why it is Important in Your BusinessDigital Dialogue
 
VDIS10015 Presenting a body of work - Lecture 5
VDIS10015 Presenting a body of work - Lecture 5VDIS10015 Presenting a body of work - Lecture 5
VDIS10015 Presenting a body of work - Lecture 5Virtu Institute
 
Designing Visual Communication
Designing Visual CommunicationDesigning Visual Communication
Designing Visual CommunicationSuman Subedi
 
Project that grow your online presence now - Directions Supplement - july aug...
Project that grow your online presence now - Directions Supplement - july aug...Project that grow your online presence now - Directions Supplement - july aug...
Project that grow your online presence now - Directions Supplement - july aug...salterbaxter
 
_Unlocking the Power of Graphic Design_ Tips for Creating Effective Designs_.pdf
_Unlocking the Power of Graphic Design_ Tips for Creating Effective Designs_.pdf_Unlocking the Power of Graphic Design_ Tips for Creating Effective Designs_.pdf
_Unlocking the Power of Graphic Design_ Tips for Creating Effective Designs_.pdfdeepak gholap
 
Best_Practice_Digital_Signage_Content
Best_Practice_Digital_Signage_ContentBest_Practice_Digital_Signage_Content
Best_Practice_Digital_Signage_ContentGreg Weaver
 
Clique API Whitepaper
Clique API WhitepaperClique API Whitepaper
Clique API WhitepaperCliqueAPI
 
Functional Design Lab
Functional Design LabFunctional Design Lab
Functional Design LabiFactory
 
Web Design and Software Development
Web Design and Software DevelopmentWeb Design and Software Development
Web Design and Software DevelopmentAthena Inc, Goa
 
Creative Energy Agency - Our Work & Innovative Process
Creative Energy Agency - Our Work & Innovative ProcessCreative Energy Agency - Our Work & Innovative Process
Creative Energy Agency - Our Work & Innovative ProcessDavin Skonberg
 
Quick guide around Presentation Software
Quick guide around Presentation SoftwareQuick guide around Presentation Software
Quick guide around Presentation Softwareshital deshmukh
 
Government Agencies: Craft Winning Proposals with a Presentation Design agency
Government Agencies: Craft Winning Proposals with a Presentation Design agencyGovernment Agencies: Craft Winning Proposals with a Presentation Design agency
Government Agencies: Craft Winning Proposals with a Presentation Design agencyEZ
 
Jeremy Dixon portfolio 2013
Jeremy Dixon portfolio 2013Jeremy Dixon portfolio 2013
Jeremy Dixon portfolio 2013ukcats
 
Interactive Data Visualization.pptx
Interactive Data Visualization.pptxInteractive Data Visualization.pptx
Interactive Data Visualization.pptxavikeeli
 

Similar to 46053 C PHNJ B&E A B P N 360 CMYK DESIGN SERVICES OF360.docx (20)

BEST GRAPHIC & VIDEO DESIGN SERVICES IN UAE
BEST GRAPHIC & VIDEO DESIGN SERVICES IN UAEBEST GRAPHIC & VIDEO DESIGN SERVICES IN UAE
BEST GRAPHIC & VIDEO DESIGN SERVICES IN UAE
 
Business communication today-_Bovée, Courtland L._ Thill, John V. -Pearson E...
Business communication today-_Bovée, Courtland  L._ Thill, John V. -Pearson E...Business communication today-_Bovée, Courtland  L._ Thill, John V. -Pearson E...
Business communication today-_Bovée, Courtland L._ Thill, John V. -Pearson E...
 
Portfolio Dave.Morehouse 7.25.11
Portfolio Dave.Morehouse 7.25.11Portfolio Dave.Morehouse 7.25.11
Portfolio Dave.Morehouse 7.25.11
 
Data Visualization & Why it is Important in Your Business
Data Visualization & Why it is Important in Your BusinessData Visualization & Why it is Important in Your Business
Data Visualization & Why it is Important in Your Business
 
VDIS10015 Presenting a body of work - Lecture 5
VDIS10015 Presenting a body of work - Lecture 5VDIS10015 Presenting a body of work - Lecture 5
VDIS10015 Presenting a body of work - Lecture 5
 
2016 Conduit Program
2016 Conduit Program2016 Conduit Program
2016 Conduit Program
 
Designing Visual Communication
Designing Visual CommunicationDesigning Visual Communication
Designing Visual Communication
 
Project that grow your online presence now - Directions Supplement - july aug...
Project that grow your online presence now - Directions Supplement - july aug...Project that grow your online presence now - Directions Supplement - july aug...
Project that grow your online presence now - Directions Supplement - july aug...
 
_Unlocking the Power of Graphic Design_ Tips for Creating Effective Designs_.pdf
_Unlocking the Power of Graphic Design_ Tips for Creating Effective Designs_.pdf_Unlocking the Power of Graphic Design_ Tips for Creating Effective Designs_.pdf
_Unlocking the Power of Graphic Design_ Tips for Creating Effective Designs_.pdf
 
Best_Practice_Digital_Signage_Content
Best_Practice_Digital_Signage_ContentBest_Practice_Digital_Signage_Content
Best_Practice_Digital_Signage_Content
 
Clique API Whitepaper
Clique API WhitepaperClique API Whitepaper
Clique API Whitepaper
 
Clique API
Clique APIClique API
Clique API
 
Functional Design Lab
Functional Design LabFunctional Design Lab
Functional Design Lab
 
2013 Mid Atlantic Conference Program
2013 Mid Atlantic Conference Program2013 Mid Atlantic Conference Program
2013 Mid Atlantic Conference Program
 
Web Design and Software Development
Web Design and Software DevelopmentWeb Design and Software Development
Web Design and Software Development
 
Creative Energy Agency - Our Work & Innovative Process
Creative Energy Agency - Our Work & Innovative ProcessCreative Energy Agency - Our Work & Innovative Process
Creative Energy Agency - Our Work & Innovative Process
 
Quick guide around Presentation Software
Quick guide around Presentation SoftwareQuick guide around Presentation Software
Quick guide around Presentation Software
 
Government Agencies: Craft Winning Proposals with a Presentation Design agency
Government Agencies: Craft Winning Proposals with a Presentation Design agencyGovernment Agencies: Craft Winning Proposals with a Presentation Design agency
Government Agencies: Craft Winning Proposals with a Presentation Design agency
 
Jeremy Dixon portfolio 2013
Jeremy Dixon portfolio 2013Jeremy Dixon portfolio 2013
Jeremy Dixon portfolio 2013
 
Interactive Data Visualization.pptx
Interactive Data Visualization.pptxInteractive Data Visualization.pptx
Interactive Data Visualization.pptx
 

More from gilbertkpeters11344

Group Presentation Once during the quarter, each student will.docx
Group Presentation Once during the quarter, each student will.docxGroup Presentation Once during the quarter, each student will.docx
Group Presentation Once during the quarter, each student will.docxgilbertkpeters11344
 
Group Presentation Outline•Slide 1 Title slide•.docx
Group Presentation Outline•Slide 1 Title slide•.docxGroup Presentation Outline•Slide 1 Title slide•.docx
Group Presentation Outline•Slide 1 Title slide•.docxgilbertkpeters11344
 
Group PortionAs a group, discuss and develop a paper of 10 p.docx
Group PortionAs a group, discuss and develop a paper of 10 p.docxGroup PortionAs a group, discuss and develop a paper of 10 p.docx
Group PortionAs a group, discuss and develop a paper of 10 p.docxgilbertkpeters11344
 
Group Behavior in OrganizationsAt an organizational level,.docx
Group Behavior in OrganizationsAt an organizational level,.docxGroup Behavior in OrganizationsAt an organizational level,.docx
Group Behavior in OrganizationsAt an organizational level,.docxgilbertkpeters11344
 
Group assignment Only responsible for writing 275 words on the foll.docx
Group assignment Only responsible for writing 275 words on the foll.docxGroup assignment Only responsible for writing 275 words on the foll.docx
Group assignment Only responsible for writing 275 words on the foll.docxgilbertkpeters11344
 
Group 2 WG is a 41-year-old female brought herself into the ER la.docx
Group 2 WG is a 41-year-old female brought herself into the ER la.docxGroup 2 WG is a 41-year-old female brought herself into the ER la.docx
Group 2 WG is a 41-year-old female brought herself into the ER la.docxgilbertkpeters11344
 
Group 2 Discuss the limitations of treatment for borderline and.docx
Group 2 Discuss the limitations of treatment for borderline and.docxGroup 2 Discuss the limitations of treatment for borderline and.docx
Group 2 Discuss the limitations of treatment for borderline and.docxgilbertkpeters11344
 
Group 3 Discuss the limitations of treatment for antisocial and.docx
Group 3 Discuss the limitations of treatment for antisocial and.docxGroup 3 Discuss the limitations of treatment for antisocial and.docx
Group 3 Discuss the limitations of treatment for antisocial and.docxgilbertkpeters11344
 
Group 1 Describe the differences between Naloxone, Naltrexone, .docx
Group 1 Describe the differences between Naloxone, Naltrexone, .docxGroup 1 Describe the differences between Naloxone, Naltrexone, .docx
Group 1 Describe the differences between Naloxone, Naltrexone, .docxgilbertkpeters11344
 
Grotius, HobbesDevelopment of INR – Week 3HobbesRelati.docx
Grotius, HobbesDevelopment of INR – Week 3HobbesRelati.docxGrotius, HobbesDevelopment of INR – Week 3HobbesRelati.docx
Grotius, HobbesDevelopment of INR – Week 3HobbesRelati.docxgilbertkpeters11344
 
GROUP 1 Case 967-- A Teenage Female with an Ovarian MassCLI.docx
GROUP 1 Case 967-- A Teenage Female with an Ovarian MassCLI.docxGROUP 1 Case 967-- A Teenage Female with an Ovarian MassCLI.docx
GROUP 1 Case 967-- A Teenage Female with an Ovarian MassCLI.docxgilbertkpeters11344
 
Greek Drama Further Readings and Short Report GuidelinesOur s.docx
Greek Drama  Further  Readings and Short Report GuidelinesOur s.docxGreek Drama  Further  Readings and Short Report GuidelinesOur s.docx
Greek Drama Further Readings and Short Report GuidelinesOur s.docxgilbertkpeters11344
 
Graph 4 (You must select a different graph than one that you hav.docx
Graph 4 (You must select a different graph than one that you hav.docxGraph 4 (You must select a different graph than one that you hav.docx
Graph 4 (You must select a different graph than one that you hav.docxgilbertkpeters11344
 
Graphs (Help! Really challenging assignment. Would appreciate any bi.docx
Graphs (Help! Really challenging assignment. Would appreciate any bi.docxGraphs (Help! Really challenging assignment. Would appreciate any bi.docx
Graphs (Help! Really challenging assignment. Would appreciate any bi.docxgilbertkpeters11344
 
Grandparenting can be highly rewarding. Many grandparents, though, u.docx
Grandparenting can be highly rewarding. Many grandparents, though, u.docxGrandparenting can be highly rewarding. Many grandparents, though, u.docx
Grandparenting can be highly rewarding. Many grandparents, though, u.docxgilbertkpeters11344
 
Great Marketing Moves The evolving art of getting noticed Ov.docx
Great Marketing Moves The evolving art of getting noticed Ov.docxGreat Marketing Moves The evolving art of getting noticed Ov.docx
Great Marketing Moves The evolving art of getting noticed Ov.docxgilbertkpeters11344
 
GREAT MIGRATION”Dr. G. J. Giddings.docx
GREAT MIGRATION”Dr. G. J. Giddings.docxGREAT MIGRATION”Dr. G. J. Giddings.docx
GREAT MIGRATION”Dr. G. J. Giddings.docxgilbertkpeters11344
 
Grand theory and Middle-range theoryHow are Nursing Theories c.docx
Grand theory and Middle-range theoryHow are Nursing Theories c.docxGrand theory and Middle-range theoryHow are Nursing Theories c.docx
Grand theory and Middle-range theoryHow are Nursing Theories c.docxgilbertkpeters11344
 
Grand Rounds Hi, and thanks for attending this case presen.docx
Grand Rounds Hi, and thanks for attending this case presen.docxGrand Rounds Hi, and thanks for attending this case presen.docx
Grand Rounds Hi, and thanks for attending this case presen.docxgilbertkpeters11344
 
Graduate Level Writing Required.DUEFriday, February 1.docx
Graduate Level Writing Required.DUEFriday, February 1.docxGraduate Level Writing Required.DUEFriday, February 1.docx
Graduate Level Writing Required.DUEFriday, February 1.docxgilbertkpeters11344
 

More from gilbertkpeters11344 (20)

Group Presentation Once during the quarter, each student will.docx
Group Presentation Once during the quarter, each student will.docxGroup Presentation Once during the quarter, each student will.docx
Group Presentation Once during the quarter, each student will.docx
 
Group Presentation Outline•Slide 1 Title slide•.docx
Group Presentation Outline•Slide 1 Title slide•.docxGroup Presentation Outline•Slide 1 Title slide•.docx
Group Presentation Outline•Slide 1 Title slide•.docx
 
Group PortionAs a group, discuss and develop a paper of 10 p.docx
Group PortionAs a group, discuss and develop a paper of 10 p.docxGroup PortionAs a group, discuss and develop a paper of 10 p.docx
Group PortionAs a group, discuss and develop a paper of 10 p.docx
 
Group Behavior in OrganizationsAt an organizational level,.docx
Group Behavior in OrganizationsAt an organizational level,.docxGroup Behavior in OrganizationsAt an organizational level,.docx
Group Behavior in OrganizationsAt an organizational level,.docx
 
Group assignment Only responsible for writing 275 words on the foll.docx
Group assignment Only responsible for writing 275 words on the foll.docxGroup assignment Only responsible for writing 275 words on the foll.docx
Group assignment Only responsible for writing 275 words on the foll.docx
 
Group 2 WG is a 41-year-old female brought herself into the ER la.docx
Group 2 WG is a 41-year-old female brought herself into the ER la.docxGroup 2 WG is a 41-year-old female brought herself into the ER la.docx
Group 2 WG is a 41-year-old female brought herself into the ER la.docx
 
Group 2 Discuss the limitations of treatment for borderline and.docx
Group 2 Discuss the limitations of treatment for borderline and.docxGroup 2 Discuss the limitations of treatment for borderline and.docx
Group 2 Discuss the limitations of treatment for borderline and.docx
 
Group 3 Discuss the limitations of treatment for antisocial and.docx
Group 3 Discuss the limitations of treatment for antisocial and.docxGroup 3 Discuss the limitations of treatment for antisocial and.docx
Group 3 Discuss the limitations of treatment for antisocial and.docx
 
Group 1 Describe the differences between Naloxone, Naltrexone, .docx
Group 1 Describe the differences between Naloxone, Naltrexone, .docxGroup 1 Describe the differences between Naloxone, Naltrexone, .docx
Group 1 Describe the differences between Naloxone, Naltrexone, .docx
 
Grotius, HobbesDevelopment of INR – Week 3HobbesRelati.docx
Grotius, HobbesDevelopment of INR – Week 3HobbesRelati.docxGrotius, HobbesDevelopment of INR – Week 3HobbesRelati.docx
Grotius, HobbesDevelopment of INR – Week 3HobbesRelati.docx
 
GROUP 1 Case 967-- A Teenage Female with an Ovarian MassCLI.docx
GROUP 1 Case 967-- A Teenage Female with an Ovarian MassCLI.docxGROUP 1 Case 967-- A Teenage Female with an Ovarian MassCLI.docx
GROUP 1 Case 967-- A Teenage Female with an Ovarian MassCLI.docx
 
Greek Drama Further Readings and Short Report GuidelinesOur s.docx
Greek Drama  Further  Readings and Short Report GuidelinesOur s.docxGreek Drama  Further  Readings and Short Report GuidelinesOur s.docx
Greek Drama Further Readings and Short Report GuidelinesOur s.docx
 
Graph 4 (You must select a different graph than one that you hav.docx
Graph 4 (You must select a different graph than one that you hav.docxGraph 4 (You must select a different graph than one that you hav.docx
Graph 4 (You must select a different graph than one that you hav.docx
 
Graphs (Help! Really challenging assignment. Would appreciate any bi.docx
Graphs (Help! Really challenging assignment. Would appreciate any bi.docxGraphs (Help! Really challenging assignment. Would appreciate any bi.docx
Graphs (Help! Really challenging assignment. Would appreciate any bi.docx
 
Grandparenting can be highly rewarding. Many grandparents, though, u.docx
Grandparenting can be highly rewarding. Many grandparents, though, u.docxGrandparenting can be highly rewarding. Many grandparents, though, u.docx
Grandparenting can be highly rewarding. Many grandparents, though, u.docx
 
Great Marketing Moves The evolving art of getting noticed Ov.docx
Great Marketing Moves The evolving art of getting noticed Ov.docxGreat Marketing Moves The evolving art of getting noticed Ov.docx
Great Marketing Moves The evolving art of getting noticed Ov.docx
 
GREAT MIGRATION”Dr. G. J. Giddings.docx
GREAT MIGRATION”Dr. G. J. Giddings.docxGREAT MIGRATION”Dr. G. J. Giddings.docx
GREAT MIGRATION”Dr. G. J. Giddings.docx
 
Grand theory and Middle-range theoryHow are Nursing Theories c.docx
Grand theory and Middle-range theoryHow are Nursing Theories c.docxGrand theory and Middle-range theoryHow are Nursing Theories c.docx
Grand theory and Middle-range theoryHow are Nursing Theories c.docx
 
Grand Rounds Hi, and thanks for attending this case presen.docx
Grand Rounds Hi, and thanks for attending this case presen.docxGrand Rounds Hi, and thanks for attending this case presen.docx
Grand Rounds Hi, and thanks for attending this case presen.docx
 
Graduate Level Writing Required.DUEFriday, February 1.docx
Graduate Level Writing Required.DUEFriday, February 1.docxGraduate Level Writing Required.DUEFriday, February 1.docx
Graduate Level Writing Required.DUEFriday, February 1.docx
 

Recently uploaded

Painted Grey Ware.pptx, PGW Culture of India
Painted Grey Ware.pptx, PGW Culture of IndiaPainted Grey Ware.pptx, PGW Culture of India
Painted Grey Ware.pptx, PGW Culture of IndiaVirag Sontakke
 
Pharmacognosy Flower 3. Compositae 2023.pdf
Pharmacognosy Flower 3. Compositae 2023.pdfPharmacognosy Flower 3. Compositae 2023.pdf
Pharmacognosy Flower 3. Compositae 2023.pdfMahmoud M. Sallam
 
Paris 2024 Olympic Geographies - an activity
Paris 2024 Olympic Geographies - an activityParis 2024 Olympic Geographies - an activity
Paris 2024 Olympic Geographies - an activityGeoBlogs
 
Incoming and Outgoing Shipments in 1 STEP Using Odoo 17
Incoming and Outgoing Shipments in 1 STEP Using Odoo 17Incoming and Outgoing Shipments in 1 STEP Using Odoo 17
Incoming and Outgoing Shipments in 1 STEP Using Odoo 17Celine George
 
Computed Fields and api Depends in the Odoo 17
Computed Fields and api Depends in the Odoo 17Computed Fields and api Depends in the Odoo 17
Computed Fields and api Depends in the Odoo 17Celine George
 
Science lesson Moon for 4th quarter lesson
Science lesson Moon for 4th quarter lessonScience lesson Moon for 4th quarter lesson
Science lesson Moon for 4th quarter lessonJericReyAuditor
 
Science 7 - LAND and SEA BREEZE and its Characteristics
Science 7 - LAND and SEA BREEZE and its CharacteristicsScience 7 - LAND and SEA BREEZE and its Characteristics
Science 7 - LAND and SEA BREEZE and its CharacteristicsKarinaGenton
 
BASLIQ CURRENT LOOKBOOK LOOKBOOK(1) (1).pdf
BASLIQ CURRENT LOOKBOOK  LOOKBOOK(1) (1).pdfBASLIQ CURRENT LOOKBOOK  LOOKBOOK(1) (1).pdf
BASLIQ CURRENT LOOKBOOK LOOKBOOK(1) (1).pdfSoniaTolstoy
 
Alper Gobel In Media Res Media Component
Alper Gobel In Media Res Media ComponentAlper Gobel In Media Res Media Component
Alper Gobel In Media Res Media ComponentInMediaRes1
 
The Most Excellent Way | 1 Corinthians 13
The Most Excellent Way | 1 Corinthians 13The Most Excellent Way | 1 Corinthians 13
The Most Excellent Way | 1 Corinthians 13Steve Thomason
 
Presiding Officer Training module 2024 lok sabha elections
Presiding Officer Training module 2024 lok sabha electionsPresiding Officer Training module 2024 lok sabha elections
Presiding Officer Training module 2024 lok sabha electionsanshu789521
 
History Class XII Ch. 3 Kinship, Caste and Class (1).pptx
History Class XII Ch. 3 Kinship, Caste and Class (1).pptxHistory Class XII Ch. 3 Kinship, Caste and Class (1).pptx
History Class XII Ch. 3 Kinship, Caste and Class (1).pptxsocialsciencegdgrohi
 
call girls in Kamla Market (DELHI) 🔝 >༒9953330565🔝 genuine Escort Service 🔝✔️✔️
call girls in Kamla Market (DELHI) 🔝 >༒9953330565🔝 genuine Escort Service 🔝✔️✔️call girls in Kamla Market (DELHI) 🔝 >༒9953330565🔝 genuine Escort Service 🔝✔️✔️
call girls in Kamla Market (DELHI) 🔝 >༒9953330565🔝 genuine Escort Service 🔝✔️✔️9953056974 Low Rate Call Girls In Saket, Delhi NCR
 
Crayon Activity Handout For the Crayon A
Crayon Activity Handout For the Crayon ACrayon Activity Handout For the Crayon A
Crayon Activity Handout For the Crayon AUnboundStockton
 
How to Make a Pirate ship Primary Education.pptx
How to Make a Pirate ship Primary Education.pptxHow to Make a Pirate ship Primary Education.pptx
How to Make a Pirate ship Primary Education.pptxmanuelaromero2013
 
Class 11 Legal Studies Ch-1 Concept of State .pdf
Class 11 Legal Studies Ch-1 Concept of State .pdfClass 11 Legal Studies Ch-1 Concept of State .pdf
Class 11 Legal Studies Ch-1 Concept of State .pdfakmcokerachita
 
How to Configure Email Server in Odoo 17
How to Configure Email Server in Odoo 17How to Configure Email Server in Odoo 17
How to Configure Email Server in Odoo 17Celine George
 
A Critique of the Proposed National Education Policy Reform
A Critique of the Proposed National Education Policy ReformA Critique of the Proposed National Education Policy Reform
A Critique of the Proposed National Education Policy ReformChameera Dedduwage
 
Organic Name Reactions for the students and aspirants of Chemistry12th.pptx
Organic Name Reactions  for the students and aspirants of Chemistry12th.pptxOrganic Name Reactions  for the students and aspirants of Chemistry12th.pptx
Organic Name Reactions for the students and aspirants of Chemistry12th.pptxVS Mahajan Coaching Centre
 
_Math 4-Q4 Week 5.pptx Steps in Collecting Data
_Math 4-Q4 Week 5.pptx Steps in Collecting Data_Math 4-Q4 Week 5.pptx Steps in Collecting Data
_Math 4-Q4 Week 5.pptx Steps in Collecting DataJhengPantaleon
 

Recently uploaded (20)

Painted Grey Ware.pptx, PGW Culture of India
Painted Grey Ware.pptx, PGW Culture of IndiaPainted Grey Ware.pptx, PGW Culture of India
Painted Grey Ware.pptx, PGW Culture of India
 
Pharmacognosy Flower 3. Compositae 2023.pdf
Pharmacognosy Flower 3. Compositae 2023.pdfPharmacognosy Flower 3. Compositae 2023.pdf
Pharmacognosy Flower 3. Compositae 2023.pdf
 
Paris 2024 Olympic Geographies - an activity
Paris 2024 Olympic Geographies - an activityParis 2024 Olympic Geographies - an activity
Paris 2024 Olympic Geographies - an activity
 
Incoming and Outgoing Shipments in 1 STEP Using Odoo 17
Incoming and Outgoing Shipments in 1 STEP Using Odoo 17Incoming and Outgoing Shipments in 1 STEP Using Odoo 17
Incoming and Outgoing Shipments in 1 STEP Using Odoo 17
 
Computed Fields and api Depends in the Odoo 17
Computed Fields and api Depends in the Odoo 17Computed Fields and api Depends in the Odoo 17
Computed Fields and api Depends in the Odoo 17
 
Science lesson Moon for 4th quarter lesson
Science lesson Moon for 4th quarter lessonScience lesson Moon for 4th quarter lesson
Science lesson Moon for 4th quarter lesson
 
Science 7 - LAND and SEA BREEZE and its Characteristics
Science 7 - LAND and SEA BREEZE and its CharacteristicsScience 7 - LAND and SEA BREEZE and its Characteristics
Science 7 - LAND and SEA BREEZE and its Characteristics
 
BASLIQ CURRENT LOOKBOOK LOOKBOOK(1) (1).pdf
BASLIQ CURRENT LOOKBOOK  LOOKBOOK(1) (1).pdfBASLIQ CURRENT LOOKBOOK  LOOKBOOK(1) (1).pdf
BASLIQ CURRENT LOOKBOOK LOOKBOOK(1) (1).pdf
 
Alper Gobel In Media Res Media Component
Alper Gobel In Media Res Media ComponentAlper Gobel In Media Res Media Component
Alper Gobel In Media Res Media Component
 
The Most Excellent Way | 1 Corinthians 13
The Most Excellent Way | 1 Corinthians 13The Most Excellent Way | 1 Corinthians 13
The Most Excellent Way | 1 Corinthians 13
 
Presiding Officer Training module 2024 lok sabha elections
Presiding Officer Training module 2024 lok sabha electionsPresiding Officer Training module 2024 lok sabha elections
Presiding Officer Training module 2024 lok sabha elections
 
History Class XII Ch. 3 Kinship, Caste and Class (1).pptx
History Class XII Ch. 3 Kinship, Caste and Class (1).pptxHistory Class XII Ch. 3 Kinship, Caste and Class (1).pptx
History Class XII Ch. 3 Kinship, Caste and Class (1).pptx
 
call girls in Kamla Market (DELHI) 🔝 >༒9953330565🔝 genuine Escort Service 🔝✔️✔️
call girls in Kamla Market (DELHI) 🔝 >༒9953330565🔝 genuine Escort Service 🔝✔️✔️call girls in Kamla Market (DELHI) 🔝 >༒9953330565🔝 genuine Escort Service 🔝✔️✔️
call girls in Kamla Market (DELHI) 🔝 >༒9953330565🔝 genuine Escort Service 🔝✔️✔️
 
Crayon Activity Handout For the Crayon A
Crayon Activity Handout For the Crayon ACrayon Activity Handout For the Crayon A
Crayon Activity Handout For the Crayon A
 
How to Make a Pirate ship Primary Education.pptx
How to Make a Pirate ship Primary Education.pptxHow to Make a Pirate ship Primary Education.pptx
How to Make a Pirate ship Primary Education.pptx
 
Class 11 Legal Studies Ch-1 Concept of State .pdf
Class 11 Legal Studies Ch-1 Concept of State .pdfClass 11 Legal Studies Ch-1 Concept of State .pdf
Class 11 Legal Studies Ch-1 Concept of State .pdf
 
How to Configure Email Server in Odoo 17
How to Configure Email Server in Odoo 17How to Configure Email Server in Odoo 17
How to Configure Email Server in Odoo 17
 
A Critique of the Proposed National Education Policy Reform
A Critique of the Proposed National Education Policy ReformA Critique of the Proposed National Education Policy Reform
A Critique of the Proposed National Education Policy Reform
 
Organic Name Reactions for the students and aspirants of Chemistry12th.pptx
Organic Name Reactions  for the students and aspirants of Chemistry12th.pptxOrganic Name Reactions  for the students and aspirants of Chemistry12th.pptx
Organic Name Reactions for the students and aspirants of Chemistry12th.pptx
 
_Math 4-Q4 Week 5.pptx Steps in Collecting Data
_Math 4-Q4 Week 5.pptx Steps in Collecting Data_Math 4-Q4 Week 5.pptx Steps in Collecting Data
_Math 4-Q4 Week 5.pptx Steps in Collecting Data
 

46053 C PHNJ B&E A B P N 360 CMYK DESIGN SERVICES OF360.docx

  • 1. 46053 C PHNJ B&E A B P N 360 C/M/Y/K DESIGN SERVICES OF 360 M13_BOVE5352_09_SE_C12.QXD 5/18/07 2:46 PM Page 360 46053 C PHNJ B&E A B P N 361 C/M/Y/K DESIGN SERVICES OF CHAPTER 12 Designing Visual Communication LEARNING OBJECTIVES After studying this chapter, you will be able to 1 Describe the communication power of visuals 2 Discuss six principles of graphic design thatcan improve the quality of your visuals 3 Explain how to avoid ethical lapses when usingvisuals 4 Explain how to choose which points in yourmessage to illustrate 5 Describe the most common options forpresenting data in a visual format 6 Identify five guidelines for using photographseffectively 7 List three criteria to review in order to verifythe quality of your visuals
  • 2. COMMUNICATION CLOSE-UP AT STONE YAMASHITA PARTNERS www.stoneyamashita.com Keith Yamashita doesn’t look or act like the stereo- typical business consultant, but that hasn’t stopped him from developing enthusiastic fans among top executives at IBM, Mercedes-Benz, Nike, General Electric, and other firms who have worked with his com- pany, Stone Yamashita Partners (SYP). Yamashita and designer Robert Stone started SYP in 1994, after working together at Apple Computer. Gradually, they assembled a diverse team that includes designers, writers, technologists, a poet, a sociologist, and a former lawyer—but very few MBAs. This eclectic group specializes in helping companies examine, revamp, and sometimes reinvent their vision and mission, business strategy, image, and company culture. That kind of fundamental change affects everyone in a company, from the most senior executive to the newest hire. People tend to resist change, at least initially, but communi- cation that is effective and compelling can help turn such re- sistance into commitment. Communication is SYP’s specialty, but Yamashita’s team never relies on words alone. Instead, it uses strong vi- sual elements to paint a picture—sometimes literally—of a company’s new direction. Everything it produces is full of compelling visual cues, whether it’s a short video, an inter- active website, a pocket-size book, a giant story scroll, or a full-size store mockup. Highly visual content and offbeat
  • 3. Compelling visual messages are critical to the success of consulting partners Keith Yamashita and Robert Stone. M13_BOVE5352_09_SE_C12.QXD 5/18/07 2:46 PM Page 361 1 L E A R N I N G O B J E C T I V E Describe the communication power of visuals 362 PART 4 Supporting Messages with Quality Information 46053 C PHNJ B&E A B P N 362 C/M/Y/K DESIGN SERVICES OF UNDERSTANDING VISUAL COMMUNICATION Project teams from Stone Yamashita Partners (profiled in the chapter-opening “Communica- tion Close-Up) look for new ways to connect and explore business ideas through creative visuals, often helping clients see important concepts and relationships that weren’t obvious using textual communication alone. Although the primary focus of this course is written mes- sages, visual communication has become an important skill for today’s business profession- als and managers. This chapter helps you appreciate the power of images and the visual evolution of business communication. It then explains how to identify which points in your messages to illustrate; how to select the best visual for each of those points; and how to create effective visuals in any media, from memos to reports to
  • 4. webpages to electronic presentations. The Power of Images Well-designed visual elements can enhance the communication power of textual messages and, in some instances, even replace textual messages. Visuals can often convey some mes- sage points (such as spatial relationships, correlations, procedures, and emotions) more ef- fectively and more efficiently than words. Generally speaking, in a given amount of time, well-designed images can convey much more information than text.2 In the numbers- oriented world of work, people rely heavily on trend lines, distribution curves, and visual presentations of numerical quantities. Visuals attract and hold people’s attention, helping your audience understand and remember your message. Busy readers often jump to visuals to try to get the gist of a message, and attractive visuals can draw readers deeper into your reports and presentations. Pictures are also an effective way to communicate with the di- verse audiences that are common in today’s business environment. In addition to their direct information value, visuals often convey connotative mean- ing as well. As you read in Chapter 5, many words and phrases carry connotative meanings, which are all the mental images, emotions, and other impressions that the word or phrase evokes in audience members. A significant part of the power— and risk—of visual elements derives from their connotative meanings as well. Even something as simple as a watermark
  • 5. symbol embedded in letterhead stationery can boost reader confidence in whatever mes- sage is printed on the paper.3 Many colors, shapes, and other design elements have visual symbolism; and their symbolic, connotative meaning can evolve over time and mean dif- ferent things in different cultures (see Figure 12.1). Being aware of these symbolic mean- Like words, visuals often carry connotative or symbolic meanings. FIGURE 12.1 Visual Symbolism A red cross (with equal-length arms) on a white background is the well-known symbol of the Red Cross relief organization. It is also used to indicate the medical branches of many nations’ military services. The red cross symbol is based on the flag of Switzerland (where the first Red Cross organization was formed), which over the course of hundreds of years developed from battle flags that originally used the Christian cross symbol. Although the Red Cross emblem is not based directly on the Christian symbol, the organization uses a red crescent in countries where Islam is the dominant religion and is known as the Red Crescent. To avoid association with religious symbols, the International Federation of Red Cross and Red Crescent Societies (the global umbrella organization for all national Red Cross and Red Crescent organizations), recently adopted the Red Crystal as its new symbol. presentation can make a message more tangible and thus more effective for employees, customers, and investors.
  • 6. Both partners know that the right visuals can inspire peo- ple to move from resistance to commitment to action. “Strat- egy is not something that’s done in a box with only a rational hat on,” says Stone. “It needs to be visceral, human, and of- ten emotional.” Yamashita agrees, and adds, “We’re trying to move people to a place where it makes sense to act.”1 M13_BOVE5352_09_SE_C12.QXD 5/18/07 2:46 PM Page 362 CHAPTER 12 Designing Visual Communication 363 46053 C PHNJ B&E A B P N 363 C/M/Y/K DESIGN SERVICES OF Thanks to advances in technology and changing audience expectations, business communication is becoming more visual. Visual literacy is the ability to both create and interpret visuals. ings and using them to your advantage are important aspects of being an effective business communicator. Because they have so much power to communicate, visuals must be carefully planned, created, and integrated with text. An awkward sentence or grammatical error deep within a report might not be noticed by the majority of readers, but a poorly chosen or clumsily im-
  • 7. plemented visual will be noticed by most—and can confuse or alienate audiences and dam- age your credibility. You don’t need to be a professional designer to use visuals effectively, but you do need be aware of some basic design principles if you want to avoid making high- visibility mistakes. This chapter gives you enough background to begin creating your own business visuals, and with some practice you’ll be able to craft effective visuals for nearly any communication project you might encounter. The Visual Evolution in Business Communication Several technological and social factors are contributing to the increasing use—and importance—of visuals in business communication. The process of creating and work- ing with visual elements used to be the domain of experts with complex and expensive tools. However, digital technology has changed this situation dramatically. Digital cam- eras that can produce high-quality images and video are inexpensive and easy enough for anyone to use; the software needed to create diagrams, process photos, edit video, and prepare other visual elements continues to get both easier and more powerful all the time; the global reach of the Internet makes it easy to send images almost instantly; and more Internet users have high-speed connections that can handle the larger computer files that visuals tend to require. Design and production tasks that used to take days can now be completed in hours or even minutes. As technologies such as wireless network- ing continue to advance, business communicators will continue
  • 8. to reach wider audiences in less time, using equipment that costs less and requires fewer skills.4 While technology has been putting visual design and production into the hands of everyday business communicators in recent years, audience skills and expectations have been evolving as well. Two changes in particular could affect your communication efforts in the coming years. First, U.S. government research indicates that only half of the adult population in the United States now have the literacy skills considered necessary for success in today’s workplace.5 In other words, depending on the nature of your work, you could find yourself communicating with audiences whose skills could keep them from successfully reading your documents. Visuals could play a vital role in communi- cating your messages to audiences with lower reading skills. Second, as technology has multiplied the ways in which communicators can create visuals and as people grow up and live in a more visual, media-saturated environment, audiences may well expect messages to be more visual. As a result of these changes in both the tools and the communication environment, visual literacy, the ability (as a sender) to create effective images and (as a receiver) to correctly interpret visual messages, has become a key business skill.6 Whether you need to use images to reach an audience with limited reading skills or want to use images to
  • 9. magnify the impact of your written messages, knowing how to help your audience see what you see will help you become a more effective communicator. Visual Design Principles Just as creating effective sentences, paragraphs, and documents requires working knowl- edge of the principles of good writing, creating effective visuals requires some knowledge of the principles of good design. Even though few businesspeople have the opportunity to formally study the “language”of line, mass, space, size, color, pattern, and texture, any- one can learn enough of the basic concepts to craft effective basic visuals. When you encounter visuals that you find appealing or unappealing, or effective or ineffective, stop and ask yourself why you responded the way you did. Did a particular design grab you and practically force you to pay attention, or did you pass right by with hardly a notice? Did one graph reveal its information quickly and easily while another Creating effective visuals and correctly interpreting visuals that other people create are important business skills. M13_BOVE5352_09_SE_C12.QXD 5/18/07 2:46 PM Page 363 2 L E A R N I N G O B J E C T I V E
  • 10. Discuss six principles of graphic design that can improve the quality of your visuals 364 PART 4 Supporting Messages with Quality Information 46053 C PHNJ B&E A B P N 364 C/M/Y/K DESIGN SERVICES OF made you spend time decoding its confusing message? Did one photo appeal to you at an emotional level and therefore draw you into a document, whereas another repulsed you for some reason and caused you to lose interest in the document? By thinking about your own reactions to visual designs, you can become a more effective designer yourself. As you consider your reactions to various designs and create designs of your own, you’ll begin to see how six fundamental principles help distinguish ineffective and effective de- signs: consistency, contrast, balance, emphasis, convention, and simplicity (see Figure 12.2): ● Consistency. Audiences view a series of visuals as a whole and assume that design ele- ments will be consistent from one page to the next. For instance, if your first chart shows data for Division A in blue and for Division B in green, the audience will get confused if you later switch to green for Division A and red for Division B. Think of consistency as visual parallelism, in the same way that textual parallelism helps audiences understand
  • 11. and compare a series of ideas.7 You can achieve visual parallelism in a variety of ways, through the consistent use of color, shape, size, texture, position, scale, or typeface. ● Contrast. Readers expect visual distinctions to match verbal ones. To emphasize differ- ences, depict items in contrasting colors, such as red and blue, or black and white. But to emphasize similarities, make color differences more subtle. In a pie chart, you might show two similar items in two shades of blue and a dissimilar item in yellow. Keep in mind that accent colors draw attention to key elements, but they lose their effect if you overdo them. ● Balance. The human eye tends to compare visual images with physical structures, and images that appear to be out of balance can be as unsettling as a building that looks like it’s about to tip over. Balance can be either formal, in which the elements in the images are arranged symmetrically around a central point or axis, or informal, in which ele- ments are not distributed evenly but stronger and weaker elements are arranged in such a way that achieves an overall effect of balance. A common approach to informal bal- ance is weighing one visually dominant element against several smaller or weaker ele- ments.8 Generally speaking, formal balance is more calming and serious, whereas informal balance tends to feel more dynamic and engaging (which is why most adver- tising uses this approach, for example).
  • 12. ● Emphasis. Audiences usually assume that the dominant element in a design is the most important, so make sure that the visually dominant element really does represent the most important information. You can do this through color, position, size, or place- ment, for instance. Conversely, be sure to visually downplay less important items. For instance, avoid using strong colors for minor support points, and de-emphasize back- ground features such as the grid lines on a chart. ● Convention. Visual communication is guided by a variety of generally accepted rules or conventions, just as written communication is guided by an array of spelling, gram- mar, punctuation, and usage conventions. These conventions dictate virtually every as- pect of design.9 Moreover, many conventions are so ingrained that people don’t even realize they are following conventions. For example, if English is your native language, you assume that ideas progress across the page from left to right, because that’s the di- rection in which English text is written. Whether it’s the sequence of steps in a process diagram or elapsed time along the bottom of a graph, you automatically expect this left- to-right flow. However, if you are a native Arabic or Hebrew speaker, you might auto- matically assume that flow on a page or screen is from right to left, because that is the direction in which these languages are written. Flouting conventions often causes breakdowns in communication, but in some cases, it can be done to great effect.10 For
  • 13. instance, flipping an organization chart upside down to put the customers at the top, with front-line employees directly beneath them and on down to the chief executive at the bottom, can be an effective way to emphasize that customers come first and the re- sponsibility of managers is supporting employees in their efforts to satisfy customers. ● Simplicity. As a general rule, simpler is better when it comes to visuals for business communication. When you’re designing graphics for your documents, remember that you’re conveying information, not decorating an apartment or creating artwork. Limit the number of colors and design elements you use, and take care to avoid chartjunk, a term coined by visual communication specialist Edward R. Tufte for dec- Nearly every aspect of visual design is governed by conventions that set audience expectations. M13_BOVE5352_09_SE_C12.QXD 5/18/07 2:46 PM Page 364 CHAPTER 12 Designing Visual Communication 365 46053 C PHNJ B&E A B P N 365 C/M/Y/K DESIGN SERVICES OF Inappropriate emphasis draws the eye to the
  • 14. red rectangle, which is not central to the message Inconsistent bullets force audience to interpret symbols to see if they contain some additional message Cluttered design forces audience to hunt for the message Headline is clearly emphasized Conventional left-to-right, top-to-bottom arrangement makes it easy to find the message Unconventional arrangement forces the audience to read from lower left to upper right Poor design buries the slide title in an image, rather than visually emphasizing it
  • 15. Consistent use of bullets lets audience focus on the message, not the mechanics (a) Ineffective Design (b) Effective Design FIGURE 12.2 Ineffective and Effective Design The slide in Figure 12.2a violates numerous principles of effective design, as you can see in the annotations. Figure 12.2b will never win any awards for exciting or innovative design, but it does its job efficiently and effectively. orative elements that clutter documents and potentially confuse readers without adding any relevant information.11 Computers make it far too easy to add chartjunk, from clip art illustrations to three-dimensional bar charts that display only two di- mensions of data (see Figure 12.3). When you need to show distinctions between vi- sual elements, follow Tufte’s strategy of the smallest effective difference. In his words, “Make all visual distinctions as subtle as possible, but still clear and effective.”12 For example, the slices in a pie chart don’t need to be distinguished by both color and texture; one or the other will do the job more efficiently. M13_BOVE5352_09_SE_C12.QXD 5/18/07 2:46 PM Page 365
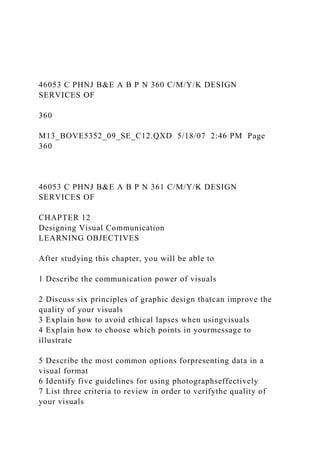
  • 16. 366 PART 4 Supporting Messages with Quality Information 46053 C PHNJ B&E A B P N 366 C/M/Y/K DESIGN SERVICES OF (a) (b) FIGURE 12.3 The Power of Simplicity These two graphs contain the same information, but Figure 12.3a is much easier to interpret. None of the additional elements in Figure 12.3b, including the extra colors, background design, and three- dimensional structure, add any information value—and they make the graph harder to interpret. Adding a false third dimension to two-dimensional information such as these sales figures is a common mistake. The Ethics of Visual Communication Power always comes with responsibility—and the potential power of visuals places an eth- ical burden on every business communicator. This situation involves not only the obvious requirement of avoiding intentional ethical lapses but the more complicated and often more subtle requirement of avoiding unintentional lapses as well.
  • 17. Ethical problems can range from photos that play on racial or gender stereotypes to images that imply cause-and-effect relationships that may not exist to graphs that distort data (see Figure 12.4). Just as subtle word choices shade the meaning of your writing, seemingly minor design variations can influence the message your readers take away from your business graphics. If all three graphs in Figure 12.4 show the same data, which—if any—would be more “hon- Remember that the ability to communicate with visuals comes with the responsibility to communicate ethically. M13_BOVE5352_09_SE_C12.QXD 5/18/07 2:46 PM Page 366 3 L E A R N I N G O B J E C T I V E Explain how to avoid ethical lapses when using visuals CHAPTER 12 Designing Visual Communication 367 46053 C PHNJ B&E A B P N 36 C/M/Y/K DESIGN SERVICES OF 200 175
  • 19. 100 90 80 70 60 Jan (b) Measured Impurities Feb Pa rt s p er M ill io n Mar Apr May Jun Jul Aug Sep Oct Nov Dec 120 100 80
  • 20. 60 40 20 0 Jan (a) Measured Impurities Feb Pa rt s p er M ill io n Mar Apr May Jun Jul Aug Sep Oct Nov Dec FIGURE 12.4 Influencing Perception Through Visual Design Figure 12.4a shows impurities measured over the course of a 12-month period; the vertical scale is set from 0 to 120, sufficient to cover the range of
  • 21. variations in the data. However, what if you wanted to make the variations from month to month look more severe? Less severe? Figure 12.4b, with the scale “zoomed in” to a narrow range of 60 to 110, makes the variations look much more dramatic. The result could be a stronger emotional impact on the reader, creating the impression that these impurities are out of control. In contrast, Figure 12.4c expands the scale, from 0 to 200, which appears to minimize the variations in the data. This graph is visually “calmer,” potentially creating the opposite impression—that there’s really nothing to worry about. The data shown in all three graphs are identical, but they send three different messages to the reader. est” than the others? The answer to this question depends on your intent and your audi- ence’s information needs. For instance, if dramatic swings in the measurement from month to month suggest a problem with the quality of your product or the safety of a process that affects the public, then visually minimizing the swings might well be considered dishonest. Altering the scale of data charts is just one of many ways that visuals can be designed to
  • 22. emphasize or de-emphasize certain aspects of information. For example, photographs can influence perceptions of physical size (and perhaps of quality, value, danger, or other asso- ciated variables), depending on the way the various elements are arranged in the picture. To increase the perceived size of a product, an advertiser might show a close-up of it being held by someone with smaller-than-average hands. Conversely, a large hand would make the product seem smaller. You can work to avoid ethical lapses in your visuals by following these guidelines:13 ● Consider all possible interpretations—and misinterpretations. Try to view your visuals from your audience members’ perspective; will their biases, beliefs, or backgrounds lead them to different conclusions than you’ve intended? For instance, You can take many steps to emphasize or de-emphasize specific elements in your visuals, but make sure you don’t inadvertently commit an ethical lapse while doing so. M13_BOVE5352_09_SE_C12.QXD 5/18/07 2:46 PM Page 367 368 PART 4 Supporting Messages with Quality Information
  • 23. 46053 C PHNJ B&E A B P N 368 C/M/Y/K DESIGN SERVICES OF Visuals can’t always speak for themselves; make sure your audience has enough context to interpret your visuals correctly. assume that you want to show how easy your product is to use, and the photograph you’ve chosen just happens to show a woman operating the product. Will anyone conclude that what you really mean to say is that your product is so simple that “even a woman can use it”? In other words, while trying to compliment your product, are you unintentionally insulting women? ● Provide context. Even when they are completely accurate, all visuals can show only a partial view of reality. This limitation ranges from the obvious (photos can show only what is within the camera’s view) to the subtle (graphs that appear to show variations in the quantity being measured when the differences are actually measurement errors). Part of your responsibility as a communicator is to provide not only accurate visuals but enough background information to help audiences interpret the visual information correctly. ● Don’t hide or minimize negative information that runs counter to your argument. Let’s say you’re responsible for employee satisfaction in all 10 of your company’s divi-
  • 24. sions, and you measure the results of your efforts every quarter through employee sur- veys. If satisfaction scores are up in four divisions, unchanged in three divisions, and down in three divisions, you can’t legitimately “prove” that you’re being successful with a graph that highlights only the four positive data points. ● Don’t exaggerate information that supports your argument. Similarly, you have a re- sponsibility not to oversell information in support of your argument. If employee sat- isfaction in those four divisions is improved but still lower than it should be, don’t manipulate the graph to imply that all the problems have been solved. You should also resist the temptation to alter or enhance photographs and other images in ways that support your arguments. In skilled hands, image-processing software can alter photos in ways that most viewers cannot detect. The ethical burden rests on business commu- nicators to ensure that all of their visuals are complete, honest, and truly representative of the underlying information. ● Don’t oversimplify complex situations. By their very nature, visuals tend to present simplified views of reality. This is usually a benefit and one of the key reasons for using visuals, such as when you use a flowchart to provide an overview of a complicated process. However, take care not to mislead an audience by hiding complications that are important to the audience’s understanding of the situation.
  • 25. ● Don’t imply cause-and-effect relationships without providing proof that they ex- ist. For example, if you create a line chart that shows how increasing sales seem to track increasing advertising expenditures, you can claim a correlation but not nec- essarily a causal relationship between the two. You can claim a causal relationship (meaning that the increase in advertising spending caused the increase in sales) only if you can isolate advertising spending as the only factor that can account for the in- crease in sales. ● Avoid emotional manipulation or other forms of coercion. Visuals, particularly pho- tographs and video, can be persuasive elements to use in emotional appeals. However, you must take care not to overstep into unethical manipulation. For instance, a photo- graph of an unhappy child being treated as a social outcast because he or she doesn’t wear the latest fashions or own the trendiest new toys could be considered an unethical way to persuade parents to buy those products for their children. ● Be careful with the way you aggregate data. Preparing charts, graphs, and tables that pres- ent data often involves decisions about aggregating, or grouping, data. For example, you could summarize the output from one of your factories in a variety of ways. To show out- put over the course of one year, you could total the data by month, creating a graph with just 12 data points. This approach would emphasize monthly or seasonal variations, but it
  • 26. would hide weekly or daily variations that could be meaningful to your audience. You might find that production drops for the first few days of every quarter, for instance, per- haps because the staff has to work extra hard at the end of the quarter to meet quarterly production goals, then eases off for a few days to compensate.Or you could present the data from a different angle completely, such as showing average output per hour over the course The ways in which you aggregate data for display can affect the messages and meanings that your audience extracts from your visuals. M13_BOVE5352_09_SE_C12.QXD 5/18/07 2:46 PM Page 368 CHAPTER 12 Designing Visual Communication 369 46053 C PHNJ B&E A B P N 369 C/M/Y/K DESIGN SERVICES OF Ethics Detective Is Something Hiding Behind These Numbers? You’ve been assigned to present the results of an industrywide study of the effects of insecticide. Your audience consists of the department heads in your company, whose experience and edu- cation backgrounds vary widely, from chemical engineering to insurance to law. You’re convinced you need to keep your report
  • 27. as simple and as jargon-free as possible.You’ll then invite content- area specialists to contact you if they have technical questions. You’re not a scientific expert in insecticides, but your su- pervisor has introduced you to a scientist who works for a trade association that represents chemical producers, includ- ing your firm. The scientist is familiar with the study you’ll be reporting on, and she has experience in communicating tech- nical subjects to diverse audiences. You jumped at the chance to have such a knowledgeable person review your presentation for technical accuracy, but you’re uncomfortable with some of her feedback. In particular, you question her advice to replace the following line chart, which shows the number of insecti- cide poisonings and deaths by age. She suggests that this chart is too busy and too difficult for nonspecialists to read. As an alternative, she provides a bar chart that selects four specific ages from the entire range. She says this chart communicates the same basic idea as the line chart but is much easier to read. Ethics Detective Poisonings Deaths 0 2 4 6 8 10 12 14 16 18 20 Insecticide Accidents Age of victim 80 70
  • 29. Insecticide Accidents Age of victim 60 50 40 30 20 10 0 N um b er o f in ci d en ts
  • 30. ANALYSIS You agree with the scientist that the line chart is visually busy and takes more effort to process, but something bothers you about the bar chart. Does it present the insecticide situation accurately and honestly? Why or why not? of the eight-hour workday, which might highlight completely different concerns. Low output in the first hour of the day could signal people frequently coming in late or problems getting the machinery up and running every morning. Whatever the situa- tion, the decisions you make about aggregating the data can have a profound effect on the message your audience receives (see “Ethics Detective: Is Something Hiding Behind These Numbers?”). M13_BOVE5352_09_SE_C12.QXD 5/18/07 2:46 PM Page 369 4 L E A R N I N G O B J E C T I V E Explain how to choose which points in your message to illustrate 370 PART 4 Supporting Messages with Quality Information 46053 C PHNJ B&E A B P N 3 0 C/M/Y/K DESIGN SERVICES OF Effective visuals are clear, complete, concise, connected, and compelling.
  • 31. IDENTIFYING POINTS TO ILLUSTRATE To help identify which parts of your message can benefit from visuals, either to support your textual message or perhaps to replace a section of text entirely, step back and consider the flow of your entire message from the audience’s point of view. Which parts of the message are likely to seem complex, open to misinterpretation, or even just a little bit dull? Are there any connections between ideas or data sets that might not be obvious if they are addressed only in text? Is there a lot of numerical data or other discrete factual content that would be difficult to read if presented in paragraph form? Is there a chance that the main idea won’t “jump off the page” if it’s covered only in text? Will readers greet the message with skepti- cism and therefore look for plenty of supporting evidence? If you answer yes to any of these questions, you probably need one or more visuals. For instance, detailed facts and figures may be confusing and tedious in paragraph form, but tables and charts can conveniently organize and display such detail with clarity. Some points may require a detailed description of physical relationships or procedures, in which case you might want to use flowcharts, drawings, or photographs to clarify the dis- cussion. Or you may simply want to draw attention to a particular fact or detail by rein- forcing the message visually. When you’re deciding which points to present visually, think of the five Cs: ● Clear. The human mind is extremely adept at processing
  • 32. visual information, whether it’s something as simple as the shape of stop sign or as complicated as the floor plan for a new factory. If you’re having difficultly conveying an idea in words, take a minute to brainstorm some visual possibilities. ● Complete. Visuals, particularly tables, often serve to provide the supporting details for your main idea or recommendation. Moreover, the process of summarizing, conclud- ing, or recommending often requires you to narrow down your material or exclude de- tails; a table or other visual can provide these details without getting in the way of your main message. ● Concise. You’ve probably heard the phrase “A picture is worth a thousand words.” If a particular section of your message seems to require extensive description or explanation, see whether there’s a way to convey this information visually. With a picture working in conjunction with text, you may be able to reduce your word count considerably. ● Connected. A key purpose of many business messages is showing connections of some sort—similarities or differences, correlations, cause-and-effect relationships, and so on. Whenever you want readers to see such a connection, see whether a chart, diagram, or other illustration can help. ● Compelling. Your readers live in a highly visual world. Will
  • 33. one or more illustrations make your message more persuasive, more interesting, more likely to get read? You never want to insert visuals simply for decorative purposes, of course, but even if a par- ticular point can be expressed equally well via text or visuals, consider adding the visual in order to make your report or presentation more compelling. As you identify which points in your document would benefit from a visual, make sure that each visual you decide on has a clear purpose (see Table 12.1). SELECTING THE RIGHT TYPE OF VISUAL Once you’ve identified which points would benefit most from visual presentation, your next decision is choosing which type of visual to use for each message point. As you can see in Figure 12.5, you have many choices for business graphics. For certain types of information, M13_BOVE5352_09_SE_C12.QXD 5/18/07 2:46 PM Page 370 5 L E A R N I N G O B J E C T I V E Describe the most common options for presenting data in a visual format CHAPTER 12 Designing Visual Communication 371 46053 C PHNJ B&E A B P N 3 1 C/M/Y/K DESIGN SERVICES OF
  • 34. TABLE 12.1 When to Use Visuals PURPOSE APPLICATION To clarify Support text descriptions of “graphic” topics: quantitative or numerical information, explanations of trends, descriptions. To simplify Break complicated descriptions into components that can be depicted with conceptual models, flowcharts, organization charts, or diagrams. To emphasize Call attention to particularly important points by illustrating them with line, bar, and pie charts. To summarize Review major points in the narrative by providing a chart or table that sums up the data. To reinforce Present information in visual and written form to increase reader’s retention. To attract Make material seem more interesting by decorating the cover or title page and by breaking up the text with visual aids. To impress Build credibility by putting ideas into visual form to convey the impression of authenticity and precision. To unify Depict the relationship among points—for example, with a flowchart.
  • 35. You have many types of visuals to choose from, and each is best suited to particular communication tasks. the decision is usually obvious. To present a large set of numerical values or detailed textual information, a table is the obvious choice in most cases. However, if you’re presenting data broken down geographically, a color-coded map might be more effective to show overall patterns rather than individual data points. Also, certain visuals are used more commonly for certain applications, so your audience is likely to expect line charts and bar charts to show trends. Line charts usually show data variations relative to a time axis (such as sales month by month), whereas bar charts more often compare discrete groups (such as sales by demographic segment). Although a bar chart can show the percentages that make up a whole, this job is usually reserved for pie charts. The following sections explore the most common types of visuals in more detail, start- ing with visuals designed to present data. Presenting Data Business professionals have a tremendous number of choices for presenting data, from general purpose line, bar, and pie charts to specialized charts for product portfolios, finan- cial analysis, and other professional functions. The visuals most commonly used to pre- sent data include tables; line and surface charts; bar charts, pictograms, and Gantt charts;
  • 36. scatter and bubble diagrams; and pie charts. Tables When you need to present detailed, specific information, choose a table, a systematic arrangement of data in columns and rows. Tables are ideal when your audience needs infor- mation that would be either difficult or tedious to handle in the main text. Most tables contain the standard parts illustrated in Table 12.2. Every table includes vertical columns and horizontal rows, with useful headings along the top and side. The number of columns and rows you can comfortably fit in a table depends on the medium. For printed documents, you can adjust font size and column and row spacing to fit a considerable amount of information on the page and still maintain readability. For on- line documents, you’ll need to reduce the number of columns and rows to make sure Printed tables can display extensive amounts of data, but tables for online display and electronic presentations need to be simpler. M13_BOVE5352_09_SE_C12.QXD 5/18/07 2:46 PM Page 371 Gospel Benson Gospel Benson
  • 37. Gospel Benson Gospel Benson Gospel Benson Gospel Benson Gospel Benson Gospel Benson Gospel Benson Gospel Benson 372 PART 4 Supporting Messages with Quality Information 46053 C PHNJ B&E A B P N 3 2 C/M/Y/K DESIGN SERVICES OF Communication Challenge Table Line chart, bar chart Bar chart, line chart Pie chart
  • 38. Scatter chart, bubble chart Map Flowchart, diagram Drawing Photograph Animation, video To present individual, exact values To show trends in one or more variables, or the relationship between those variables, over time To compare two or more sets of data To show frequency or distribution of parts in a whole To compare entities against two or three variables To show geographic relationships or comparisons
  • 39. To illustrate processes or procedures To show conceptual or spatial relationships (simplified) To show spatial relationships (realistic) To show processes, transformations, and so on in action Effective Visual Choice Presenting Data Presenting Information, Concepts, and Ideas 4,500 4,250 4,000 3,750 3,500 3,250 3,000 2,750
  • 40. 2,500 0 2001 2002 2003 2004 2005 Operating Revenue M ill io n $ 2500 2000 1500 1000 500 0 8: 00 A M 8: 30
  • 46. 2003 Worldwide Market Share 2004 2005 Central/ South America Asis/Pacific Europe/Africa/ Middle East 30% 25% 20% 15% 10% 5% 0% Competitor Financial Health 0% 10% 20% 30% Revenue Growth Rate Pr of it
  • 47. M ar g in 40% 50% 60% 70% 30% 25% 20% 15% 10% 5% 0% Competitor Financial Health 0% 10% 20% 30% Revenue Growth Rate Pr of it M ar g
  • 48. in 40% 50% 60% 70% Year-End Head Count by Function Assemblers, 67 Engineers, 27 Marketing/sales, 28 Admin support, 25 Shipping, 17 Facilities, 14 Accounting, 14 Executives, 8 Verify overage with requesting dept. Return invoice to vendor Submit to accounts payable No Yes Yes
  • 49. Valid purchase order? Receive invoice No Amount within PO limit? Accepted? NoYes 9,300 5,500 3,700 1,700 600 49,300 9,300 5,500 3,700 1,700 (11 states) (9) (10) (11) (9) to
  • 50. to to to to U.S. Population Projections for 2025 (in thousands) 27,183 1,812 885 6,412 2,883 2,312 1,739 7,808 4,349 49,285 6,250 4,057 3,108 2,612 5,188
  • 52. 19,830 1,423 FIGURE 12.5 Selecting the Best Visual For each point you want to illustrate, make sure you choose the most effective type of visual. your tables are easily readable online. Tables for oral presentations usually need to be the simplest of all, because you can’t expect audiences to read detailed information from the screen. Although complex information may require formal tables that are set apart from the text, you can present some data more simply within the text. You make the table, in essence, a part of the paragraph, typed in tabular format. Such text tables are usually in- troduced with a sentence that leads directly into the tabulated information. Here’s an example:14 M13_BOVE5352_09_SE_C12.QXD 5/18/07 2:46 PM Page 372 CHAPTER 12 Designing Visual Communication 373 46053 C PHNJ B&E A B P N 3 3 C/M/Y/K DESIGN SERVICES OF Here is how the five leading full-service restaurant chains
  • 53. compare in terms of number of locations and annual revenue: OSI RESTAURANT PARTNERS APPLEBEE’S CARLSON BRINKER DARDEN Major Chain(s) Outback Steakhouse, Carrabba’s Applebee’s TGI Friday’s, Pick Up Stix Chili’s, Romano’s Red Lobster, Olive Garden Locations 1,300 1,800 900 1,600 1,400 Revenue ($ Million) $3,602 $1,217 $2,400 $4,151 $5,721 Source: Hoover’s Online [accessed 17 November 2006] www.hoovers.com. Line charts are commonly used to show trends over time or the relationship between two or more variables. When you prepare tables, follow these guidelines to make your tables easy to read: ● Use common, understandable units, and clearly identify the units you’re using, whether it’s dollars, percentages, price per ton, or whatever.
  • 54. ● Express all items in a column in the same unit and round off for simplicity. ● Label column headings clearly and use a subhead if necessary. ● Separate columns or rows with lines or extra space to make the table easy to follow; in complex tables, consider highlighting every other row or column in a pale, contrasting color. ● Provide totals or averages of columns or rows when relevant. ● Document the source of the data using the samze format as a test footnote (see Appendix II). Although numerical tables are more common, tables can also contain words, symbols, or other facts and figures. Word tables are particularly appropriate for presenting survey findings or for comparing various items against a specific standard. Line and Surface Charts A line chart illustrates trends over time or plots the relationship of two or more variables. In line charts showing trends, the vertical, or y, axis shows the amount, and the horizontal, or x, axis shows the time or other quantity against which the amount is being measured. Both axes often start at zero in the lower left-hand corner, but you can exercise a fair amount of flexibility with both axes in order to present your data as clearly as possible. For instance, to show both positive and negative values (such as profit and
  • 55. loss), you can have the y axis span from a negative value up to a positive value, with zero somewhere in between. Of course, you should always avoid distorting the data in ways that could mislead your audi- ence, as “The Ethics of Visual Communication” noted on page 366. TABLE 12.2 Parts of a Table MULTICOLUMN HEAD* STUB HEAD SUBHEAD SUBHEAD SINGLE-COLUMN HEAD SINGLE-COLUMN HEAD Row head XXX XXX XX XX Row head Subhead XX XXX XX X Subhead XX XXX XX XX____ ____ ___ ___ Total XXX XXX XX XX Source: (In the same format as a text footnote; see Appendix B.) *Footnote (For an explanation of elements in the table, a superscript number or small letter may be used instead of an asterisk or other symbol.) M13_BOVE5352_09_SE_C12.QXD 5/18/07 2:46 PM Page 373 Gospel Benson
  • 56. 374 PART 4 Supporting Messages with Quality Information 46053 C PHNJ B&E A B P N 3 4 C/M/Y/K DESIGN SERVICES OF 90,000 80,000 70,000 60,000 50,000 40,000 30,000 20,000 10,000 0 2001 2002 2003 2004 2005 20072006 Home Game Ticket Sales Other Students Families Alumni Staff
  • 57. A ve ra g e p er G am e FIGURE 12.7 Surface Chart Surface or area charts can show a combination of trends over time and the individual contributions of the components of a whole. 2,500 2,000 1,500 1,000 500 0
  • 61. Kiln BT em p er at ur e ˚F FIGURE 12.6 Line Chart This two-line chart compares the temperatures measured inside two cement kilns from 8:00 A.M. to 5:00 P.M. If you need to compare two or more sets of data, you can plot them on the same chart for instant visual comparison (see Figure 12.6). Two or three lines on a single chart are usu- ally easy to read, but beyond that, things can get confusing, particularly if the lines cross. By their very nature, line charts often raise the question, “What happens next?” For in- stance, if you present sales data for the past 12 months, your audience may well ask what you think will happen in the next 12 months. Predicting the future is always a risky endeavor, but you can use your spreadsheet’s forecasting tools to extend a line into the future using a sta- tistical technique known as regression analysis. Check your spreadsheet’s Help function for more information on using its linear regression, trend line, or
  • 62. forecasting functions. However, when using these tools, be aware that all they can do is extract patterns from past data and extend those patterns into the future. They don’t have any awareness of the “real-life” factors that shaped that past data—and may or may not produce that same pattern in the future. A surface chart, also called an area chart, is a form of line chart with a cumulative ef- fect; all the lines add up to the top line, which represents the total (see Figure 12.7). This form of chart helps you illustrate changes in the composition of something over time. One common use is showing how sales of individual products contribute to the company’s over- all revenue.15 When preparing a surface chart, put the most important segment on the bot- tom and build up from there. Bar Charts, Pictograms, and Gantt Charts A bar chart portrays numbers by the height or length of its rectangular bars, making a series of numbers easy to read or understand. Bar charts are particularly valuable when you want to ● Compare the size of several items at one time ● Show changes in one item over time A spreadsheet offers ways to predict future values based on past values shown in a line chart. M13_BOVE5352_09_SE_C12.QXD 5/18/07 2:46 PM Page 374
  • 63. Gospel Benson CHAPTER 12 Designing Visual Communication 375 46053 C PHNJ B&E A B P N 3 5 C/M/Y/K DESIGN SERVICES OF 100% 90% 80% 70% 60% 50% 40% 30% 20% 10% 0 E-mail Desktop Publishing BloggingGraphicsInstant Messaging
  • 64. Podcasting HTML/XML Programming (a) CommuniCo Staff Computer Skills FIGURE 12.8 The Versatile Bar Chart Here are six of the dozens of variations possible with bar charts: singular (12.8a), grouped (12.8b), deviation (12.8c). (continued) 100% 90% 80% 70% 60% 50% 40% 30% 20% 10% 0 North America 2005
  • 65. (b) Worldwide Market Share 2006 2007 Central/ South America Asia/Pacific Europe/Africa/ Middle East $50.00 $45.00 $40.00 $35.00 $30.00 12/5 low open close high (c) CommuniCo Stock Price 12/6 12/7 12/8 12/9 You can create bar charts in a wide variety of formats; choose the form
  • 66. that best illustrates the data and relationships in your message. ● Indicate the composition of several items over time ● Show the relative size of components of a whole As the charts in Figure 12.8 show, bar charts can appear in various forms. Grouped bar charts compare more than one set of data, using a different color or pattern for each set. Deviation bar charts identify positive and negative values, or winners and losers. Segmented bar charts, also known as stacked bar charts, show how individual components contribute to a total number, using a different color or pattern for each component. Combination bar and line charts compare quantities that require different intervals. Paired bar charts show the correlations between two items. Figure 12.8 also suggests how creative you can be with bar charts.You might align the bars either vertically or horizontally, or you might use bar charts to show both positive and nega- tive quantities. Be careful, however, to keep all the bars in the chart the same width; different widths could suggest a relative importance to the viewer. In addition, space the bars evenly and place them in a logical order, such as chronological or alphabetical. Most of the software you’ll M13_BOVE5352_09_SE_C12.QXD 5/18/07 2:46 PM Page 375
  • 67. be using to create charts makes these choices for you; just be sure to verify what the software has done and override any settings that don’t seem to work well for a given chart. You can also convert the bars into lines of symbols, so that the number or length of the symbols indicates the relative value of each item. A chart that portrays data as symbols in- stead of words or numbers is known as a pictogram. The chief value of pictograms is their novelty and ability to convey a more literal, visual message, but they tend to be more diffi- cult to read and can present a less professional tone than a straightforward bar chart. Closely related to the bar chart is the time line chart, which shows how much time is needed to complete each task in a given project. When you want to track progress toward com- pleting a project, you can use a type of time line chart known as a Gantt chart (see Figure 12.9). Scatter and Bubble Diagrams If you need to compare several entities (companies, markets, employees, and so on) by two variables, such as revenue and profit margin, use a scatter diagram, also known as an XY diagram. This diagram is similar to a line chart in the sense that one variable is plotted along the x (horizontal) axis and another along the y (vertical) axis. However, in a scatter diagram, individual points are plotted, not continuous lines. The bubble diagram expands to three variables, with the size of the bubble representing the third variable (see Figure 12.10).
  • 68. 376 PART 4 Supporting Messages with Quality Information 46053 C PHNJ B&E A B P N 3 6 C/M/Y/K DESIGN SERVICES OF 100% 90% 80% 70% 60% 50% 40% 30% 20% 10% 0 Sales IM (d) CommuniCo Preferred Communication Media Engineering Admin E-Mail Telephone Text Messaging Face-to-Face
  • 69. FIGURE 12.8 Continued Segmented (12.8d), combination (12.8e), and paired (12.8f). 16,000 14,000 12,000 10,000 8,000 6,000 4,000 2,000 0 $8,000,000 $7,000,000 $6,000,000 $5,000,000 $4,000,000 $3,000,000 $2,000,000
  • 70. $1,000,000 $0 2002 Headcount Training Costs (e) CommuniCo Employee Training Costs 2003 2004 2005 2006 2007 H ea d co un t Training C osts Women in Attendance Men in Attendance 600 800
  • 71. 450 750 590 950 (f) Conference Attendance by Gender San Diego Conference Las Vegas Conference Miami Conference Scatter diagrams compare entities against two variables; bubble diagrams compare them against three. M13_BOVE5352_09_SE_C12.QXD 5/18/07 2:46 PM Page 376 Gospel Benson Pie Charts Like segmented bar charts and area charts, a pie chart shows how the parts of a whole are distributed. However, pie charts have the advantage of familiarity; most people expect parts of a whole to be displayed via a pie chart. Each segment represents a slice of a complete cir- cle, or pie. As you can see in Figure 12.11, pie charts are an
  • 72. effective way to show percentages or to compare one segment with another. You can also combine pie charts with tables to ex- pand the usefulness of such visuals. When creating pie charts, try to restrict the number of slices in the pie. Otherwise, the chart looks cluttered and is difficult to label. If necessary, lump the smallest pieces together in a “miscellaneous” category. Ideally, the largest or most important slice of the pie, the seg- ment you want to emphasize, is placed at the 12 o’clock position; the rest are arranged clock- wise either in order of size or in some other logical progression. CHAPTER 12 Designing Visual Communication 377 46053 C PHNJ B&E A B P N 3 C/M/Y/K DESIGN SERVICES OF 1 2 3 4 5 6 7 8
  • 73. 9 10 11 Design Phase Design Project Prototype Design Test Prototype Prototype Complete Marketing Research Phase Preliminary Research Conduct Focus Groups Interviews Analyze Research Results Create Marketing Plan 6/20/07 6/20/07 8/3/07 8/24/07
  • 76. 100.00 100.00 0.00 0.00 June SeptemberAugustJuly 2007 ID Project Time line Start Date End Date Duration Percentage Complete % FIGURE 12.9 Gantt Chart This Gantt chart shows the activities involved in designing the prototype and conducting the marketing research for a new product. The maroon bars indicate completed tasks, the blue bars indicate activities not yet completed, and the black diamond is a milestone—in this case the prototype’s due date. 30% 25% 20% 15% 10%
  • 77. 5% 0% Competitor Financial Health 0% 10% 20% 30% Revenue Growth Rate Pr of it M ar g in 40% 50% 60% 70% Extan (Annual sales: $155M/yr) Flizel (Annual sales: $700M/yr) Zenach (Annual sales: $850M/yr) MooreComp (Annual sales: $1.4B/yr) FIGURE 12.10 Bubble Diagram The bubble diagram shows three variables: distance along the x and y axes, plus the diameter of each bubble. In this case, the
  • 78. rate of revenue growth is plotted on the x axis, profit margin is plotted on the y axis, and the size of the bubbles represents annual revenues. For instance, MooreComp has the greatest revenues but the lowest profit margin, although it is growing faster than two of its three competitors. Most readers expect pie charts to show the distribution of parts within a whole. M13_BOVE5352_09_SE_C12.QXD 5/18/07 2:46 PM Page 377 Gospel Benson Gospel Benson 378 PART 4 Supporting Messages with Quality Information 46053 C PHNJ B&E A B P N 3 8 C/M/Y/K DESIGN SERVICES OF Year-End Head Count by Function Assemblers, 67 Engineers, 28 Marketing/sales, 27
  • 79. Admin support, 25 Shipping, 17 Facilities, 14 Accounting, 14 Executives, 8 FIGURE 12.11 Pie Chart When creating pie charts, use different colors or patterns to distinguish the various pieces. Label all the segments and indicate their value in either percentages or units of measure so that your readers will be able to judge the value of the wedges. Be sure to distinguish the slices in the pie chart with different colors or patterns. Use flowcharts to show a series of steps in a process or other sequential relationships. Use organization charts to depict the interrelationships among the parts of a whole. Use different colors (or patterns, if you’ll be printing or reproducing charts in black and white) to distinguish the various pieces. If you want to draw attention to the segment that
  • 80. is of the greatest interest to your readers, use a brighter color for that segment, draw an ar- row to the segment, or explode it by pulling the segment away from the rest of the pie. In any case, label all the segments and indicate their value in either percentages or units of mea- sure so that your readers will be able to judge the value of the wedges. Remember, the seg- ments must add up to 100 percent if percentages are used or to the total number if numbers are used. Presenting Information, Concepts, and Ideas In addition to facts and figures, you’ll need to present other types of information, from spa- tial relationships to abstract ideas. As Keith Yamashita and his colleagues at SYP demon- strate, words aren’t always the best way to communicate information, concepts, or ideas, so these professionals often look for visual solutions to complement or even replace textual in- formation. The most common types of visuals for these applications include flowcharts and organization charts; maps; drawings, diagrams, and photographs; and animation and video. Flowcharts and Organization Charts If you need to show physical or conceptual relationships rather than numerical ones, you might want to use a flowchart or an organization chart. A flowchart (see Figure 12.12) il- lustrates a sequence of events from start to finish; it is indispensable when illustrating processes, procedures, and sequential relationships. For general business purposes, you don’t need to be too concerned about the specific shapes, but
  • 81. keep them consistent. How- ever, be aware that there is a formal flowchart “language” in which each shape has a specific meaning (diamonds are decision points, rectangles are process steps, and so on). If you’re communicating with computer programmers and others who are accustomed to formal flowcharting, make sure you use the correct symbols in each case to avoid confusion. Graph- ics programs that have flowchart symbols usually label their functions, making it easy to use the right ones. As the name implies, an organization chart illustrates the positions, units, or functions of an organization and the way they interrelate (Figure 12.13). These charts aren’t limited to organizational structures, of course; as you saw in Chapter 4, they can also be used to out- line messages. Maps Maps can be used in a variety of ways to show location, distance, points of interest (such as competitive retail outlets), and geographic distribution of data, such as sales by region or population by state. In addition to presenting facts and figures, maps are useful for showing market territories, distribution routes, and facilities locations. Maps are sometimes used in conjunction with aerial photographs to provide a richer view (see Figure 12.14). Use maps for such tasks as representing statistics by geographic area or showing spatial
  • 82. relationships. M13_BOVE5352_09_SE_C12.QXD 5/18/07 2:46 PM Page 378 CHAPTER 12 Designing Visual Communication 379 46053 C PHNJ B&E A B P N 3 9 C/M/Y/K DESIGN SERVICES OF Verify overage with requesting dept. Return invoice to vendor Submit to accounts payable No Yes Yes Valid purchase order? Receive invoice No
  • 83. Amount within PO limit? Accepted? NoYes FIGURE 12.12 Flowchart Flowcharts show sequences of events and are most valuable when the process or procedure has a number of decision points and variable paths. Board of Trustees President Dean of the College Dean of Students Dean of Administration Dean of Technical Education Division Dean of General Education Division Dean of Continuing Education Division
  • 84. Technical Education Division Faculty General Education Division Faculty Continuing Education Division Faculty Business Manager Personnel Manager Admissions Director Counselor Registrar Administration and Faculty of Atlantic College FIGURE 12.13 Organization Chart An organization chart is the expected way to illustrate the hierarchy of positions in an organization. M13_BOVE5352_09_SE_C12.QXD 5/18/07 2:46 PM Page 379
  • 85. 380 PART 4 Supporting Messages with Quality Information 46053 C PHNJ B&E A B P N 380 C/M/Y/K DESIGN SERVICES OF 9,300 5,500 3,700 1,700 600 49,300 9,299 5,499 3,699 1,699 (11 states) (9) (10) (11) (9) to to to to to U.S. Population Projections for 2030 (in thousands) (a) Map Showing Statistical Data (b) Map Generated by a Geographical Information System
  • 88. 10,078 12,683 19,830 1,423 9,349 3,739 9,558 861 6,274 FIGURE 12.14 Map Maps offer many opportunities for displaying data and information. The map in Figure 12.14a shows population projections for each state in the United States. Figure 12.14b is a simple version of a geographic information system, in this case showing hotels and motels in a neighborhood near New York’s La Guardia Airport. A company looking for sites to build a hotel in this area could use such a map to identify potential competitors, traffic patterns, and other important variables.
  • 89. Simple maps are available via clip art libraries for your word processor and presen- tation software, but more powerful uses (such as automatically generating color-coded maps based on data inputs) usually require the specialized capabilities of geographic in- formation systems. You may also want to explore online resources such as Google Earth (http://earth.google.com) and Windows Live (http://maps.live.com), which offer a variety of mapping and aerial photography features. M13_BOVE5352_09_SE_C12.QXD 5/18/07 2:46 PM Page 380 6 L E A R N I N G O B J E C T I V E Identify five guidelines for using photographs effectively CHAPTER 12 Designing Visual Communication 381 46053 C PHNJ B&E A B P N 381 C/M/Y/K DESIGN SERVICES OF Use drawings and diagrams to show how something works or how it is made or used; drawings are sometimes better than photographs because they let you focus on the most important details. Macintosh Computers
  • 90. Mobile Professionals Telecommuters OS/2 PCs Legacy DOS PCs ISON Dial-up UNIX X terminals Portable Windows Tablets Wireless LAN-based Desktop PCs UNIX Workstations Cross-Platform Desktops Web Computing Server Microsoft Windows or Linux Branch Offices
  • 91. Remote Computing Wireless Terminals and Information Appliances Internet Network LAN WAN FIGURE 12.15 Diagram Clearly drawn diagrams can help audiences grasp technical information quickly. Drawings, Diagrams, and Photographs Although drawings, diagrams, and photographs are often created by people working in communication specialties such as web design or technical writing, all managers encounter situations in which such images can help get their messages across (see Figure 12.15). For example, when Brian Lamkin, an executive at Adobe Systems, wants to inform his staff about new competitive products being demonstrated at trade shows or the way Adobe prod- ucts are being displayed in a particular retail store, he uses his digital camera to share im- ages.16 Simple drawings can show the network of suppliers in an industry, the flow of funds through a company, or the process for completing the payroll
  • 92. each week. More complex di- agrams can convey technical topics such as the operation of a machine or repair procedures. Word processors and presentation software provide basic drawing capabilities, but for more precise and professional illustrations you’ll need a specialized package such as Mi- crosoft Visio or Adobe Illustrator. Moving a level beyond those programs, computer-aided design (CAD) systems such as Autodesk’s Autocad can produce extremely detailed architec- tural and engineering drawings. Photographs offer both functional and decorative value. In the past, their use was lim- ited to specialized documents such as annual reports and product brochures; however, with low-cost digital photography now widely available, virtually all writers can have the ability to add photographs to print documents, presentations, and webpages. In addition, photo li- braries such as Getty Images (www.gettyimages.com) and photo search engines such as the one provided by AltaVista (www.altavista.com/image) make it easy to find digital photo- graphs. Some of these photos are available for free, but the professional collections, such as Getty Images, require either a one-time payment for unlimited use (often called royalty free) or an annual payment or other limited-use purchase (often called rights managed). However, as with all computer advances, “easy” doesn’t always mean “effective.” To use photographs successfully, consider these five guidelines:
  • 93. ● Consider whether a diagram would be more effective than a photograph. Photographs are often unmatched in their ability to communicate spatial relationships, sizes, shapes, and other physical parameters, but sometimes they communicate too Use photographs for visual appeal and to show exact appearances. M13_BOVE5352_09_SE_C12.QXD 5/18/07 2:46 PM Page 381 382 PART 4 Supporting Messages with Quality Information 46053 C PHNJ B&E A B P N 382 C/M/Y/K DESIGN SERVICES OF Match the resolution of your photo files to the application; use higher resolution for print and lower resolution for electronic display. much information. For example, to show how to adjust a specific part of a complicated machine, a photo can be confusing because it shows all the parts within the camera’s view. A simplified diagram is often more effective because it allows you to emphasize the specific parts that are relevant to the problem at hand. ● Learn how to use basic image-processing tools. For instance, you can drop photo-
  • 94. graphs directly into your word processor or presentation files, then use that program to change the size of the file to fit the available space, but this isn’t always the best ap- proach. Rather than simply resizing, you might be better off cropping, or electronically cutting away part of the photo. ● Match the file to the application. Digital photos vary widely in resolution, which is the amount of detail in the image. Resolution can be expressed in one of two ways. Digital cameras are usually specified in pixels, the total number of picture elements in the file. For example, a 5-megapixel camera produces a photo with 5 million pixels in the im- age. Printers and scanners are usually specified in dots per inch, or dpi, which is the num- ber of discrete points per linear inch. A 600 dpi office printer, therefore, outputs 360,000 (600 ! 600) discrete dots per square inch. Up to the limits of the printer, greater reso- lution is usually better for printed documents, but it isn’t always helpful for online use. High-resolution image files are significantly larger than low- resolution image files, so they consume more storage space and take longer to transmit or download. In addition, most computer monitors and other electronic displays have less than 100 dpi resolution and therefore can’t display all the fine detail in high-resolution images anyway. (To be accurate, it is possible to show all the detail, but doing so requires scaling up the photo to large and unwieldy sizes.) If you plan to use photos on a website or online report, use
  • 95. the “save for web” feature in your image-processing software to reduce the resolution and therefore the file size. ● Make sure the photographs have communication value. Just because it’s easy to drop photos into documents doesn’t mean you should automatically do so, naturally. Judge photographs with the same discerning eye you use for every other element of your re- port or presentation. ● Be aware of copyrights and model permissions. Just as with the textual information that you find online, you can’t simply insert online photographs into your documents. Unless they are specifically offered for free, you have to assume someone owns the pho- tos and is entitled to payment or at least a photo credit. In addition, professional pho- tographers are careful to have any person who poses in photos sign a model release form, which gives the photographer permission to use the person’s image. Technology makes it easy to use photographs in reports and presentations, but it also presents an important ethical concern. Software tools such as Photoshop and Paint Shop Pro allow you to easily make dramatic changes to photos— without leaving a clue that they’ve been altered. Altering photos in small ways has been possible for a long time (more than a few students have had blemishes airbrushed out of their yearbook photos), but com- puters make drastic changes easy and undetectable. You can
  • 96. remove people from photo- graphs, put Person A’s head on Person B’s body, and make products look more attractive than they really are. Most people would agree that it’s acceptable to make cosmetic improve- ments, such as brightening an underexposed photo to make it easier to view. But to avoid ethical lapses, don’t make any alterations that mislead the viewer or substantially change the message conveyed by the photo.17 Animation and Video Computer animation and video are among the most specialized forms of business visuals; when they are appropriate and done well, they offer unparalleled visual impact. At a simple level, you can animate shapes and text within electronic presentations (see Chapter 17). At a more sophisticated level, software such as Macromedia Flash enables the creation of mul- timedia files that include computer animation, digital video, and other elements. A wide va- riety of tools are also available for digital video production. Whether you use these tools yourself or employ a specialist to create animation or video for you, make sure the results follow all the guidelines for effective business messages. Altering or enhancing photographs can create ethical problems. M13_BOVE5352_09_SE_C12.QXD 5/18/07 2:46 PM Page 382
  • 97. CHAPTER 12 Designing Visual Communication 383 46053 C PHNJ B&E A B P N 383 C/M/Y/K DESIGN SERVICES OF PRODUCING AND INTEGRATING VISUALS Now that you understand the communication power of visuals and have chosen the best visuals to illustrate key points in your report, website, or presentation, it’s time to get creative. This section offers advice on creating visuals, integrating them with your text, and verifying the quality of your visual elements. Creating Visuals Technology has put powerful graphics tools in the hands of virtually every business computer user, so you no longer have to rely on professional designers as much as businesspeople had to only a few years ago. Unfortunately, computers can’t provide the specialized training and hands-on experience of a professional designer. Computers make it easy to create vi- suals, but they also make it easy to create ineffective, distract- ing, and even downright ugly visuals. However, by following the basic design principles discussed on pages 363 to 365, you can create all the basic visuals you need—visuals that are both attractive and effective. Whether you’re using the charting functions offered in a spreadsheet or the design features of a specialized graphics pro- gram, take a few minutes to familiarize yourself with the soft- ware’s quirks and capabilities. For instance, spreadsheets can create charts with just a few clicks of the mouse, but the default colors, fonts, or other design elements might not be the best for your particular needs. If possible, have a professional designer set up a template for the various types of visuals you and your col- leagues need to create. In addition to helping ensure an effective
  • 98. design, using templates saves you the time of making numerous design decisions every time you create a chart or graphic. However, be careful with the templates included with some commercial software programs. Some are “overde- signed” and inappropriate for serious business uses, and some clutter the image with fancy borders and backgrounds that can distract an audience from your real message. No matter which tools you’re using, take care to match the style and quality of your visuals with the subject matter and the situation at hand. The style of your visuals communicates a subtle message about your relationship with the audience. A simple sketch might be fine for a working meeting but inap- propriate for a formal presentation or report. On the other hand, elaborate, full-color visuals may be viewed as extravagant for an informal report but may be entirely appropriate for a message to top management or influential outsiders. Integrating Visuals with Text For maximum effectiveness and minimum disruption for the reader, visual elements need to be carefully integrated with the text of your message. In some instances, visual elements are somewhat independent from the text, as in the sidebars that occasionally accompany magazine articles. Such images are related to the content of the main story, but they aren’t referred to by a specific title or figure number. This sort of treatment is used most often in promotional materials such as brochures and advertisements. For reports and most other business documents, however, visuals are tightly integrated with the text so that readers can move back and forth between
  • 99. text and visuals with as little To show investors what a new building would look like in its environment, an artist combined a photograph of a scale model of the building with a photograph of the actual street scene. Because the target audience clearly understands that the building doesn’t exist, this sort of image manipulation is not unethical. M13_BOVE5352_09_SE_C12.QXD 5/22/07 3:39 PM Page 383 384 PART 4 Supporting Messages with Quality Information 46053 C PHNJ B&E A B P N 384 C/M/Y/K DESIGN SERVICES OF To tie visuals to the text, introduce them in the text and place them near the points they illustrate. disruption as possible. Successful integration involves four decisions: maintaining a balance between visuals and text, referring to visuals in the text, placing the visuals in the document, and writing titles and other descriptions. Maintaining a Balance Between Illustrations and Words Strong visuals enhance the descriptive and persuasive power of your writing, but put- ting too many visuals into a report can distract your readers. If you’re constantly refer- ring to tables, drawings, and other visual elements, the effort to
  • 100. switch back and forth from words to visuals can make it difficult for readers to maintain focus on the thread of your message. The space occupied by visuals can also disrupt the flow of text on the page or screen. The pacing of visuals throughout the text is also an important consideration. If most of your visuals are bunched in one section of the report, readers might spend more time there and less time in the text-heavy sections. Although it isn’t always possi- ble to have perfect distribution throughout the report, try to have a fairly even flow of text and visuals from page to page or screen to screen. As always, take your readers’ specific needs into account. If you’re addressing an au- dience with multiple language backgrounds or widely varying reading skills, you can shift the balance toward more visual elements to help get around any language barri- ers. The professional experience, education, and training of your audience should in- fluence your approach as well. For instance, detailed statistical plots and mathematical formulas are everyday reading material for quality-control engineers but not for most salespeople or top executives. Referencing Visuals Unless a visual element clearly stands on its own, as in the sidebars you often see in mag- azines, visuals should be clearly referred to by number in the
  • 101. text of your report. Some re- port writers refer to all visuals as “exhibits” and number them consecutively throughout the report; many others number tables and figures separately (everything that isn’t a table is re- garded as a figure). In a long report with numbered sections, illustrations may have a dou- ble number (separated by a period or a hyphen) representing the section number and the individual illustration number within that section. Whichever scheme you use, make sure it’s clear and easy to follow. Help your readers understand the significance of visuals by referring to them before readers encounter them in the document or on the screen. The following examples show how you can make this connection in the text: Figure 1 summarizes the financial history of the motorcycle division over the past five years, with sales broken into four categories. Total sales were steady over this period, but the mix of sales by category changed dramati- cally (see Figure 2). The underlying reason for the remarkable growth in our sales of youth golf apparel is sug- gested by Table 4, which shows the growing interest in junior golf around the world. When describing the data shown in your visuals, be sure to emphasize the main point you are trying to make. Don’t make the mistake of simply repeating the data to be shown. Para-
  • 102. graphs that do are guaranteed to put the reader to sleep: Among women who replied to the survey, 17.4 percent earn less than $5 per hour; 26.4 per- cent earn $5 to $7; 25.7 percent, $8 to $12; 18.0 percent, $13 to $24; 9.6 percent, $25 to $49; and 2.9 percent, $50 and over. The visual will (or at least should) provide all these details; there is no need to repeat them in the text. Instead, use round numbers that sum up the message: Over two-thirds of the women who replied earn less than $12 per hour. The use of color in visuals accelerates learning, retention, and recall by 55 percent to 78 percent, and it increases motivation and audience participation up to 80 percent. M13_BOVE5352_09_SE_C12.QXD 5/18/07 2:46 PM Page 384 7 L E A R N I N G O B J E C T I V E List three criteria to review in order to verify the quality of your visuals CHAPTER 12 Designing Visual Communication 385 46053 C PHNJ B&E A B P N 385 C/M/Y/K DESIGN SERVICES OF
  • 103. Place each visual as close as possible to its in-text reference to help readers understand the illustration’s relevance and to minimize the effort of reading. Placing Visuals Try to position your visuals so that your audience won’t have to flip back and forth (in printed documents) or scroll (on screen) between the visuals and the text. Ideally, it’s best to place each visual within, beside, or immediately after the paragraph it illustrates so that readers can consult the explanation and the visual at the same time. This scheme works well both in print and online. If at all possible, avoid bunching visuals at the end of a sec- tion or the end of a document; doing so asks a lot of the reader. (Bunching is unavoidable in some cases, such as when you have multiple visuals that ac- company a single section of text.) Word-processing, desktop- publishing, and web-design programs let you place graphical elements virtually anywhere you wish, so take advantage of this flexibility. Writing Titles, Captions, and Legends Titles and legends provide two more opportunities to connect your visual and textual messages. A title is similar to a sub- heading, providing a short description that identifies the con- tent and purpose of the visual, along with whatever label and number you’re using to refer to the visual. A caption usually offers additional discussion of the visual’s content and can be several sentences long if appropriate. Captions can also alert readers that additional discussion is available in the accompa- nying text. Titles usually appear above visuals and captions appear below, but effective de-
  • 104. signs can place these two elements in other positions. Sometimes titles and captions are combined in a single block of text as well. As with all design decisions, be consistent throughout your report or website. A legend helps readers “decode” the visual by explain- ing what various colors, symbols, or other design choices mean. Legends aren’t necessary for simple graphs, such as a line chart or bar chart with only a series of data, but they are in- valuable with more complex graphics. By considering your word choices for all three of these textual elements, you can help readers link the visuals with the text and quickly grasp the most important points of each visual. Readers should be able to grasp the point of the visual without digging into the sur- rounding text. For instance, a title that says simply, “Refineries” doesn’t say much at all. “Ac- tive Petroleum Refineries in the United States” provides a much better idea of what the chart is all about. You may also want to use informative titles, rather than basic descriptive titles. A descriptive title simply identifies the topic of the illustration, whereas an informative title calls attention to the conclusion that ought to be drawn from the data. Here’s an exam- ple of the difference: DESCRIPTIVE TITLE INFORMATIVE TITLE Relationship Between Petroleum Demand Refinery Capacity Declines as Petroleum and Refinery Capacity in the United States Demand Continues to Grow
  • 105. Regardless of whether your titles and legends are informative or descriptive, phrase them consistently throughout the report. Verifying the Quality of Your Visuals Visuals have a particularly strong impact on your readers and on their perceptions of you and your work, so verifying their quality is vital. Take a few extra minutes to make sure that your visuals are absolutely accurate, properly documented, and honest: ● Is the visual accurate? Be sure to check visuals for mistakes such as typographical er- rors, inconsistent color treatment, confusing or undocumented symbols, and mis- aligned elements. Also verify that information in visuals and text matches. For data presentations, particularly if you’re producing charts with a spreadsheet, verify any Descriptive titles simply identify the topic of an illustration; informative titles help the reader understand the conclusion to be drawn from the illustration. D O C U M E N T M A K E OV E R IMPROVE THIS REPORT SUMMARY AND VISUALS To practice correcting drafts of actual documents, visit your online course or the access-code-protected portion of the Companion Website. Click “Document Makeovers,” then click Chapter 12. You will find a competitive analysis report summary that contains problems and errors relating to what you’ve learned in this chapter about communicating infor-
  • 106. mation through visuals. Use the Final Draft decision tool to create an improved version of this summary. Check the mes- sage for appropriate formatting of visuals and proper use of text with visuals. The title of a visual functions in the same way as a subheading, whereas the caption provides additional detail if needed. M13_BOVE5352_09_SE_C12.QXD 5/18/07 2:46 PM Page 385 386 PART 4 Supporting Messages with Quality Information 46053 C PHNJ B&E A B P N 386 C/M/Y/K DESIGN SERVICES OF ✓ CHECKLIST: Creating Effective Visuals • Emphasize visual consistency to connect parts of a whole and minimize audience confusion. • Avoid arbitrary changes of color, texture, typeface, position, or scale. • Highlight contrasting points through color, position, and other design choices. • Decide whether you want to achieve formal or informal balance. • Emphasize dominant elements and de-emphasize less-important pieces in a design.
  • 107. • Understand and follow (at least most of the time) the visual conventions your audience expects. • Strive for simplicity and clarity; don’t clutter your visuals with meaningless decoration. • Follow the guidelines for avoiding ethical lapses. • Carefully consider your message, the nature of your information, and your audience to choose which points to illustrate. • Select the proper types of graphics for the information at hand and for the objective of the message. • Be sure the visual contributes to overall understanding of the subject. • Understand how to use your software tools to maximize effectiveness and efficiency. • Integrate visuals and text by maintaining a balance between illustrations and words, clearly referring to visuals within the text, and placing visuals carefully. • Use titles, captions, and legends to help readers understand the meaning and importance of your visuals. • Verify the quality of your visuals by checking for accuracy, proper documentation, and honesty. formulas used to generate the numbers, and make sure you’ve selected the right num- bers for each chart. When you’re in a hurry, it’s easy to select the wrong column of
  • 108. numbers in a spreadsheet or the wrong set of numbers within a column. For flow- charts, organizational charts, diagrams, photos, and other visuals, compare the visuals you created with the visuals you had planned to create. Does each visual deliver your message accurately? Have you inserted the right photos, maps, or other files? ● Is the visual properly documented? As with the textual elements in your reports and presentations, visuals based on other people’s research, information, and ideas require full citation. (Even if the graphical design is entirely yours, any underlying information taken from other sources needs to be documented.) Also, try to anticipate any questions or concerns your audience may have and address them with additional information as needed. For instance, if you’re presenting the results of survey research, many readers will want to know who participated in the survey, how many people responded, and when the questions were asked.You could answer these questions with a note in the cap- tion along the lines of “652 accountants, surveyed the week of January 17.” Similarly, if you found a visual in a secondary source, list that source on or near the graphic to help readers assess the information. Alternatively, you can list sources in an appendix. ● Is the visual honest? As a final precaution, step back and make sure your visuals com- municate truthful messages. Make sure they don’t hide information the audience needs,
  • 109. imply conclusions that your information doesn’t support, or play on audience emo- tions in manipulative or coercive ways. For a review of the important points to remember when creating visuals, see “Check- list: Creating Effective Visuals.” Review each visual to make sure it doesn’t intentionally or unintentionally distort the meaning of the underlying information. M13_BOVE5352_09_SE_C12.QXD 5/18/07 2:46 PM Page 386 CHAPTER 12 Designing Visual Communication 387 46053 C PHNJ B&E A B P N 38 C/M/Y/K DESIGN SERVICES OF COMMUNICATION CHALLENGES AT STONE YAMASHITA PARTNERS In Canada, the Tim Horton’s chain is famous for its coffee and donuts. However, with over 2,600 shops, Tim’s has saturated the Canadian market and is looking to grow in the United States, where it has just over 300 shops. That growth won’t be easy: Tim’s faces Dunkin’ Donuts, Krispy Kreme, and Starbucks in their home territory.
  • 110. Individual Challenge: Tim’s has hired SYP to help recruit franchise owners for its southward expansion, and Keith Yamashita is planning an event for the 100 most promising po- tential franchisees. To help illustrate the business opportunity, he has asked you to create compelling visuals for the follow- ing items: ● Compare the size of several items at one time ● Show changes in one item over time ● Indicate the composition of several items over time ● The planned growth in the number of Tim’s outlets in four U.S. regions (North, West, South, and East) over the next 10 years Decide what kind of visual to use for each item. Create ex- ample visuals by making up any data you need. Team Challenge: SYP often uses life-size mockups to help people visualize new possibilities, such as the interior layout of a Tim’s franchise. In a small group, brainstorm the layout of a coffeehouse that you think would appeal to customers on or near your college campus. Write a brief e-mail explain- ing how you could “stage” a life-size mockup of your store layout to help potential franchisors see what a Tim’s store is like inside. SUMMARY OF LEARNING OBJECTIVESSUMMARY OF LEARNING OBJECTIVES 1 Describe the communication power of visuals. Visualsenhance the communication impact of your writing and in some cases even replace writing. First, visuals can con- vey some types of information better than text can. Sec- ond, visuals are an effective way to reach audiences of diverse professional and cultural backgrounds. Third,
  • 111. busy readers who may lack the time or inclination to read your entire message often look to visuals to quickly grasp the essence of what you’re trying to communicate. 2 Discuss six principles of graphic design that can im-prove the quality of your visuals. When preparing vi- suals, (1) use elements of design consistently so you don’t confuse your audience; (2) use color and other elements to show contrast effectively; (3) strive for a visual bal- ance, either formal or informal, that creates a feel that is appropriate for your overall message; (4) use design choices to draw attention to key elements and to visually downplay less important items; (5) understand and fol- low design conventions that your audience expects (even if the expectation is subconscious), although you can consider unconventional design choices if they promise to convey your message more effectively; and (6) strive for simplicity in all your visuals, making design decisions that enhance the reception and understanding of infor- mation, rather than obscuring or confusing it. 3 Explain how to avoid ethical lapses when using visuals.Communicators have the responsibility to avoid both intentional and unintentional ethical lapses when us- ing visual elements. They can work to avoid these lapses by (1) considering all possible interpretations— and misinterpretations—of their messages and avoiding design choices that could lead to unwanted interpreta- tions; (2) providing sufficient context, whether visual or verbal, for audiences to understand the meaning and significance of visuals; (3) not hiding or minimizing nega- tive information that runs counter to their arguments; (4) not exaggerating information that supports their argu- ments; (5) not oversimplifying complex situations by hid- ing complications that are relevant to the audience’s understanding; (6) not implying cause-and-effect relation-
  • 112. ships without providing proof that they exist; (7) avoiding emotional manipulation or other forms of coercion; and (8) being careful with the way they aggregate data. 4 Explain how to choose which points in your message toillustrate. To decide which points to illustrate, first step back and consider the overall flow of your message from the audience’s point of view. Identify elements of the message that might be complex, vulnerable to misin- terpretation, or even dull. Look for connections between ideas that should be highlighted or extensive collections M13_BOVE5352_09_SE_C12.QXD 5/18/07 2:46 PM Page 387 388 PART 4 Supporting Messages with Quality Information 46053 C PHNJ B&E A B P N 388 C/M/Y/K DESIGN SERVICES OF of data and other discrete factual content that might be difficult to read in textual format. 5 Describe the most common options for presentingdata in a visual format. The visuals most commonly used to present data include tables, line and surface charts, bar charts, pictograms, Gantt charts, and pie charts. You will probably use line, bar, and pie charts most often in your business communication efforts. 6 Identify five guidelines for using photographs effec-tively. First, consider whether a diagram would com- municate more effectively than a photograph. Second, learn how to use basic image-processing tools so that
  • 113. you can crop, size, and perform other necessary tasks with photos. Third, match the file to the application; high-resolution photos are usually desirable for printed documents but not for most online and electronic dis- play applications. High-resolution images take up more storage space and take longer to transmit electronically, and the typical computer monitor can’t display all the details in high-resolution photos. Fourth, make sure every photo has communication value and isn’t just a decoration or distraction. Fifth, be aware of copyrights and model permissions. 7 List three criteria to review in order to verify the qual-ity of your visuals. Make sure every visual you use is accurate (there are no mistakes or missing information), properly documented (the creator of any underlying data used in the visual has been given complete credit), and honest (the visual honestly reveals the real meaning of the underlying data or information). Test Your Knowledge 1. What type of visual would you use to compare one part with a whole? 2. What type of visual would you use to present detailed, exact values? 3. What type of visual would you use to compare one item with another? 4. What type of visual would you use to illustrate trends over time? 5. When are combination bar and line charts used? 6. For what purposes are Gantt charts used?
  • 114. 7. How does a flowchart differ from an organization chart? 8. When would you use a bubble diagram instead of a scatter diagram? 9. What is the purpose of adding titles, captions, and legends to visuals in reports? 10. How do you check a visual for quality? Apply Your Knowledge 1. What similarities do you see between visuals and nonverbal communication? Explain your answer. 2. You’re writing a report to the director of human resources on implementing team-based management throughout your company. You want to emphasize that since the new approaches were implemented six months ago, absenteeism and turnovers have been sharply reduced in all but two departments. How do you visually present your data in the most favorable light while still maintaining honest communication? Explain. 3. Besides telling readers why an illustration is important, why refer to it in the text of your document? 4. When you read a graph, how can you be sure that the visual impression you are receiving is an accurate reflection of reality? Please explain. 5. Ethical Choices What ethical issue is raised by the use of technology to alter photographs in reports? Practice Your Knowledge Messages for Analysis Message 12.A: Analyzing Pie Charts
  • 115. Examine the pie charts in Figure 12.16 and point out any prob- lems or errors you notice. Message 12.B: Analyzing a Line Chart Examine the line chart in Figure 12.17 and point out any prob- lems or errors you notice. Exercises For active links to all websites discussed in this chapter, visit this text’s website at www.prenhall.com/bovee. Locate your book and click on its Companion Website link. Then select Chapter 12, and click on “Featured Websites.” Locate the name of the page or the URL related to the material in the text. Please note that links to sites that become inactive after publication of the book will be re- moved from the Featured Websites section. 12.1 Improving Visual Design Find a communication example that you believe could be improved by applying the visual design principles you learned in this chapter. It can be from any medium—a webpage, a magazine ad, a promotional e-mail message, an illustration from a report—anything that you can either copy or scan into a word-processing file. With the image in your word processor, annotate it with notes that identify visual weaknesses and describe ways to fix those weaknesses. (In Microsoft Word, for example, you can use the “AutoShapes Callouts” feature to place notes wherever you’d like on the page.) In a paragraph of accompanying text, explain why you believe the message isn’t as effective as it could be and how your suggestions would make it more effective.
  • 116. 12.2 Preparing Pie Charts As a market researcher for a statewide chain of car dealerships, you’re examining car M13_BOVE5352_09_SE_C12.QXD 5/18/07 2:46 PM Page 388 CHAPTER 12 Designing Visual Communication 389 46053 C PHNJ B&E A B P N 389 C/M/Y/K DESIGN SERVICES OF Individual 37% Individual 50% Group 29% Group 44% Credit 20% Credit 5% Industrial 14% Industrial 1% 2005 2007
  • 117. What Types of Life Insurance Policies Are in Effect? FIGURE 12.16 Pie Charts for Analysis and truck ownership and lease patterns among single drivers in various age groups. By discovering which age groups have the highest percentages of owners, you will be better able to target advertising that promotes the leasing option. Using the information that follows, prepare a bar chart comparing the number of owners with the number of leasers in each age category. Be sure to label your chart, and include combined totals for owners and leasees (“total drivers”). Then prepare a pie chart showing the proportion of owners and leasers in the one age group that you think holds the most promise for leasing a new vehicle. Write a sentence that prepares your company’s management for the information shown in the pie chart. 1 0.9 0.8 0.7 0.6 0.5 0.4 0.3
  • 118. 0.2 0.1 0 Jan Feb Mar Apr May Jun Jul Aug Sep Oct Nov Dec Mowers Tractors Snowblowers Customer Satisfaction FIGURE 12.17 Line Chart for Analysis M13_BOVE5352_09_SE_C12.QXD 5/18/07 2:46 PM Page 389 390 PART 4 Supporting Messages with Quality Information 46053 C PHNJ B&E A B P N 390 C/M/Y/K DESIGN SERVICES OF Number of Owners Number of Leasees Age Group (in Thousands) (in Thousands) 18–24 1,830 795 25–29 1,812 1,483 30–34 1,683 1,413 35–44 1,303 1,932 45–54 1,211 1,894