Data Visualization & Why it is Important in Your Business
•
0 likes•2 views

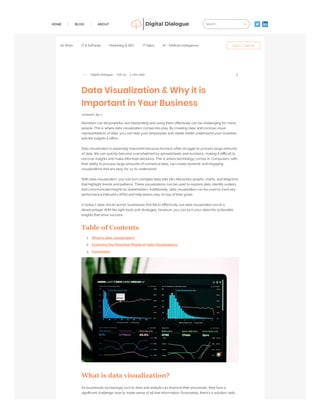
Numbers can be powerful, but interpreting and using them effectively can be challenging for many people. This is where data visualization comes into play. By creating clear and concise visual representations of data, you can help your employees and clients better understand your business and the insights it offers.

Recommended
Recommended
More Related Content
Similar to Data Visualization & Why it is Important in Your Business
Similar to Data Visualization & Why it is Important in Your Business (20)
Recently uploaded
Recently uploaded (20)
Data Visualization & Why it is Important in Your Business
- 1. HOME BLOG ABOUT Search... IT & Software Marketing & SEO IT Sales All Posts AI - Artificial Intelligence Log in / Sign up Digital Dialogue Feb 22 4 min read Data Visualization & Why it is Important in Your Business Updated: Apr 1 Numbers can be powerful, but interpreting and using them effectively can be challenging for many people. This is where data visualization comes into play. By creating clear and concise visual representations of data, you can help your employees and clients better understand your business and the insights it offers. Data visualization is especially important because humans often struggle to process large amounts of data. We can quickly become overwhelmed by spreadsheets and numbers, making it difficult to uncover insights and make informed decisions. This is where technology comes in. Computers, with their ability to process large amounts of numerical data, can create dynamic and engaging visualizations that are easy for us to understand. With data visualization, you can turn complex data sets into interactive graphs, charts, and diagrams that highlight trends and patterns. These visualizations can be used to explore data, identify outliers, and communicate insights to stakeholders. Additionally, data visualization can be used to track key performance indicators (KPIs) and help teams stay on top of their goals. In today's data-driven world, businesses that fail to effectively use data visualization are at a disadvantage. With the right tools and strategies, however, you can turn your data into actionable insights that drive success. Table of Contents What is data visualization? As businesses increasingly turn to data and analytics to improve their processes, they face a significant challenge: how to make sense of all that information. Fortunately, there's a solution: data What is data visualization? 1. Exploring the Potential Pitfalls of DataVisualizations 2. Conclusion 3.
- 2. visualization. By using technology to pre-digest data and presenting it in a format that's easy for humans to understand, data visualization is a powerful tool for unlocking insights and driving success. Here are three reasons why your business needs data visualizations: 1. Better Insights With data visualization, you can transform complex data sets into clear and compelling visual representations. This allows you to quickly identify trends, outliers, and patterns that might otherwise be missed. By providing deeper insights into your business operations, data visualization enables you to make better-informed decisions and drive better results. 2. Improved Communication Traditional data presentations can be overwhelming and difficult to understand. By contrast, data visualizations are intuitive and engaging, making them an ideal way to communicate complex information to a wide range of audiences. Whether you're presenting to clients, investors, or internal stakeholders, data visualizations can help you convey your message with clarity and impact. 3. Increased Efficiency When you have access to clear and actionable insights, you can make better decisions more quickly. Data visualization helps you streamline your decision-making processes by presenting information in a way that's easy to grasp. By cutting down on time spent poring over spreadsheets and reports, data visualization can help your team become more efficient and productive. In today's data-driven business landscape, the ability to effectively leverage data is a key differentiator. By investing in data visualizations, you can unlock new insights, improve communication, and drive success for your business. Exploring the Potential Pitfalls of Data Visualizations Numbers are an essential component of decision-making in business, but it's crucial to remember that data can be manipulated to present a distorted version of reality. When data is abstracted into a graphic or visual, it can be easy to lose context, and flashy visuals can be used to misdirect viewers. It's essential to use data with integrity and avoid manipulating it to fit preconceived narratives. Misleading data can create confusion, leading to misguided decision-making that may harm your business in the long term. One common example of this is the use of "vanity metrics" in marketing. While these metrics can be useful in the right circumstances, they can also be misleading when taken out of context. For example, a high volume of traffic to a website may seem impressive, but if those users aren't part of the target audience, it may not lead to actual progress or conversion rates. To avoid these pitfalls, it's important to provide appropriate context when creating data visualizations. When you illustrate data, ensure that the graphs and visuals you use represent the appropriate context, and always strive to use data ethically and accurately. By doing so, you can
- 3. 0 views 0 comments avoid the risks of misinterpreting data and make more informed decisions that drive success for your business. Conclusion In today's data-driven business world, leveraging data can be a powerful tool for improving strategies, proving the return on investment (ROI) of efforts and resources, identifying market issues, highlighting business challenges, and more. However, to make sense of this vast amount of data and insights, it's essential to present it in a clear and compelling manner. This is where data visualization comes in. By converting complex data sets into charts, graphs, and other visual representations, data visualization tools can transmit important insights to stakeholders quickly and effectively. Business intelligence (BI) tools are particularly adept at creating quality analytics that can be easily visualized. BI tools can help to analyze vast amounts of data in real-time, providing valuable insights into the market, business operations, and customer behavior. By leveraging the power of data visualization, businesses can gain a competitive edge, make informed decisions, and improve performance across all areas of their organization. From improving marketing strategies to identifying areas for operational improvements, data visualization can be a game-changer for businesses of all sizes. At Digital Dialogue, we're able to provide our services for free because some vendors may pay us for web traffic or other sales opportunities. Our mission is to help technology buyers make informed purchasing decisions, which is why we offer information for all vendors - even those who do not pay us IT & Software SIGN UP AND STAY UPDATED! Enter your email here* Subscribe Now © 2023 Digital Dialogue. All Rights Reserved. | PRIVACY POLICY