BEN earnings outlook improves as rate rises offset deposit costs
•
1 like•240 views

Bendigo and Adelaide Bank (BEN) appears to be finding an earnings baseline, with the rate of cash earnings decline slowing in the second half of 2012. However, given its concentrated exposures to residential mortgages and deposit funding, BEN remains vulnerable to external shocks. Key drivers of BEN's earnings outlook are the residential property market, deposit funding costs, and system credit growth. BEN has an overweight exposure to residential mortgages and leads the sector in deposit funding, but has faced pressure from rising deposit costs.

Recommended
Recommended
More Related Content
What's hot
What's hot (18)
Similar to BEN earnings outlook improves as rate rises offset deposit costs
Similar to BEN earnings outlook improves as rate rises offset deposit costs (20)
More from George Gabriel
More from George Gabriel (20)
Recently uploaded
Recently uploaded (20)
BEN earnings outlook improves as rate rises offset deposit costs
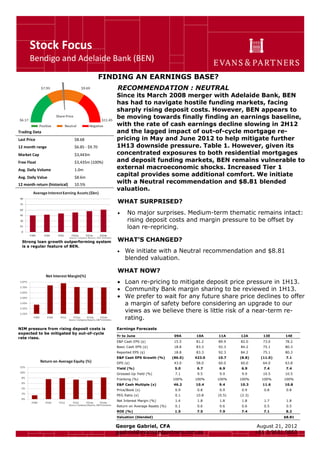
- 1. Stock Focus Bendigo and Adelaide Bank (BEN) 1 FINDING AN EARNINGS BASE? RECOMMENDATION : NEUTRAL Since its March 2008 merger with Adelaide Bank, BEN has had to navigate hostile funding markets, facing sharply rising deposit costs. However, BEN appears to be moving towards finally finding an earnings baseline, with the rate of cash earnings decline slowing in 2H12 and the lagged impact of out-of-cycle mortgage re- pricing in May and June 2012 to help mitigate further 1H13 downside pressure. Table 1. However, given its concentrated exposures to both residential mortgages and deposit funding markets, BEN remains vulnerable to external macroeconomic shocks. Increased Tier 1 capital provides some additional comfort. We initiate with a Neutral recommendation and $8.81 blended valuation. WHAT SURPRISED? No major surprises. Medium-term thematic remains intact: rising deposit costs and margin pressure to be offset by loan re-repricing. WHAT’S CHANGED? We initiate with a Neutral recommendation and $8.81 blended valuation. WHAT NOW? Loan re-pricing to mitigate deposit price pressure in 1H13. Community Bank margin sharing to be reviewed in 1H13. We prefer to wait for any future share price declines to offer a margin of safety before considering an upgrade to our views as we believe there is little risk of a near-term re- rating. Trading Data Last Price $8.68 12 month range $6.85 - $9.70 Market Cap $3,443m Free Float $3,435m (100%) Avg. Daily Volume 1.0m Avg. Daily Value $8.6m 12 month return (historical) 10.5% Strong loan growth outperforming system is a regular feature of BEN. NIM pressure from rising deposit costs is expected to be mitigated by out-of-cycle rate rises. Earnings Forecasts Yr to June 09A 10A 11A 12A 13E 14E E&P Cash EPS (¢) 15.5 81.2 89.9 82.0 73.0 78.2 Basic Cash EPS (¢) 18.8 83.3 92.3 84.2 75.1 80.3 Reported EPS (¢) 18.8 83.3 92.3 84.2 75.1 80.3 E&P Cash EPS Growth (%) (86.0) 423.0 10.7 (8.8) (11.0) 7.1 DPS (¢) 43.0 58.0 60.0 60.0 64.0 63.8 Yield (%) 5.0 6.7 6.9 6.9 7.4 7.4 Grossed-Up Yield (%) 7.1 9.5 9.9 9.9 10.5 10.5 Franking (%) 100% 100% 100% 100% 100% 100% E&P Cash Multiple (x) 46.2 10.4 9.4 10.3 11.6 10.8 Price/Book (x) 0.9 0.8 0.9 0.9 0.8 0.8 PEG Ratio (x) 0.1 10.8 (0.5) (2.3) Net Interest Margin (%) 1.4 1.8 1.8 1.8 1.7 1.8 Return on Average Assets (%) 0.1 0.6 0.6 0.6 0.5 0.5 ROE (%) 1.5 7.5 7.9 7.4 7.1 8.2 Valuation (blended) $8.81 George Gabriel, CFA ggabriel@evansandpartners.com.au August 21, 2012 +61 3 9631 9853
- 2. 2 FY12 RESULT SUMMARY BEN appears to be finally finding an earnings baseline, with the rate of cash earnings decline slowing in 2H12. Table 1. Since its March 2008 merger with Adelaide Bank, BEN has had to navigate hostile funding markets, facing sharply rising deposit costs. However, we expect that the lagged impact of out-of-cycle mortgage re-pricing in May and June 2012 will help mitigate downside pressure in 1H13 earnings. However, the outlook is not highly visible. Given the narrow deposit funding base and concentrated residential mortgages loan book, BEN is vulnerable to deposit market or residential property shocks. Indeed, CEO Mike Hirst said: “There's no doubt that it's been a very challenging 12 months for banks generally, with the issues in Europe meaning competition for deposits has been particularly strong since September. We don't really see any reason why we shouldn't be able to continue to return a reasonable result, but the uncertainty that is around the market makes it difficult to provide any guidance.” Hirst said funding cost pressures, plus the weak demand for loans, was likely to continue in the year ahead. Comparing BEN’s performance against a stable baseline is difficult given M&A, capital management and changing business segment composition (key segments are Retail Banking; Third Party Banking; Wealth; Rural Bank and Central functions). Recent events include: Bank of Cyprus Australia (BOCA) acquisition included in 2H12 results for 4 months from March 2012, contributing income of $11.1m. $150m capital raising (17.751m shares at $8.45 per share) on 19 Dec 2011. Sale of 7.8% in IOOF (IFL) for $110m in Aug 2012, increasing Tier 1 by ~13bp. Sale of portfolio of subordinated notes, releasing ~$90m of capital deductions against these holdings, increasing Tier 1 by ~29bp. Purchase of Macquarie’s $1.5bn margin lending portfolio for $52m in Jan 2009. Key 2H12 result trends include: Cash earnings down -1.7% in 2H12 and -6.9% in 1H12. Cash EPS down -8.2% in 1H12 and -7.8% in 2H12. Net interest income down -1.3% in 2H12. DPS has been flat at 30cps over the last 5 halves (from 2H10 onwards). Tier 1 capital increased to 8.39% as at June 2012 and will increase to 8.81% given post- balance date sale of IFL and subordinated notes. TABLE 1: BEN EARNINGS TRENDS
- 3. 3 KEY DRIVERS Key drivers of BEN’s earnings outlook are (i) residential property market outlook; (ii) deposit funding markets; and (iii) system credit growth. We consider these issues below. 1. Overweight residential property BEN’s loan portfolio is overweight residential property (69% total loans). Even WBC, which is predominantly Australian-focused, only has ~51`% earnings exposure to Australian residential property. Tables 1-2. TABLE 1: BEN LOAN MIX BY SEGMENT Source: BEN. Loan mix by security as at June 12. TABLE 2: WBC EARNINGS MIX 2. Sector-leading deposit base BEN leads the sector in deposit funding mix, comprising ~80% total funding. Whilst deposit funding is usually a strength (reducing reliance on volatile wholesale funds), rising deposit costs have recently hurt earnings.
- 4. 4 CHART 1: DEPOSITS AS % OF TOTAL FUNDING 0% 10% 20% 30% 40% 50% 60% 70% 80% 90% 100% CBA ANZ NAB WBC BEN BOQ Source: Company Reports, EAP Research. NB. Funding positions as at 1H12, BEN as at 2H12. 3. Above-system credit growth Even though system credit growth has been low, BEN typically grows above-system. System credit growth (year to June 2012) was 4.4%, up from 2.8% in June 2011. The key driver has been business credit growth (to which BEN has little exposure), with housing credit growth in decline (both investor and owner-occupied), from 6% in June 2011 to 5.4% in December 2011 to 5.1% YTD. Charts 2-3. Table 3. CHART 2: TOTAL SYSTEM CREDIT GROWTH -10% 0% 10% 20% 30% Total Credit Housing Credit Business Credit Source: RBA CHART 3: HOUSING CREDIT GROWTH 0.0% 10.0% 20.0% 30.0% 40.0% Owner Occupied Housing Investor Housing Source: RBASource: RBA Source: APRA
- 5. 5 TABLE 3: BANKING MARET SHARE CHANGES CHART 4: BEN MORTGAGE MARKET SHARE GROWTH RELATIVE TO PEERS 4. Net interest margin Chart 5 illustrates the declining NIM. Chart 6 illustrates the sudden structural shift in Term Deposit pricing relative to the RBA cash rate, the key driver of NIM decline. BEN also incurred margin pressure due to its asset mix as its margin lending book significantly unwound during FY12 due to global volatility, reweighting the asset mix towards lower margin residential mortgages ($2.3bn in FY12 vs. $3.2bn in FY11). However, Table 4 summarises the sector’s out-of-cycle rate rises. BEN will continue to reprice its loans in line with its sector, and has greater leverage to this given its overweight residential mortgage book.
- 6. 6 CHART 5: NET INTEREST MARGIN CHART 6: AVERAGE TD PRICING v RBA CASH RATE -1.25 -1.00 -0.75 -0.50 -0.25 0.00 0.25 0.50 0.75 1.00 1.25 Source: RBA TABLE 4: OUT-OF-CYCLE RATE RISES Source: RBA; EAP Research
- 7. 7 FINANCIAL SUMMARY Bendigo and Adelaide Bank BEN As at: 21/08/2012 Recommendation: Neutral Share Price $8.68 Year end June 2011A 2012E 2013E 2014E INCOME STATEMENT Interest Income $m 3,466 3,516 3,558 3,822 Interest Expense $m (2,531) (2,571) (2,563) (2,749) Net Interest Income $m 935 944 995 1,073 Non Interest Income Fees & Commissions $m 237 221 215 222 Trading Income $m 0 0 0 0 Other Banking Income $m 58 60 66 66 Banking Non Interest Income $m 295 281 281 288 Wealth Management Income $m 0 0 0 0 Income/(Loss) from Associates $m 3 1 0 0 Total operating income $m 1,236 1,213 1,265 1,351 Operating Expenses Personnel Expenses $m (375) (388) (412) (429) Occupancy & Equipment $m (62) (66) (67) (70) Total Operating Expenses $m (767) (854) (805) (838) Pre Prov. Oper. Profit Before Tax $m 469 359 460 513 Bad debt charge $m (44) (32) (29) (52) Pre Tax Profit $m 425 326 431 461 Tax Expense $m (78) (131) (129) (138) Minorities $m (5) 0 0 0 Reported Profit Statutory $m 342 195 302 323 Cash earnings adjustment $m (6) 128 0 0 Reported Cash Profit $m 336 323 302 323 Preference Share Dividends $m (9) (9) (9) (8) E&P Normalised NPAT $m 328 315 294 314 E&P Cash EPS ¢ 89.9 82.0 73.0 78.2 Basic Cash EPS ¢ 92.3 84.2 75.1 80.3 Reported EPS ¢ 92.3 84.2 75.1 80.3 Dividend per Share ¢ 60.0 60.0 64.0 63.8 BALANCE SHEET Gross Loans & Other Receivables $m 46,021 48,832 52,266 55,988 Total Assets $m 56,452 61,947 66,808 71,320 Impaired Assets $m 286 280 272 268 Deposits & Other Pub. Borrowing $m 40,521 44,573 48,188 51,620 Bonds, notes & subordinat’d debt $m 10,465 11,512 12,445 13,332 Total Shareholder Equity $m 3,729 3,953 4,111 4,157 Avg housing loans $m 21,769 22,968 24,403 26,203 Avg non-housing loans $m 23,087 24,359 25,881 27,790 Avg total gross loans $m 44,856 47,328 50,284 53,993 Avg Interest Earning Assets $m 50,691 53,444 56,851 61,023 Avg Total Assets $m 54,168 57,110 60,517 64,688 Avg Interest Bearing Liabilities $m 48,192 50,823 53,406 56,827 Avg Total Liabilities $m 50,015 52,745 56,233 60,738 Avg Shareholders’ Equity $m 4,153 4,365 4,284 3,951 GROWTH RATES Per Share E&P Cash EPS % 10.7% (8.8)% (11.0)% 7.1% Basic Cash EPS % 10.8% (8.7)% (10.9)% 6.9% Dividend Per Share % 3.4% 0.0% 6.7% (0.3)% Profit & Loss Net Interest Income % 9.4% 1.0% 5.4% 7.9% Banking Non Interest Income % 4.5% (4.7)% (0.1)% 2.6% Wealth Management Income % N/A% N/A% N/A% N/A% Total Non Interest Income % 4.5% (4.7)% (0.1)% 2.6% Total Operating Income % 8.9% (1.9)% 4.3% 6.8% Operating Expenses % 3.7% 11.4% (5.8)% 4.0% Pre-Provision Profit % 18.5% (23.5)% 28.3% 11.5% Impairment Charges % (1.1)% (26.7)% (11.2)% 81.1% Cash Profit % 15.5% (3.9)% (6.5)% 6.9% Balance Sheet Gross Loans & Other Receivables % 5.3% 6.1% 7.0% 7.1% Total Shareholders’ Equity % (3.9)% 6.0% 4.0% 1.1% Average Balance Sheet Housing Loans % 7.9% 5.5% 6.2% 7.4% Non-Housing Loans % 7.9% 5.5% 6.2% 7.4% Avg Interest Earning Assets % 6.9% 5.4% 6.4% 7.3% Avg Interest Bearing Liabilities % 6.6% 5.5% 5.1% 6.4% Year end June 2011A 2012E 2013E 2014E VALUATION METRICS E&P Cash P/E Multiple x 9.4 10.3 11.6 10.8 Basic P/E Multiple x 9.7 10.6 11.9 11.1 Price/Pre-prov. operating profit x 6.8 9.7 7.6 6.8 NTA per share $ 5.7 5.7 6.1 6.3 Book Value per Share $ 10.2 9.8 10.2 10.3 Price/NTA x 1.5 1.5 1.4 1.4 Price/Book x 0.9 0.9 0.8 0.8 Dividend per Share ¢ 60.0 60.0 64.0 63.8 Dividend Payout Ratio x 0.7 0.7 0.9 0.8 Dividend Yield % 6.9% 6.9% 7.4% 7.4% Grossed Up Yield % 9.9% 9.9% 10.5% 10.5% Issued Shares m 367.1 402.2 402.2 402.2 Weighted Average Shares m 364.3 383.5 402.2 402.2 PERFORMANCE ANALYSIS Profitability Income / Avg Assets % 2.3% 2.1% 2.1% 2.1% Expense / Avg Assets % (0.1)% (0.2)% (0.2)% (0.2)% Return on Average Assets % 0.6% 0.6% 0.5% 0.5% Return on Ordinary Equity % 7.9% 7.4% 7.1% 8.2% Return on Risk Weighted Assets % 1.3% 1.1% 1.0% 1.0% Net Interest Margin Analysis Net Interest Spread % 1.6% 1.5% 1.5% 1.4% Net Interest Margin % 1.8% 1.8% 1.7% 1.8% Non Int. Income to Total Income % 24.3% 22.2% 21.4% 20.6% Efficiency Cost/Income % 62.1% 70.4% 63.6% 62.0% Tax Rate Effective tax rate % 18.4% 40.2% 30.0% 30.0% CAPITAL ADEQUACY Risk Weighted Assets $m 26,043 28,310 30,301 32,459 Tier 1 Capital $m 2,043 2,376 2,542 2,597 Total Capital $m 2,720 2,949 3,154 3,252 Tier 1 Ratio % 7.8% 8.4% 8.4% 8.0% Tier 2 Ratio % 2.6% 2.0% 2.0% 2.0% Total Capital Ratio % 10.4% 10.4% 10.4% 10.0% ACE Ratio % 8.3% 8.5% 7.7% 7.1% Tangible Leverage Ratio % 3.7% 3.7% 3.7% 3.5% ASSET QUALITY 90-day Past Due Loans $m 568 556 540 532 Non Performing Loans $m 854 836 812 800 NPL / Gross Loans and Other Rec % 1.9% 1.7% 1.6% 1.4% Total Provisions $m 154 640 142 152 Total Prov. / Gr. Loans & Oth Rec % 0.3% 1.3% 0.3% 0.3% Individual Provision $m 42 32 37 39 Individual Provision Cover % 14.7% 11.4% 13.5% 14.6% Collective Provision $m 112 608 105 112 Collective Prov. / Perform. Loans % 0.2% 1.3% 0.2% 0.2% Impairment Charges / Avg RWA % 0.2% 0.1% 0.1% 0.2% Imp Assets / Gr. Loans & Oth Rec % 0.6% 0.6% 0.5% 0.5% Impaired asset coverage % 14.7% 11.4% 13.5% 14.6% Collective Provision / RWA % 0.4% 2.1% 0.3% 0.3% BDD / Gr. loans and Oth Rec % 0.1% 0.1% 0.1% 0.1% WEALTH MANAGEMENT Funds Under Administration $m 0 0 0 0 Inforce Premiums $m 0 0 0 0 Funds Mgt Revenue Margin % 0.0% 0.0% 0.0% 0.0% Life Insurance Revenue margin % 0.0% 0.0% 0.0% 0.0% Shareholder Invest. Returns % 0.0% 0.0% 0.0% 0.0%
- 8. 8 RESEARCH RECOMMENDATION DEFINITIONS Positive Stock is expected to outperform the S&P/ASX 200 over the coming 24 months Neutral Stock expected to perform in line with the S&P/ASX 200 over the coming 24 months Negative Stock is expected to underperform the S&P/ASX 200 over the coming 24 months Speculative Stock has limited history from which to derive a fundamental investment view or its prospects are highly dependent on event risk, eg. Successful exploration, scientific breakthrough, high commodity prices, regulatory change, etc. Suspended Stock is temporarily suspended due to compliance with applicable regulatory and/or Evans & Partners policies in circumstances where Evans & Partners is acting in an advisory capacity. Not Rated Stock is not included in our investment research universe. Research Criteria Definitions Recommendations are primarily determined with reference to how a stock ranks relative to the S&P/ASX 200 on the following criteria: Valuation Rolling 12 month prospective multiples (composite of Price-to-Earnings Ratio, Dividend Yield and EV/EBITDA), or long-term NPV for resource stocks. Earnings Outlook Forecast 2 year EPS growth. Earnings Momentum Percentage change in the current consensus EPS estimate for the stock (rolling 1 year forward basis) over the consensus EPS estimate for the stock 3 months ago. Shareholder Returns Composite of forecast ROE (rolling 1 year forward basis) and the percentage change in ROE over 2 years. Debt Servicing Capacity Rolling 12 month EBIT Interest Cover ratio. Cyclical Risk Qualitative assessment of the 2 year outlook for a stock/industry’s profit cycle. Industry Quality Qualitative assessment of an industry’s growth/returns potential and company specific management capability. Financial Transparency If we don’t understand it, we won’t recommend it. For stocks where Evans & Partners does not generate its own forecasts, Bloomberg consensus data is used. Analysts can introduce other factors when determining their recommendation, with any material factors stated in the written research where appropriate.
- 9. 9 GENERAL RESEARCH DISCLAIMER, WARNING & DISCLOSURES This document is provided by Evans and Partners ABN 85 125 338 785, holder of AFSL 318075. The information is general advice only and does not take into consideration an investor’s objectives, financial situation or needs. Before acting on the advice, investors should consider the appropriateness of the advice, having regard to the investor’s objectives, financial situation and needs. If the advice relates to a financial product that is the subject of a Product Disclosure Statement (e.g. unlisted managed funds) investors should obtain the PDS and consider it before making any decision about whether to acquire the product. The material contained in this document is for information purposes only and does not constitute an offer, solicitation or recommendation with respect to the purchase or sale of securities. It should not be regarded by recipients as a substitute for the exercise of their own judgment. Investors should be aware that past performance is not an infallible indicator of future performance and future returns are not guaranteed. Any opinions and/or recommendations expressed in this material are subject to change without notice and Evans and Partners is not under any obligation to update or keep current the information contained herein. References made to third parties are based on information believed to be reliable but are not guaranteed as being accurate. This document is provided to the recipient only and is not to be distributed to third parties without the prior consent of Evans and Partners. EVANS AND PARTNERS DISCLOSURE OF INTERESTS Evans and Partners and its respective officers and associates may have an interest in the securities or derivatives of any entities referred to in this material. Evans and Partners does, and seeks to do, business with companies that are the subject of its research reports. EVANS AND PARTNERS CORPORATE RELATIONSHIP DISCLOSURE AFI: Evans and Partners have arranged, managed or co-managed a public offering of the company or its affiliates in the past 12 months. AYUHA: Evans and Partners have arranged, managed or co-managed a public offering of the company or its affiliates in the past 12 months. BHP: A director of Evans and Partners Pty Ltd Advisory Board is a director of BHP Billiton Ltd. BSL: A director of Evans and Partners Pty Ltd Advisory Board is a director of BlueScope Steel Ltd. BOQ, BOQPA, BOQPC: A director of Evans and Partners Pty Ltd Advisory Board is a director of Bank of Queensland. CNGHA: Evans and Partners managed or co-managed a public offering of securities of the company or its affiliates in the past 12 months. HBSHB: Evans and Partners managed or co-managed a public offering of securities of the company or its affiliates in the past 12 months. HHY: Evans and Partners has been appointed by the Issuer as Broker to an on-market buy-back. Accordingly, Evans and Partners is unable to give Sellers advice in respect to a sale of this security. LLC: A director of Evans and Partners Pty Ltd Advisory Board is a director of Lend Lease Corporation Ltd. MEF: Evans and Partners has been appointed by the Issuer as Broker to an on-market buy-back. Accordingly, Evans and Partners is unable to give Sellers advice in respect to a sale of this security. MQG: MQCPA: A director of Evans and Partners Pty Ltd Advisory Board is a director of Macquarie Group Ltd. MGR: A director of Evans and Partners Pty Ltd Advisory Board is a director of Mirvac Group. ORG: A director of Evans and Partners Pty Ltd Advisory Board is a director of Origin Energy Ltd. PPC: Evans and Partners managed or co-managed a public offering of securities of the company or its affiliates in the past 12 months. OOH: Evans and Partners have arranged, managed or co-managed a public offering of the company or its affiliates in the past 12 months. SAR: Evans and Partners managed or co-managed a public offering of securities of the company or its affiliates in the past 12 months. SPT: Evans and Partners acted in an advisory capacity for the bidder in relation to the proposed offer made to Spotless Group as announced 9 May 2011. TTSHA: Evans and Partners managed or co-managed a public offering of securities of the company or its affiliates in the past 12 months. TOX: Evans and Partners managed or co-managed a public offering of securities of the company or its affiliates in the past 12 months. RESEARCH ANALYST CERTIFICATION I, George Gabriel, CFA, hereby certify that all the views expressed in this report accurately reflect my personal views about the subject investment theme &/or company securities. I also certify that no part of my compensation was, is, or will be, directly or indirectly, related to the specific recommendations or views expressed in this report. RESEARCH ANALYST DISCLOSURE OF INTEREST I, George Gabriel, CFA, &/or entities in which I have a pecuniary interest, have an exposure to the following securities &/or managed products: TGA. DISCLAIMER Except for any liability which cannot be excluded, Evans & Partners, its directors, employees & agents accept no liability or responsibility whatsoever for any loss or damage of any kind, direct or indirect, arising out of the use of all or any part of this material. All information is correct at the time of publication; additional information may be available upon request.