SlideShare a Scribd company logo
1 of 11
Download to read offline
Stock Focus
Bank of Queensland (BOQ)
1
LEADING INDICATORS POINT TO MORE BAD DEBT DOWNSIDE RISK
RECOMMENDATION : NEGATIVE
WHAT’S NEW?
 Underlying impaired loans are increasing. We look through the
decline in “headline” impaireds and observe that (i) <30 day overdue
stressed commercial loans increased 12% from FY11 to FY12. Table 2.
Charts 1-2; and (ii) impaireds/total loans increased in 86% of the loan
portfolio. Chart 2.
 Broad-based asset quality deterioration emerging. The key driver
of impaired loan growth in 2H12 was loans <$5m, which increased 18%
to $178m and comprised 88% of new impaireds. Table 1. Chart 3.
 Provision coverage is deteriorating. Collective provision/total loans
is down from 0.94% to 0.77% in 2H12, with declining CP coverage in
home loans, lines of credit and leasing segments (all of which are
vulnerable to further cyclical downside). Tables 3-4.
 Dividend downside risks emerging. We expect the payout ratio to
come under increasing scrutiny, with the Board expected to review the
former management’s 50-60% payout ratio target.
WHAT’S CHANGED?
 FY13F EPS down -8% to 79cps; FY14F EPS down -20% to 79cps.
 FY13F DPS down -10% to 52cps; FY14F DPS down -9% to 52cps.
WHAT NOW?
Key risks include:
 Cyclical risks - loan loss rates exceed our estimates as the Queensland
economy deteriorates.
 Structural risks – (i) margins vulnerable to increased competition
(in deposit and lending markets); (ii) broker-driven loan growth
strategy outside Qld raises medium-term asset quality concerns; and
(iii) uncompetitive funding structure without offsetting pricing
power driven by the sector’s lowest credit rating of BBB+ (vs
comparable BEN of A- and major banks if AA-).
We remain Negative, with blended valuation $6.72 (prev. $6.51).
Trading Data
Last Price $7.46
12 month range $6.15 - $8.30
Market Cap $2,310m
Free Float $2,003m (87%)
Avg. Daily Volume 1.2m
Avg. Daily Value $9.3m
12 month return (historical) 1.1%
“Key management target” of 1.0x system
growth in Retail and Business in FY13F and
1.2x Retail system and 1.5x Business
System in FY15F.
Vulnerable to further margin downside as
BBB+ rating results in uncompetitive
wholesale funding compared to AA- rated
major banks and A- regional bank BEN.
Also, BOQ has the sector’s lowest deposit
funding mix of 57%.
Earnings Forecasts
Yr to August 09A 10A 11A 12E 13E 14E
E&P Cash EPS (¢) 110.5 92.5 74.3 (6.8) 78.7 78.8
Basic Cash EPS (¢) 110.5 92.5 74.3 (6.8) 78.7 78.8
Reported EPS (¢) 75.9 80.6 68.0 (10.1) 76.6 76.7
E&P Cash EPS Growth (%) 0.9 (16.2) (19.7) N/A N/A 0.2
DPS (¢) 52.0 52.0 54.0 52.0 51.5 51.9
Yield (%) 7.0 7.0 7.2 7.0 6.9 6.9
Grossed-Up Yield (%) 9.9 9.9 10.3 9.9 9.8 9.9
Franking (%) 100% 100% 100% 100% 100% 100%
E&P Cash Multiple (x) 6.8 8.1 10.0 - 9.5 9.5
Price/Book (x) 0.7 0.7 0.7 0.8 0.8 0.8
PEG Ratio (x) (0.2) (0.1) 1.7
Net Interest Margin (%) 1.6 1.6 1.6 1.7 1.6 1.6
Return on Average Assets (%) 0.6 0.5 0.4 0.0 0.6 0.5
ROE (%) 10.8 8.5 6.6 (0.6) 9.5 9.0
Valuation (blended) 6.72
George Gabriel, CFA
ggabriel@evansandpartners.com.au
October 23, 2012
+61 3 9631 9853
2
UNDERLYING ASSET QUALITY AND PROVISION COVERAGE IS DECLINING
Historically, the time to buy banks working through a bad debt cycle is when the rate of
impaired loan growth slows (ie. “negative second derivative”). However, in the case of BOQ,
we look through the headline decline in impaired loan growth and observe evidence
of underlying asset quality deterioration:
(i) Underlying impaired loans are increasing, despite the decline in “headline” impaireds.
(ii) Broad-based deterioration in the loan book is emerging.
(iii) Leading indicators of asset quality raise “red flags”.
(iv) Provision coverage is deteriorating.
(v) The Queensland macroeconomic backdrop is deteriorating.
We explain these points in more detail below.
(i) Underlying impaired loans are increasing
BOQ highlighted that its total impaired asset balance declined from $578.7m in 1H12 to
$525.3m in 2H12. Chart 1. However, the underlying trends are:
 Total impaireds increased to $781.5m (up 35.0%) prior to property realisations and
the sale of ~$156m of impaired property to Goldman Sachs on 17 July 2012 (reported to
be at a 62% discount to face value). Chart 1.
 Impaireds/total loans increased in 86% of the loan portfolio: housing (60% total
loans), lines of credit (15% total loans) and leasing (11% total loans). Lines of credit
arrears increase was significant, up from 0.88% to 1.79% of total loans. Chart 2.
CHART 1: IMPAIRED LOAN BALANCES
Source: BOQ Presentation
3
CHART 2: IMPAIRED LOAN TRENDS
Source: EAP Research
(ii) Broad-based loan book deterioration
BOQ’s impaired loan cycle has progressed from large exposures to a more broadly-
based portfolio deterioration, indicating that the macroeconomic cycle could drive
further bad debts across these loan portfolios.
 88% of new impaired loans are <$5m in value in 2H12 (compared to 30% in 1H11),
which increased by 18% in 2H12. Table 1. Chart 3.
 Management has guided that two-thirds of the next period’s bad debts will be from their
retail loan book (housing and lines of credit).
TABLE 1: IMPAIRED LOAN TRENDS
Source: EAP Research
4
CHART 3: NEW IMPAIRED LOANS
Source: BOQ Presentation
(iii) Leading indicators of asset quality
The key “red flag” is that commercial loans less than 30 days past due are
increasing, up 12% in FY12 (vs FY11). This is a key area to watch. Table 2.
TABLE 2: ASSET QUALITY LEADING INDICATORS
BOQ stressed loans trend analysis (A$m) FY10 FY11 FY12
% growth
FY11-
FY10
% growth
FY12-
FY11
Retail 826 677 652 -18% -4%
Commercial 246 207 231 -16% 12%
Less than 30 days past due (DPD) 1,072 884 883 -18% 0%
Retail 139 254 163 82% -36%
Commercial 131 108 93 -17% -14%
31 to 90 days past due (DPD) 270 362 256 34% -29%
Retail 186 318 232 71% -27%
Commercial 142 165 115 16% -30%
More than 90 days past due (90 DPD) 327 483 347 47% -28%
Total loans past due but not impaired 1,669 1,729 1,486 4% -14%
Impaired loans 148 444 525 201% 18%
Loans past due and impaired 1,817 2,173 2,011 20% -7%
Gross loans and advances 32,439 34,065 35,005 5% 3%
(90 DPD + impaired)/gross loans 1.46% 2.72% 2.49%
(Past due + impaired)/gross loans 5.6% 6.4% 5.7%
Source: Company Reports; EAP Research
5
(iv) Provision coverage is deteriorating
We believe that there is potential for increased provisioning because (i) underlying impaireds
are increasing, and (ii) provision coverage is declining.
 Collective provision/total loans down from 0.94% in 1H12 to 0.77% in 2H12, with
reduced coverage in home loans, lines of credit and leasing segments. Tables 3-4.
 Specific provision coverage down from 43.0% to 41.9%. BOQ reportedly sold some
distressed property loans to Goldman Sachs at a 62% discount to face value. If this
discount is applied to BOQ’s existing impaired commercial loans, this implies ~$48m in
additional losses.
TABLE 3: BOQ LOAN PROVISIONING PER SEGMENT AS AT 2H12
Segment Description
Value
(A$bn)
% total
loans
%
impaired
Collective
Provision
(A$m)
Specific
Provision
(A$m)
Impaired
loans
(A$m)
Specific/
impaired
(%)
CP/net
loans (%)
Total
Provision/Loans
ratio
Home Loans 60% Qld, 16% Vic, 13% NSW, 8% WA 20.3 59.5% 0.61% 26 41.3 123.9 33.3% 0.13% 0.33%
Lines of credit Secured by resi mortgages 5 14.7% 1.79% 14.1 32.7 89.5 36.5% 0.29% 0.94%
Commercial SME segment 5.1 15.0% 5.58% 121.1 127.9 284.4 45.0% 2.51% 4.88%
Leasing BOQ Equipment Finance 3.7 10.9% 0.71% 26.9 17.6 26.3 66.9% 0.73% 1.20%
Provision overlays (GRCL) 70.2
Total 34.1 100.0% 258.3 219.5 524.1 41.9% 0.77% 1.40%
Source: EAP Research
TABLE 4: BOQ LOAN PROVISIONING PER SEGMENT AS AT 1H12
Segment Description
Value
(A$bn)
% total
loans
%
impaired
Collective
Provision
(A$m)
Specific
Provision
(A$m)
Impaired
loans
(A$m)
Specific/
impaired
(%)
CP/net
loans (%)
Total
Provision/Loans
(%)
Home Loans 60% Qld, 16% Vic, 13% NSW, 8% WA 19.4 57.7% 0.46% 37.9 27.6 88.6 31.2% 0.20% 0.34%
Lines of credit Secured by resi mortgages 5.2 15.5% 0.88% 22.8 19.1 45.5 42.0% 0.44% 0.81%
Commercial SME segment 5.3 15.8% 8.00% 156.6 187.9 424.2 44.3% 3.21% 6.50%
Leasing BOQ Equipment Finance 3.7 11.0% 0.53% 20.3 13.9 19.7 70.6% 0.55% 0.92%
Provision overlays (GRCL) 74.4
Total 33.6 100.0% 312 248.5 578 43.0% 0.94% 1.67%
Source: EAP Research
Furthermore, we believe the disclosed “key management targets” of 28-34bps in bad debts to
gross loans in FY13F normalising to 20bp in FY15 is optimistic, given it will likely take more
time for changes to risk appetite at the front end of the book to work through the whole book
and reduce the average portfolio loss rates. Chart 4.
6
CHART 4: KEY MANAGEMENT TARGETS
Source: BOQ Presentation
(v) Queensland downside risks prevail
The CEO has previously referred to stresses in the SE Queensland property market, with price
declines of 50-60%. Refer EAP Note, “SE Queensland Property – Slowing One Day...Declining
the Next”, dated 9 October 2012.
At the FY12 results analyst briefing, he commented that whilst property clearance rates were
improved, it is still too early to call a market bottom.
7
BLENDED VALUATION
Our $6.72 blended valuation reflects the risks of BOQ’s narrow business and geographical mix,
near-term credit quality and operational concerns and long-term structural funding
disadvantages. Table 5.
Our 30% discount to the price/book value and 9.0x FY13F PE multiple are consistent with
depressed trading historical multiple ranges and have been selected to incorporate suitable
margin of safety discounts which we believe are warranted before investors should consider
investing in BOQ. Chart 5-6.
TABLE 5: BLENDED VALUATION
Method Key Inputs Value ($)
Discounted cash flow 11% Discount Rate $6.92
Price/book value 0.70x FY13F and FY14F $6.57
Dividend yield/bond yield 1.6x 5.5% bond yield $6.26
PE valuation FY13F PE of 9.0x $7.12
Average $6.72
Source: EAP Research
CHART 5: HISTORICAL PRICE/EARNINGS CHART 6: HISTORICAL PRICE/BOOK MULTIPLE
Source: Factset
8
FY12 RESULT SUMMARY
Key result highlights are:
 Net interest income increased +1.4% as average interest earning assets
increased +1.35% and net interest margin remained steady at 1.66% over FY12.
Table 6. NIM will benefit in 1H13 from the full period impact of BOQ’s +25bp out-of-cycle
rate rises on the RBA rate cuts in May (-50bp), June (-25bp) and October (-25bp).
 Reasonable +2.8% growth in operating income, driven by other banking income
(+10.8%, fees and commissions; BOQ Finance); and net insurance income (+4.5%).
 Disappointing cost performance, with +14.5% expense growth and a 55.3% cost-to-
income ratio, driven by increased employee costs (+11.3%, FTE -10 to 1,448), IT costs
and occupancy costs. Negative “jaws” for two consecutive halves is a concern (-
6.4% and -11.7% in 1H12 and 2H12).
 Capital position largely stable - at 8.5% core tier 1 capital (versus 1H12 pro-
forma 8.6%), at the top end of peer range.
TABLE 6: GROUP PERFORMANCE
Group Performance
1H09 2H09 1H10 2H10 1H11 2H11 1H12 2H12
1H10-
2H10
2H10-
1H11
1H11-
2H11
2H11-
1H12
1H12-
2H12
Interest Income 1098 933 1004 1233 1315 1362 1327 1270 22.8% 6.6% 3.6% -2.6% -4.3%
Interest Expense -872 -678 -729 -947 -1005 -1049 -1003 -942 29.9% 6.1% 4.4% -4.3% -6.1%
Net Interest Income 227 255 275 286 310 313 324 328 3.9% 8.5% 1.0% 3.3% 1.4%
Other Banking Income 77 71 68 75 61 71 53 59 9.9% -18.0% 15.8% -25.4% 10.8%
Net Banking Operating Income 304 325 343 360 371 384 376 387 5.1% 3.1% 3.5% -2.0% 2.7%
Net Insurance Op. Income 0 0 0 7 19 22 20 21 10.8% -6.0% 4.5%
Total Operating Income 304 325 343 368 391 406 397 408 7.2% 6.3% 3.8% -2.2% 2.8%
Other Expenses -212 -158 -161 -187 -185 -189 -197 -226 -16.5% 1.3% -2.2% -4.2% -14.5%
Pre-prov Operating Profit 92 167 182 180 206 217 200 182 -0.9% 14.1% 5.3% -7.8% -8.8%
Bad Debts Expense -28 -38 -51 -53 -134 -66 -328 -73 -2.7% -154.5% 50.8% -395.8% 77.6%
Profit Before Tax 64 129 131 128 71 151 -128 109 -2.4% -44.1% 111.1% -185.1% -184.9%
Income Tax -18 -34 -40 -37 -21 -42 38 -35
Statutory NPAT 46 95 91 91 50 108 -91 73 0.1% -44.6% 114.9% -183.7% -181.1%
Adjustments 34 12 2 13 5 13 18 30
Normalised NPAT 81 107 93 104 54.9 121.7 -72.4 103 11.1% -47.1% 121.7% -159.5% -242.3%
Source: BOQ reports
Growth ratesNormalised Earnings
9
FINANCIAL SUMMARY
Bank of Queensland BOQ
As at: 23/10/2012 Recommendation: Negative Share Price $7.46
Year end August 2011A 2012E 2013E 2014E
INCOME STATEMENT
Interest Income $m 2,677 2,596 2,483 2,715
Interest Expense $m (2,053) (1,945) (1,821) (2,029)
Net Interest Income $m 623 652 662 686
Non Interest Income
Fees & Commissions $m 135 120 156 149
Trading Income $m 0 0 0 0
Other Banking Income $m (3) (9) (9) (10)
Banking Non Interest Income $m 132 112 147 139
Wealth Management Income $m 0 0 0 0
Income/(Loss) from Associates $m 0 0 0 0
Total operating income $m 796 804 861 887
Operating Expenses
Personnel Expenses $m (155) (166) (154) (154)
Occupancy & Equipment $m (94) (117) (111) (114)
Total Operating Expenses $m (374) (423) (398) (404)
Pre Prov. Oper. Profit Before Tax $m 422 382 463 483
Bad debt charge $m (201) (401) (114) (131)
Pre Tax Profit $m 222 (19) 349 352
Tax Expense $m (63) 2 (105) (106)
Minorities $m 0 0 0 0
Reported Profit Statutory $m 159 (17) 245 246
Cash earnings adjustment $m 14 9 6 7
Reported Cash Profit $m 165 (18) 243 243
Preference Share Dividends $m (8) (10) (8) (10)
E&P Normalised NPAT $m 165 (18) 243 243
E&P Cash EPS ¢ 74.3 (6.8) 78.7 78.8
Basic Cash EPS ¢ 74.3 (6.8) 78.7 78.8
Reported EPS ¢ 68.0 (10.1) 76.6 76.7
Dividend per Share ¢ 54.0 52.0 51.5 51.9
BALANCE SHEET
Gross Loans & Other Receivables $m 34,065 35,004 36,181 37,886
Total Assets $m 39,901 41,758 43,902 46,182
Impaired Assets $m 444 525 400 327
Deposits & Other Pub. Borrowing $m 36,278 37,860 39,985 42,093
Bonds, notes & subordinat’d debt $m 0 0 0 0
Total Shareholder Equity $m 2,574 2,899 2,862 2,979
Avg housing loans $m 23,192 24,755 25,477 26,891
Avg non-housing loans $m 9,485 9,306 9,578 10,110
Avg total gross loans $m 32,678 34,061 35,055 37,001
Avg Interest Earning Assets $m 38,174 39,410 40,876 43,093
Avg Total Assets $m 38,975 40,687 42,200 44,489
Avg Interest Bearing Liabilities $m 35,740 36,774 38,910 41,041
Avg Total Liabilities $m 36,483 37,515 39,651 41,783
Avg Shareholders’ Equity $m 2,492 3,172 2,549 2,707
GROWTH RATES
Per Share
E&P Cash EPS % (19.7)% N/A% N/A% 0.2%
Basic Cash EPS % (19.7)% N/A% N/A% 0.2%
Dividend Per Share % 3.8% (3.7)% (1.0)% 0.8%
Profit & Loss
Net Interest Income % 11.0% 4.5% 1.6% 3.7%
Banking Non Interest Income % (0.1)% (15.6)% 31.9% (5.5)%
Wealth Management Income % N/A% N/A% N/A% N/A%
Total Non Interest Income % (0.1)% (15.6)% 31.9% (5.5)%
Total Operating Income % 12.0% 1.0% 7.1% 3.0%
Operating Expenses % 7.5% 13.0% (5.8)% 1.6%
Pre-Provision Profit % 16.3% (9.6)% 21.4% 4.2%
Impairment Charges % 92.4% 100.0% (71.6)% 14.8%
Cash Profit % (16.3)% N/A% N/A% 0.2%
Balance Sheet
Gross Loans & Other Receivables % 5.0% 2.8% 3.4% 4.7%
Total Shareholders’ Equity % 7.1% 12.7% (1.3)% 4.1%
Average Balance Sheet
Housing Loans % 10.3% 6.7% 2.9% 5.6%
Non-Housing Loans % 4.7% (1.9)% 2.9% 5.6%
Avg Interest Earning Assets % 8.7% 3.2% 3.7% 5.4%
Avg Interest Bearing Liabilities % 8.2% 2.9% 5.8% 5.5%
Year end August 2011A 2012E 2013E 2014E
VALUATION METRICS
E&P Cash P/E Multiple x 10.0 - 9.5 9.5
Basic P/E Multiple x 10.0 - 9.5 9.5
Price/Pre-prov. operating profit x 4.0 6.0 5.0 4.8
NTA per share $ 8.8 7.6 7.5 7.7
Book Value per Share $ 11.4 9.4 9.3 9.5
Price/NTA x 0.8 1.0 1.0 1.0
Price/Book x 0.7 0.8 0.8 0.8
Dividend per Share ¢ 54.0 52.0 51.5 51.9
Dividend Payout Ratio x 0.7 (7.6) 0.7 0.7
Dividend Yield % 7.2% 7.0% 6.9% 6.9%
Grossed Up Yield % 10.3% 9.9% 9.8% 9.9%
Issued Shares m 225.4 308.8 308.8 313.5
Weighted Average Shares m 221.9 263.8 308.8 308.8
PERFORMANCE ANALYSIS
Profitability
Income / Avg Assets % 2.0% 2.0% 2.0% 2.0%
Expense / Avg Assets % 0.2% 0.0% 0.2% 0.2%
Return on Average Assets % 0.4% 0.0% 0.6% 0.5%
Return on Ordinary Equity % 6.6% (0.6)% 9.5% 9.0%
Return on Risk Weighted Assets % 0.8% (0.1)% 1.1% 1.1%
Net Interest Margin Analysis
Net Interest Spread % 1.3% 1.3% 1.4% 1.4%
Net Interest Margin % 1.6% 1.7% 1.6% 1.6%
Non Int. Income to Total Income % 21.7% 19.0% 23.1% 22.6%
Efficiency
Cost/Income % 47.0% 52.5% 46.2% 45.6%
Tax Rate
Effective tax rate % 28.4% 11.4% 30.0% 30.0%
CAPITAL ADEQUACY
Risk Weighted Assets $m 20,525 21,098 21,247 22,236
Tier 1 Capital $m 1,718 1,998 2,033 2,150
Total Capital $m 2,343 2,657 2,707 2,865
Tier 1 Ratio % 8.4% 9.5% 9.6% 9.7%
Tier 2 Ratio % 3.1% 3.1% 3.2% 3.2%
Total Capital Ratio % 11.4% 12.6% 12.7% 12.9%
ACE Ratio % 6.7% 8.9% 8.6% 8.4%
Tangible Leverage Ratio % 5.0% 5.6% 5.3% 5.2%
ASSET QUALITY
90-day Past Due Loans $m 483 347 264 216
Non Performing Loans $m 444 525 400 327
NPL / Gross Loans and Other Rec % 1.3% 1.5% 1.1% 0.9%
Total Provisions $m 254 413 138 (115)
Total Prov. / Gr. Loans & Oth Rec % 0.7% 1.2% 0.4% (0.3)%
Individual Provision $m 174 220 (28) (266)
Individual Provision Cover % 39.1% 41.9% (7.0)% (81.6)%
Collective Provision $m 80 193 166 151
Collective Prov. / Perform. Loans % 0.2% 0.6% 0.5% 0.4%
Impairment Charges / Avg RWA % 1.0% 1.9% 0.5% 0.6%
Imp Assets / Gr. Loans & Oth Rec % 1.3% 1.5% 1.1% 0.9%
Impaired asset coverage % 39.1% 41.9% (7.0)% (81.6)%
Collective Provision / RWA % 0.4% 0.9% 0.8% 0.7%
BDD / Gr. loans and Oth Rec % 0.6% 1.1% 0.3% 0.3%
WEALTH MANAGEMENT
Funds Under Administration $m 0 0 0 0
Inforce Premiums $m 0 0 0 0
Funds Mgt Revenue Margin % 0.0% 0.0% 0.0% 0.0%
Life Insurance Revenue margin % 0.0% 0.0% 0.0% 0.0%
Shareholder Invest. Returns % 0.0% 0.0% 0.0% 0.0%
10
RESEARCH RECOMMENDATION DEFINITIONS
Positive Stock is expected to outperform the S&P/ASX 200 over the coming 24 months
Neutral Stock expected to perform in line with the S&P/ASX 200 over the coming 24 months
Negative Stock is expected to underperform the S&P/ASX 200 over the coming 24 months
Speculative Stock has limited history from which to derive a fundamental investment view or its prospects
are highly dependent on event risk, eg. Successful exploration, scientific breakthrough, high
commodity prices, regulatory change, etc.
Suspended Stock is temporarily suspended due to compliance with applicable regulatory and/or Evans &
Partners policies in circumstances where Evans & Partners is acting in an advisory capacity.
Not Rated Stock is not included in our investment research universe.
Research Criteria Definitions
Recommendations are primarily determined with reference to how a stock ranks relative to the S&P/ASX 200 on
the following criteria:
Valuation Rolling 12 month prospective multiples (composite of Price-to-Earnings Ratio, Dividend
Yield and EV/EBITDA), or long-term NPV for resource stocks.
Earnings Outlook Forecast 2 year EPS growth.
Earnings Momentum Percentage change in the current consensus EPS estimate for the stock (rolling 1 year
forward basis) over the consensus EPS estimate for the stock 3 months ago.
Shareholder Returns Composite of forecast ROE (rolling 1 year forward basis) and the percentage change in
ROE over 2 years.
Debt Servicing Capacity Rolling 12 month EBIT Interest Cover ratio.
Cyclical Risk Qualitative assessment of the 2 year outlook for a stock/industry’s profit cycle.
Industry Quality Qualitative assessment of an industry’s growth/returns potential and company specific
management capability.
Financial Transparency If we don’t understand it, we won’t recommend it.
For stocks where Evans & Partners does not generate its own forecasts, Bloomberg consensus data is used.
Analysts can introduce other factors when determining their recommendation, with any material factors stated in
the written research where appropriate.
11
GENERAL RESEARCH DISCLAIMER, WARNING & DISCLOSURES
This document is provided by Evans and Partners ABN 85 125 338 785, holder of AFSL 318075.
The information is general advice only and does not take into consideration an investor’s objectives, financial situation or needs. Before
acting on the advice, investors should consider the appropriateness of the advice, having regard to the investor’s objectives, financial
situation and needs. If the advice relates to a financial product that is the subject of a Product Disclosure Statement (e.g. unlisted
managed funds) investors should obtain the PDS and consider it before making any decision about whether to acquire the product.
The material contained in this document is for information purposes only and does not constitute an offer, solicitation or recommendation
with respect to the purchase or sale of securities. It should not be regarded by recipients as a substitute for the exercise of their own
judgment. Investors should be aware that past performance is not an infallible indicator of future performance and future returns are
not guaranteed.
Any opinions and/or recommendations expressed in this material are subject to change without notice and Evans and Partners is not under
any obligation to update or keep current the information contained herein. References made to third parties are based on information
believed to be reliable but are not guaranteed as being accurate.
This document is provided to the recipient only and is not to be distributed to third parties without the prior consent of Evans and
Partners.
EVANS AND PARTNERS DISCLOSURE OF INTERESTS
Evans and Partners and its respective officers and associates may have an interest in the securities or derivatives of any entities referred
to in this material.
Evans and Partners does, and seeks to do, business with companies that are the subject of its research reports.
EVANS AND PARTNERS CORPORATE RELATIONSHIP DISCLOSURE
AFI: Evans and Partners have arranged, managed or co-managed a public offering of the company or its affiliates in the past 12 months.
AQHHA: Evans and Partners have arranged, managed or co-managed a public offering of the company or its affiliates in the past 12
months.
BENPD: Evans and Partners managed or co-managed a public offering of securities of the company or its affiliates in the past 12 months.
BHP: A director of Evans and Partners Pty Ltd Advisory Board is a director of BHP Billiton Ltd.
BSL: A director of Evans and Partners Pty Ltd Advisory Board is a director of BlueScope Steel Ltd.
BOQ, BOQPA, BOQPC: A director of Evans and Partners Pty Ltd Advisory Board is a director of Bank of Queensland.
CNGHA: Evans and Partners managed or co-managed a public offering of securities of the company or its affiliates in the past 12 months.
HBSHB: Evans and Partners managed or co-managed a public offering of securities of the company or its affiliates in the past 12 months.
HHY: Evans and Partners has been appointed by the Issuer as Broker to an on-market buy-back. Accordingly, Evans and Partners is
unable to give Sellers advice in respect to a sale of this security.
LLC: A director of Evans and Partners Pty Ltd Advisory Board is a director of Lend Lease Corporation Ltd.
MQG: MQCPA: A director of Evans and Partners Pty Ltd Advisory Board is a director of Macquarie Group Ltd.
MGR: A director of Evans and Partners Pty Ltd Advisory Board is a director of Mirvac Group.
NXT: Evans and Partners has been appointed as Lead Manager to the proposed IPO of the Asia Pacific Data Centre Trust by NXT and
expects to receive fees for acting in this capacity.
ORG: A director of Evans and Partners Pty Ltd Advisory Board is a director of Origin Energy Ltd.
OOH: Evans and Partners have arranged, managed or co-managed a public offering of the company or its affiliates in the past 12 months.
SAR: Evans and Partners managed or co-managed a public offering of securities of the company or its affiliates in the past 12 months.
SPT: Evans and Partners acted in an advisory capacity for the bidder in relation to the proposed offer made to Spotless Group as
announced 9 May 2011.
SWM: A director of Evans and Partners Pty Ltd Board is a director of Seven West Media Ltd.
TTSHA: Evans and Partners managed or co-managed a public offering of securities of the company or its affiliates in the past 12 months.
TOX: Evans and Partners managed or co-managed a public offering of securities of the company or its affiliates in the past 12 months.
WHF: Evans and Partners managed or co-managed a public offering of securities of the company or its affiliates in the past 12 months.
RESEARCH ANALYST CERTIFICATION
I, George Gabriel, CFA, hereby certify that all the views expressed in this report accurately reflect my personal views about the subject
investment theme &/or company securities. I also certify that no part of my compensation was, is, or will be, directly or indirectly, related
to the specific recommendations or views expressed in this report.
RESEARCH ANALYST DISCLOSURE OF INTEREST
I, George Gabriel, CFA, &/or entities in which I have a pecuniary interest, have an exposure to the following securities &/or managed
products: TGA.
DISCLAIMER
Except for any liability which cannot be excluded, Evans & Partners, its directors, employees & agents accept no liability or responsibility
whatsoever for any loss or damage of any kind, direct or indirect, arising out of the use of all or any part of this material. All information
is correct at the time of publication; additional information may be available upon request.

More Related Content

What's hot

lvs q217 earnings deck
lvs q217 earnings decklvs q217 earnings deck
lvs q217 earnings deckInvestor_lvs
 
Psx 2017 baml conference presentation final for posting
Psx 2017 baml conference presentation final for postingPsx 2017 baml conference presentation final for posting
Psx 2017 baml conference presentation final for postinginvestor_phillips66
 
JPM 2016 equity research
JPM 2016 equity researchJPM 2016 equity research
JPM 2016 equity researchAnthony Petalas
 
Hyundai card ir material (fy 2016 1 q) en
Hyundai card ir material (fy 2016 1 q) enHyundai card ir material (fy 2016 1 q) en
Hyundai card ir material (fy 2016 1 q) enHyundai Finance
 
Visa inc. q4 and fy 2017 financial results conference call presentation
Visa inc. q4 and fy 2017 financial results conference call presentationVisa inc. q4 and fy 2017 financial results conference call presentation
Visa inc. q4 and fy 2017 financial results conference call presentationvisainc
 
Ccal 2 q12_ing
Ccal 2 q12_ingCcal 2 q12_ing
Ccal 2 q12_ingItauRI
 
2016 wells fargo no appendix
2016 wells fargo no appendix2016 wells fargo no appendix
2016 wells fargo no appendixir_styronllc
 
Abch results presentation 2012
Abch results presentation 2012Abch results presentation 2012
Abch results presentation 2012wgjlubbe
 
ING Vyasa Bank Q2FY14 Result: Maintain neutral
ING Vyasa Bank Q2FY14 Result: Maintain neutralING Vyasa Bank Q2FY14 Result: Maintain neutral
ING Vyasa Bank Q2FY14 Result: Maintain neutralIndiaNotes.com
 
xcel energy November 2008
xcel energy  November 2008 xcel energy  November 2008
xcel energy November 2008 finance26
 
3Q09 Results Conference Call
3Q09 Results Conference Call3Q09 Results Conference Call
3Q09 Results Conference CallKianne Paganini
 
Am website presentation april 2016
Am website presentation   april 2016Am website presentation   april 2016
Am website presentation april 2016anteromidstream
 
Genworth MI Canada Inc. – First Quarter 2013
Genworth MI Canada Inc. – First Quarter 2013Genworth MI Canada Inc. – First Quarter 2013
Genworth MI Canada Inc. – First Quarter 2013genworth_financial
 
asset_allocation 2009
asset_allocation 2009asset_allocation 2009
asset_allocation 2009Nino Boezio
 

What's hot (18)

lvs q217 earnings deck
lvs q217 earnings decklvs q217 earnings deck
lvs q217 earnings deck
 
Psx 2017 baml conference presentation final for posting
Psx 2017 baml conference presentation final for postingPsx 2017 baml conference presentation final for posting
Psx 2017 baml conference presentation final for posting
 
JPM 2016 equity research
JPM 2016 equity researchJPM 2016 equity research
JPM 2016 equity research
 
Hyundai card ir material (fy 2016 1 q) en
Hyundai card ir material (fy 2016 1 q) enHyundai card ir material (fy 2016 1 q) en
Hyundai card ir material (fy 2016 1 q) en
 
Visa inc. q4 and fy 2017 financial results conference call presentation
Visa inc. q4 and fy 2017 financial results conference call presentationVisa inc. q4 and fy 2017 financial results conference call presentation
Visa inc. q4 and fy 2017 financial results conference call presentation
 
Budget 2013 Special Report Preview
Budget 2013 Special Report PreviewBudget 2013 Special Report Preview
Budget 2013 Special Report Preview
 
Ccal 2 q12_ing
Ccal 2 q12_ingCcal 2 q12_ing
Ccal 2 q12_ing
 
2016 wells fargo no appendix
2016 wells fargo no appendix2016 wells fargo no appendix
2016 wells fargo no appendix
 
Franklin resourcesq416
Franklin resourcesq416Franklin resourcesq416
Franklin resourcesq416
 
Abch results presentation 2012
Abch results presentation 2012Abch results presentation 2012
Abch results presentation 2012
 
ING Vyasa Bank Q2FY14 Result: Maintain neutral
ING Vyasa Bank Q2FY14 Result: Maintain neutralING Vyasa Bank Q2FY14 Result: Maintain neutral
ING Vyasa Bank Q2FY14 Result: Maintain neutral
 
1 q17 earnings presentation final
1 q17 earnings presentation final1 q17 earnings presentation final
1 q17 earnings presentation final
 
xcel energy November 2008
xcel energy  November 2008 xcel energy  November 2008
xcel energy November 2008
 
3Q09 Results Conference Call
3Q09 Results Conference Call3Q09 Results Conference Call
3Q09 Results Conference Call
 
2 q17 earnings presentation
2 q17 earnings presentation2 q17 earnings presentation
2 q17 earnings presentation
 
Am website presentation april 2016
Am website presentation   april 2016Am website presentation   april 2016
Am website presentation april 2016
 
Genworth MI Canada Inc. – First Quarter 2013
Genworth MI Canada Inc. – First Quarter 2013Genworth MI Canada Inc. – First Quarter 2013
Genworth MI Canada Inc. – First Quarter 2013
 
asset_allocation 2009
asset_allocation 2009asset_allocation 2009
asset_allocation 2009
 

Similar to Bank of Queensland - leading indicators point to more bad debt downside risk 20121023.pdf

1Q22 Earnings Presentation
1Q22 Earnings Presentation1Q22 Earnings Presentation
1Q22 Earnings PresentationBladex
 
Mercer Capital's Bank Watch | November 2022 | Community Bank Loan Portfolios ...
Mercer Capital's Bank Watch | November 2022 | Community Bank Loan Portfolios ...Mercer Capital's Bank Watch | November 2022 | Community Bank Loan Portfolios ...
Mercer Capital's Bank Watch | November 2022 | Community Bank Loan Portfolios ...Mercer Capital
 
Blx webcast presentation 4 q20 finalv2
Blx webcast presentation 4 q20 finalv2Blx webcast presentation 4 q20 finalv2
Blx webcast presentation 4 q20 finalv2Bladex
 
Blx webcast presentation 4 q20 final
Blx webcast presentation 4 q20 finalBlx webcast presentation 4 q20 final
Blx webcast presentation 4 q20 finalBladex
 
Mercer Capital's Business Development Companies Quarterly Newsletter | Q1 2015
Mercer Capital's Business Development Companies Quarterly Newsletter | Q1 2015Mercer Capital's Business Development Companies Quarterly Newsletter | Q1 2015
Mercer Capital's Business Development Companies Quarterly Newsletter | Q1 2015Mercer Capital
 
Blx webcast presentation 2 q21 v final
Blx webcast presentation 2 q21 v finalBlx webcast presentation 2 q21 v final
Blx webcast presentation 2 q21 v finalBladex
 
Blx webcast presentation 2 q21 v final (1)
Blx webcast presentation 2 q21 v final (1)Blx webcast presentation 2 q21 v final (1)
Blx webcast presentation 2 q21 v final (1)Bladex
 
Mercer Capital's Bank Watch | June 2022 | Bond Pain and Perspective on Bank V...
Mercer Capital's Bank Watch | June 2022 | Bond Pain and Perspective on Bank V...Mercer Capital's Bank Watch | June 2022 | Bond Pain and Perspective on Bank V...
Mercer Capital's Bank Watch | June 2022 | Bond Pain and Perspective on Bank V...Mercer Capital
 
Blx webcast presentation_3q21_v_final
Blx webcast presentation_3q21_v_finalBlx webcast presentation_3q21_v_final
Blx webcast presentation_3q21_v_finalBladex
 
Kerry Nelson - Carlson Fixed Income Fund - Returns and Attribution Analysis -...
Kerry Nelson - Carlson Fixed Income Fund - Returns and Attribution Analysis -...Kerry Nelson - Carlson Fixed Income Fund - Returns and Attribution Analysis -...
Kerry Nelson - Carlson Fixed Income Fund - Returns and Attribution Analysis -...kerrynelson
 
blx_webcast_presentation_2q22.pdf
blx_webcast_presentation_2q22.pdfblx_webcast_presentation_2q22.pdf
blx_webcast_presentation_2q22.pdfBladex
 
Capital Markets Insights - Q2 2016
Capital Markets Insights - Q2 2016Capital Markets Insights - Q2 2016
Capital Markets Insights - Q2 2016Duff & Phelps
 

Similar to Bank of Queensland - leading indicators point to more bad debt downside risk 20121023.pdf (20)

1Q22 Earnings Presentation
1Q22 Earnings Presentation1Q22 Earnings Presentation
1Q22 Earnings Presentation
 
2 q13 earnings_presentation
2 q13 earnings_presentation2 q13 earnings_presentation
2 q13 earnings_presentation
 
Mercer Capital's Bank Watch | November 2022 | Community Bank Loan Portfolios ...
Mercer Capital's Bank Watch | November 2022 | Community Bank Loan Portfolios ...Mercer Capital's Bank Watch | November 2022 | Community Bank Loan Portfolios ...
Mercer Capital's Bank Watch | November 2022 | Community Bank Loan Portfolios ...
 
1Q13 Results Presentation
1Q13 Results Presentation1Q13 Results Presentation
1Q13 Results Presentation
 
Blx webcast presentation 4 q20 finalv2
Blx webcast presentation 4 q20 finalv2Blx webcast presentation 4 q20 finalv2
Blx webcast presentation 4 q20 finalv2
 
Blx webcast presentation 4 q20 final
Blx webcast presentation 4 q20 finalBlx webcast presentation 4 q20 final
Blx webcast presentation 4 q20 final
 
Mercer Capital's Business Development Companies Quarterly Newsletter | Q1 2015
Mercer Capital's Business Development Companies Quarterly Newsletter | Q1 2015Mercer Capital's Business Development Companies Quarterly Newsletter | Q1 2015
Mercer Capital's Business Development Companies Quarterly Newsletter | Q1 2015
 
Blx webcast presentation 2 q21 v final
Blx webcast presentation 2 q21 v finalBlx webcast presentation 2 q21 v final
Blx webcast presentation 2 q21 v final
 
Blx webcast presentation 2 q21 v final (1)
Blx webcast presentation 2 q21 v final (1)Blx webcast presentation 2 q21 v final (1)
Blx webcast presentation 2 q21 v final (1)
 
Mercer Capital's Bank Watch | June 2022 | Bond Pain and Perspective on Bank V...
Mercer Capital's Bank Watch | June 2022 | Bond Pain and Perspective on Bank V...Mercer Capital's Bank Watch | June 2022 | Bond Pain and Perspective on Bank V...
Mercer Capital's Bank Watch | June 2022 | Bond Pain and Perspective on Bank V...
 
634923128569929457
634923128569929457634923128569929457
634923128569929457
 
2Q12 Earnings Release Report
2Q12 Earnings Release Report2Q12 Earnings Release Report
2Q12 Earnings Release Report
 
Blx webcast presentation_3q21_v_final
Blx webcast presentation_3q21_v_finalBlx webcast presentation_3q21_v_final
Blx webcast presentation_3q21_v_final
 
634824334331315452
634824334331315452634824334331315452
634824334331315452
 
Kerry Nelson - Carlson Fixed Income Fund - Returns and Attribution Analysis -...
Kerry Nelson - Carlson Fixed Income Fund - Returns and Attribution Analysis -...Kerry Nelson - Carlson Fixed Income Fund - Returns and Attribution Analysis -...
Kerry Nelson - Carlson Fixed Income Fund - Returns and Attribution Analysis -...
 
BI&P- Indusval - 2Q14 Results Presentation
BI&P- Indusval - 2Q14 Results PresentationBI&P- Indusval - 2Q14 Results Presentation
BI&P- Indusval - 2Q14 Results Presentation
 
blx_webcast_presentation_2q22.pdf
blx_webcast_presentation_2q22.pdfblx_webcast_presentation_2q22.pdf
blx_webcast_presentation_2q22.pdf
 
Union Budget FY13 - A perspective
Union Budget FY13 - A perspectiveUnion Budget FY13 - A perspective
Union Budget FY13 - A perspective
 
Capital Markets Insights - Q2 2016
Capital Markets Insights - Q2 2016Capital Markets Insights - Q2 2016
Capital Markets Insights - Q2 2016
 
Susq pre 13
Susq pre 13Susq pre 13
Susq pre 13
 

More from George Gabriel

Adveritas (AV1) - Is Adveritas the next Dubber (DUB)
Adveritas (AV1) - Is Adveritas the next Dubber (DUB) Adveritas (AV1) - Is Adveritas the next Dubber (DUB)
Adveritas (AV1) - Is Adveritas the next Dubber (DUB) George Gabriel
 
Adveritas (AV1) - ARR Growth Tracker
Adveritas (AV1) - ARR Growth Tracker Adveritas (AV1) - ARR Growth Tracker
Adveritas (AV1) - ARR Growth Tracker George Gabriel
 
STOCK SNAPSHOT - De.mem Limited - Water treatment tech with growing recurring...
STOCK SNAPSHOT - De.mem Limited - Water treatment tech with growing recurring...STOCK SNAPSHOT - De.mem Limited - Water treatment tech with growing recurring...
STOCK SNAPSHOT - De.mem Limited - Water treatment tech with growing recurring...George Gabriel
 
Wilsons Aged care, Health services and Retirement villages conference monda...
Wilsons Aged care, Health services and Retirement villages conference   monda...Wilsons Aged care, Health services and Retirement villages conference   monda...
Wilsons Aged care, Health services and Retirement villages conference monda...George Gabriel
 
LatAm Autos (LAA) - Investor Presentation - 24 October 2017
LatAm Autos (LAA) -  Investor Presentation - 24 October 2017LatAm Autos (LAA) -  Investor Presentation - 24 October 2017
LatAm Autos (LAA) - Investor Presentation - 24 October 2017George Gabriel
 
Henderson Global Group (HGG) - equity research initiation report
Henderson Global Group (HGG) - equity research initiation reportHenderson Global Group (HGG) - equity research initiation report
Henderson Global Group (HGG) - equity research initiation reportGeorge Gabriel
 
BT Funds Management - bigger, better, bolder BT - 20130501
BT Funds Management - bigger, better, bolder BT - 20130501BT Funds Management - bigger, better, bolder BT - 20130501
BT Funds Management - bigger, better, bolder BT - 20130501George Gabriel
 
Aged care sector - reviewing the investment case - 190215
Aged care sector - reviewing the investment case - 190215  Aged care sector - reviewing the investment case - 190215
Aged care sector - reviewing the investment case - 190215 George Gabriel
 
Tech Mpire (TMP) Business Overview - August 2017
Tech Mpire (TMP) Business Overview - August 2017 Tech Mpire (TMP) Business Overview - August 2017
Tech Mpire (TMP) Business Overview - August 2017 George Gabriel
 
Tech Mpire (TMP) - Product Presentation - July 2017
Tech Mpire (TMP) - Product Presentation - July 2017 Tech Mpire (TMP) - Product Presentation - July 2017
Tech Mpire (TMP) - Product Presentation - July 2017 George Gabriel
 
Evolution of value investing - all roads lead to Graham and Doddsville
Evolution of value investing - all roads lead to Graham and DoddsvilleEvolution of value investing - all roads lead to Graham and Doddsville
Evolution of value investing - all roads lead to Graham and DoddsvilleGeorge Gabriel
 
MONEY IN THE BANK - bank sector outlook
MONEY IN THE BANK - bank sector outlook MONEY IN THE BANK - bank sector outlook
MONEY IN THE BANK - bank sector outlook George Gabriel
 
George Gabriel presentation - Digital Disruptors Conference 2015
George Gabriel presentation - Digital Disruptors Conference 2015 George Gabriel presentation - Digital Disruptors Conference 2015
George Gabriel presentation - Digital Disruptors Conference 2015 George Gabriel
 
Computershare (CPU) initiation report - well-priced quality franchise with fr...
Computershare (CPU) initiation report - well-priced quality franchise with fr...Computershare (CPU) initiation report - well-priced quality franchise with fr...
Computershare (CPU) initiation report - well-priced quality franchise with fr...George Gabriel
 
MMS - earnings implications of management equity incentives
MMS - earnings implications of management equity incentivesMMS - earnings implications of management equity incentives
MMS - earnings implications of management equity incentivesGeorge Gabriel
 
3PL - equity research - initiation report
3PL - equity research - initiation report3PL - equity research - initiation report
3PL - equity research - initiation reportGeorge Gabriel
 
FSA - equity research initiation report
FSA - equity research initiation reportFSA - equity research initiation report
FSA - equity research initiation reportGeorge Gabriel
 
SFW - FOFA implications, Sum of parts valuation, possible acquirers
SFW - FOFA implications, Sum of parts valuation, possible acquirers SFW - FOFA implications, Sum of parts valuation, possible acquirers
SFW - FOFA implications, Sum of parts valuation, possible acquirers George Gabriel
 
Infomedia (IFM) - equity research initiation report
Infomedia (IFM) - equity research initiation reportInfomedia (IFM) - equity research initiation report
Infomedia (IFM) - equity research initiation reportGeorge Gabriel
 

More from George Gabriel (20)

Adveritas (AV1) - Is Adveritas the next Dubber (DUB)
Adveritas (AV1) - Is Adveritas the next Dubber (DUB) Adveritas (AV1) - Is Adveritas the next Dubber (DUB)
Adveritas (AV1) - Is Adveritas the next Dubber (DUB)
 
Adveritas (AV1) - ARR Growth Tracker
Adveritas (AV1) - ARR Growth Tracker Adveritas (AV1) - ARR Growth Tracker
Adveritas (AV1) - ARR Growth Tracker
 
STOCK SNAPSHOT - De.mem Limited - Water treatment tech with growing recurring...
STOCK SNAPSHOT - De.mem Limited - Water treatment tech with growing recurring...STOCK SNAPSHOT - De.mem Limited - Water treatment tech with growing recurring...
STOCK SNAPSHOT - De.mem Limited - Water treatment tech with growing recurring...
 
Wilsons Aged care, Health services and Retirement villages conference monda...
Wilsons Aged care, Health services and Retirement villages conference   monda...Wilsons Aged care, Health services and Retirement villages conference   monda...
Wilsons Aged care, Health services and Retirement villages conference monda...
 
LatAm Autos (LAA) - Investor Presentation - 24 October 2017
LatAm Autos (LAA) -  Investor Presentation - 24 October 2017LatAm Autos (LAA) -  Investor Presentation - 24 October 2017
LatAm Autos (LAA) - Investor Presentation - 24 October 2017
 
Henderson Global Group (HGG) - equity research initiation report
Henderson Global Group (HGG) - equity research initiation reportHenderson Global Group (HGG) - equity research initiation report
Henderson Global Group (HGG) - equity research initiation report
 
BT Funds Management - bigger, better, bolder BT - 20130501
BT Funds Management - bigger, better, bolder BT - 20130501BT Funds Management - bigger, better, bolder BT - 20130501
BT Funds Management - bigger, better, bolder BT - 20130501
 
Aged care sector - reviewing the investment case - 190215
Aged care sector - reviewing the investment case - 190215  Aged care sector - reviewing the investment case - 190215
Aged care sector - reviewing the investment case - 190215
 
Tech Mpire (TMP) Business Overview - August 2017
Tech Mpire (TMP) Business Overview - August 2017 Tech Mpire (TMP) Business Overview - August 2017
Tech Mpire (TMP) Business Overview - August 2017
 
Tech Mpire (TMP) - Product Presentation - July 2017
Tech Mpire (TMP) - Product Presentation - July 2017 Tech Mpire (TMP) - Product Presentation - July 2017
Tech Mpire (TMP) - Product Presentation - July 2017
 
Evolution of value investing - all roads lead to Graham and Doddsville
Evolution of value investing - all roads lead to Graham and DoddsvilleEvolution of value investing - all roads lead to Graham and Doddsville
Evolution of value investing - all roads lead to Graham and Doddsville
 
MONEY IN THE BANK - bank sector outlook
MONEY IN THE BANK - bank sector outlook MONEY IN THE BANK - bank sector outlook
MONEY IN THE BANK - bank sector outlook
 
George Gabriel presentation - Digital Disruptors Conference 2015
George Gabriel presentation - Digital Disruptors Conference 2015 George Gabriel presentation - Digital Disruptors Conference 2015
George Gabriel presentation - Digital Disruptors Conference 2015
 
Computershare (CPU) initiation report - well-priced quality franchise with fr...
Computershare (CPU) initiation report - well-priced quality franchise with fr...Computershare (CPU) initiation report - well-priced quality franchise with fr...
Computershare (CPU) initiation report - well-priced quality franchise with fr...
 
MMS - earnings implications of management equity incentives
MMS - earnings implications of management equity incentivesMMS - earnings implications of management equity incentives
MMS - earnings implications of management equity incentives
 
3PL - equity research - initiation report
3PL - equity research - initiation report3PL - equity research - initiation report
3PL - equity research - initiation report
 
FSA - equity research initiation report
FSA - equity research initiation reportFSA - equity research initiation report
FSA - equity research initiation report
 
BUY Australian Banks
BUY Australian BanksBUY Australian Banks
BUY Australian Banks
 
SFW - FOFA implications, Sum of parts valuation, possible acquirers
SFW - FOFA implications, Sum of parts valuation, possible acquirers SFW - FOFA implications, Sum of parts valuation, possible acquirers
SFW - FOFA implications, Sum of parts valuation, possible acquirers
 
Infomedia (IFM) - equity research initiation report
Infomedia (IFM) - equity research initiation reportInfomedia (IFM) - equity research initiation report
Infomedia (IFM) - equity research initiation report
 

Recently uploaded

Sustainability Leadership, April 26 2024
Sustainability Leadership, April 26 2024Sustainability Leadership, April 26 2024
Sustainability Leadership, April 26 2024TeckResourcesLtd
 
Malad Escorts, (Pooja 09892124323), Malad Call Girls Service
Malad Escorts, (Pooja 09892124323), Malad Call Girls ServiceMalad Escorts, (Pooja 09892124323), Malad Call Girls Service
Malad Escorts, (Pooja 09892124323), Malad Call Girls ServicePooja Nehwal
 
VIP Kolkata Call Girls Bidhannagar 8250192130 Available With Room
VIP Kolkata Call Girls Bidhannagar 8250192130 Available With RoomVIP Kolkata Call Girls Bidhannagar 8250192130 Available With Room
VIP Kolkata Call Girls Bidhannagar 8250192130 Available With Roomrran7532
 
VIP Kolkata Call Girl Entally 👉 8250192130 Available With Room
VIP Kolkata Call Girl Entally 👉 8250192130  Available With RoomVIP Kolkata Call Girl Entally 👉 8250192130  Available With Room
VIP Kolkata Call Girl Entally 👉 8250192130 Available With Roomdivyansh0kumar0
 
OKC Thunder Reveal Game 2 Playoff T Shirts
OKC Thunder Reveal Game 2 Playoff T ShirtsOKC Thunder Reveal Game 2 Playoff T Shirts
OKC Thunder Reveal Game 2 Playoff T Shirtsrahman018755
 
Call Girl Kolkata Sia 🤌 8250192130 🚀 Vip Call Girls Kolkata
Call Girl Kolkata Sia 🤌  8250192130 🚀 Vip Call Girls KolkataCall Girl Kolkata Sia 🤌  8250192130 🚀 Vip Call Girls Kolkata
Call Girl Kolkata Sia 🤌 8250192130 🚀 Vip Call Girls Kolkataanamikaraghav4
 
如何办理(UTS毕业证书)悉尼科技大学毕业证学位证书
如何办理(UTS毕业证书)悉尼科技大学毕业证学位证书如何办理(UTS毕业证书)悉尼科技大学毕业证学位证书
如何办理(UTS毕业证书)悉尼科技大学毕业证学位证书Fis s
 
VIP Kolkata Call Girl Rishra 👉 8250192130 Available With Room
VIP Kolkata Call Girl Rishra 👉 8250192130  Available With RoomVIP Kolkata Call Girl Rishra 👉 8250192130  Available With Room
VIP Kolkata Call Girl Rishra 👉 8250192130 Available With Roomdivyansh0kumar0
 
VIP 7001035870 Find & Meet Hyderabad Call Girls Miyapur high-profile Call Girl
VIP 7001035870 Find & Meet Hyderabad Call Girls Miyapur high-profile Call GirlVIP 7001035870 Find & Meet Hyderabad Call Girls Miyapur high-profile Call Girl
VIP 7001035870 Find & Meet Hyderabad Call Girls Miyapur high-profile Call Girladitipandeya
 
Teck Investor Presentation, April 24, 2024
Teck Investor Presentation, April 24, 2024Teck Investor Presentation, April 24, 2024
Teck Investor Presentation, April 24, 2024TeckResourcesLtd
 
Russian Call Girls Kolkata Amaira 🤌 8250192130 🚀 Vip Call Girls Kolkata
Russian Call Girls Kolkata Amaira 🤌  8250192130 🚀 Vip Call Girls KolkataRussian Call Girls Kolkata Amaira 🤌  8250192130 🚀 Vip Call Girls Kolkata
Russian Call Girls Kolkata Amaira 🤌 8250192130 🚀 Vip Call Girls Kolkataanamikaraghav4
 
Short-, Mid-, and Long-term gxxoals.pptx
Short-, Mid-, and Long-term gxxoals.pptxShort-, Mid-, and Long-term gxxoals.pptx
Short-, Mid-, and Long-term gxxoals.pptxHenryBriggs2
 

Recently uploaded (20)

Call Girls 🫤 East Of Kailash ➡️ 9999965857 ➡️ Delhi 🫦 Russian Escorts FULL ...
Call Girls 🫤 East Of Kailash ➡️ 9999965857  ➡️ Delhi 🫦  Russian Escorts FULL ...Call Girls 🫤 East Of Kailash ➡️ 9999965857  ➡️ Delhi 🫦  Russian Escorts FULL ...
Call Girls 🫤 East Of Kailash ➡️ 9999965857 ➡️ Delhi 🫦 Russian Escorts FULL ...
 
Sustainability Leadership, April 26 2024
Sustainability Leadership, April 26 2024Sustainability Leadership, April 26 2024
Sustainability Leadership, April 26 2024
 
Malad Escorts, (Pooja 09892124323), Malad Call Girls Service
Malad Escorts, (Pooja 09892124323), Malad Call Girls ServiceMalad Escorts, (Pooja 09892124323), Malad Call Girls Service
Malad Escorts, (Pooja 09892124323), Malad Call Girls Service
 
VIP Kolkata Call Girls Bidhannagar 8250192130 Available With Room
VIP Kolkata Call Girls Bidhannagar 8250192130 Available With RoomVIP Kolkata Call Girls Bidhannagar 8250192130 Available With Room
VIP Kolkata Call Girls Bidhannagar 8250192130 Available With Room
 
VIP Kolkata Call Girl Entally 👉 8250192130 Available With Room
VIP Kolkata Call Girl Entally 👉 8250192130  Available With RoomVIP Kolkata Call Girl Entally 👉 8250192130  Available With Room
VIP Kolkata Call Girl Entally 👉 8250192130 Available With Room
 
@9999965857 🫦 Sexy Desi Call Girls Vaishali 💓 High Profile Escorts Delhi 🫶
@9999965857 🫦 Sexy Desi Call Girls Vaishali 💓 High Profile Escorts Delhi 🫶@9999965857 🫦 Sexy Desi Call Girls Vaishali 💓 High Profile Escorts Delhi 🫶
@9999965857 🫦 Sexy Desi Call Girls Vaishali 💓 High Profile Escorts Delhi 🫶
 
OKC Thunder Reveal Game 2 Playoff T Shirts
OKC Thunder Reveal Game 2 Playoff T ShirtsOKC Thunder Reveal Game 2 Playoff T Shirts
OKC Thunder Reveal Game 2 Playoff T Shirts
 
Model Call Girl in Uttam Nagar Delhi reach out to us at 🔝9953056974🔝
Model Call Girl in Uttam Nagar Delhi reach out to us at 🔝9953056974🔝Model Call Girl in Uttam Nagar Delhi reach out to us at 🔝9953056974🔝
Model Call Girl in Uttam Nagar Delhi reach out to us at 🔝9953056974🔝
 
Call Girl Kolkata Sia 🤌 8250192130 🚀 Vip Call Girls Kolkata
Call Girl Kolkata Sia 🤌  8250192130 🚀 Vip Call Girls KolkataCall Girl Kolkata Sia 🤌  8250192130 🚀 Vip Call Girls Kolkata
Call Girl Kolkata Sia 🤌 8250192130 🚀 Vip Call Girls Kolkata
 
如何办理(UTS毕业证书)悉尼科技大学毕业证学位证书
如何办理(UTS毕业证书)悉尼科技大学毕业证学位证书如何办理(UTS毕业证书)悉尼科技大学毕业证学位证书
如何办理(UTS毕业证书)悉尼科技大学毕业证学位证书
 
VIP Kolkata Call Girl Rishra 👉 8250192130 Available With Room
VIP Kolkata Call Girl Rishra 👉 8250192130  Available With RoomVIP Kolkata Call Girl Rishra 👉 8250192130  Available With Room
VIP Kolkata Call Girl Rishra 👉 8250192130 Available With Room
 
VIP 7001035870 Find & Meet Hyderabad Call Girls Miyapur high-profile Call Girl
VIP 7001035870 Find & Meet Hyderabad Call Girls Miyapur high-profile Call GirlVIP 7001035870 Find & Meet Hyderabad Call Girls Miyapur high-profile Call Girl
VIP 7001035870 Find & Meet Hyderabad Call Girls Miyapur high-profile Call Girl
 
Teck Investor Presentation, April 24, 2024
Teck Investor Presentation, April 24, 2024Teck Investor Presentation, April 24, 2024
Teck Investor Presentation, April 24, 2024
 
Rohini Sector 17 Call Girls Delhi 9999965857 @Sabina Saikh No Advance
Rohini Sector 17 Call Girls Delhi 9999965857 @Sabina Saikh No AdvanceRohini Sector 17 Call Girls Delhi 9999965857 @Sabina Saikh No Advance
Rohini Sector 17 Call Girls Delhi 9999965857 @Sabina Saikh No Advance
 
(👉゚9999965857 ゚)👉 VIP Call Girls Greater Noida 👉 Delhi 👈 : 9999 Cash Payment...
(👉゚9999965857 ゚)👉 VIP Call Girls Greater Noida  👉 Delhi 👈 : 9999 Cash Payment...(👉゚9999965857 ゚)👉 VIP Call Girls Greater Noida  👉 Delhi 👈 : 9999 Cash Payment...
(👉゚9999965857 ゚)👉 VIP Call Girls Greater Noida 👉 Delhi 👈 : 9999 Cash Payment...
 
Rohini Sector 15 Call Girls Delhi 9999965857 @Sabina Saikh No Advance
Rohini Sector 15 Call Girls Delhi 9999965857 @Sabina Saikh No AdvanceRohini Sector 15 Call Girls Delhi 9999965857 @Sabina Saikh No Advance
Rohini Sector 15 Call Girls Delhi 9999965857 @Sabina Saikh No Advance
 
Russian Call Girls Kolkata Amaira 🤌 8250192130 🚀 Vip Call Girls Kolkata
Russian Call Girls Kolkata Amaira 🤌  8250192130 🚀 Vip Call Girls KolkataRussian Call Girls Kolkata Amaira 🤌  8250192130 🚀 Vip Call Girls Kolkata
Russian Call Girls Kolkata Amaira 🤌 8250192130 🚀 Vip Call Girls Kolkata
 
Short-, Mid-, and Long-term gxxoals.pptx
Short-, Mid-, and Long-term gxxoals.pptxShort-, Mid-, and Long-term gxxoals.pptx
Short-, Mid-, and Long-term gxxoals.pptx
 
Vip Call Girls Vasant Kunj ➡️ Delhi ➡️ 9999965857 No Advance 24HRS Live
Vip Call Girls Vasant Kunj ➡️ Delhi ➡️ 9999965857 No Advance 24HRS LiveVip Call Girls Vasant Kunj ➡️ Delhi ➡️ 9999965857 No Advance 24HRS Live
Vip Call Girls Vasant Kunj ➡️ Delhi ➡️ 9999965857 No Advance 24HRS Live
 
@9999965857 🫦 Sexy Desi Call Girls Karol Bagh 💓 High Profile Escorts Delhi 🫶
@9999965857 🫦 Sexy Desi Call Girls Karol Bagh 💓 High Profile Escorts Delhi 🫶@9999965857 🫦 Sexy Desi Call Girls Karol Bagh 💓 High Profile Escorts Delhi 🫶
@9999965857 🫦 Sexy Desi Call Girls Karol Bagh 💓 High Profile Escorts Delhi 🫶
 

Bank of Queensland - leading indicators point to more bad debt downside risk 20121023.pdf

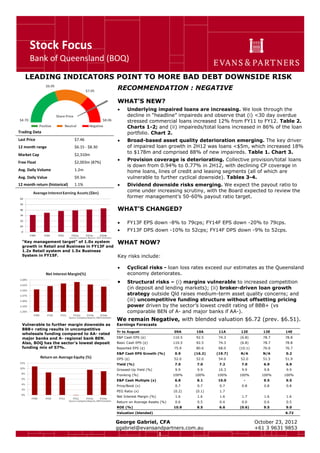
  • 1. Stock Focus Bank of Queensland (BOQ) 1 LEADING INDICATORS POINT TO MORE BAD DEBT DOWNSIDE RISK RECOMMENDATION : NEGATIVE WHAT’S NEW?  Underlying impaired loans are increasing. We look through the decline in “headline” impaireds and observe that (i) <30 day overdue stressed commercial loans increased 12% from FY11 to FY12. Table 2. Charts 1-2; and (ii) impaireds/total loans increased in 86% of the loan portfolio. Chart 2.  Broad-based asset quality deterioration emerging. The key driver of impaired loan growth in 2H12 was loans <$5m, which increased 18% to $178m and comprised 88% of new impaireds. Table 1. Chart 3.  Provision coverage is deteriorating. Collective provision/total loans is down from 0.94% to 0.77% in 2H12, with declining CP coverage in home loans, lines of credit and leasing segments (all of which are vulnerable to further cyclical downside). Tables 3-4.  Dividend downside risks emerging. We expect the payout ratio to come under increasing scrutiny, with the Board expected to review the former management’s 50-60% payout ratio target. WHAT’S CHANGED?  FY13F EPS down -8% to 79cps; FY14F EPS down -20% to 79cps.  FY13F DPS down -10% to 52cps; FY14F DPS down -9% to 52cps. WHAT NOW? Key risks include:  Cyclical risks - loan loss rates exceed our estimates as the Queensland economy deteriorates.  Structural risks – (i) margins vulnerable to increased competition (in deposit and lending markets); (ii) broker-driven loan growth strategy outside Qld raises medium-term asset quality concerns; and (iii) uncompetitive funding structure without offsetting pricing power driven by the sector’s lowest credit rating of BBB+ (vs comparable BEN of A- and major banks if AA-). We remain Negative, with blended valuation $6.72 (prev. $6.51). Trading Data Last Price $7.46 12 month range $6.15 - $8.30 Market Cap $2,310m Free Float $2,003m (87%) Avg. Daily Volume 1.2m Avg. Daily Value $9.3m 12 month return (historical) 1.1% “Key management target” of 1.0x system growth in Retail and Business in FY13F and 1.2x Retail system and 1.5x Business System in FY15F. Vulnerable to further margin downside as BBB+ rating results in uncompetitive wholesale funding compared to AA- rated major banks and A- regional bank BEN. Also, BOQ has the sector’s lowest deposit funding mix of 57%. Earnings Forecasts Yr to August 09A 10A 11A 12E 13E 14E E&P Cash EPS (¢) 110.5 92.5 74.3 (6.8) 78.7 78.8 Basic Cash EPS (¢) 110.5 92.5 74.3 (6.8) 78.7 78.8 Reported EPS (¢) 75.9 80.6 68.0 (10.1) 76.6 76.7 E&P Cash EPS Growth (%) 0.9 (16.2) (19.7) N/A N/A 0.2 DPS (¢) 52.0 52.0 54.0 52.0 51.5 51.9 Yield (%) 7.0 7.0 7.2 7.0 6.9 6.9 Grossed-Up Yield (%) 9.9 9.9 10.3 9.9 9.8 9.9 Franking (%) 100% 100% 100% 100% 100% 100% E&P Cash Multiple (x) 6.8 8.1 10.0 - 9.5 9.5 Price/Book (x) 0.7 0.7 0.7 0.8 0.8 0.8 PEG Ratio (x) (0.2) (0.1) 1.7 Net Interest Margin (%) 1.6 1.6 1.6 1.7 1.6 1.6 Return on Average Assets (%) 0.6 0.5 0.4 0.0 0.6 0.5 ROE (%) 10.8 8.5 6.6 (0.6) 9.5 9.0 Valuation (blended) 6.72 George Gabriel, CFA ggabriel@evansandpartners.com.au October 23, 2012 +61 3 9631 9853
  • 2. 2 UNDERLYING ASSET QUALITY AND PROVISION COVERAGE IS DECLINING Historically, the time to buy banks working through a bad debt cycle is when the rate of impaired loan growth slows (ie. “negative second derivative”). However, in the case of BOQ, we look through the headline decline in impaired loan growth and observe evidence of underlying asset quality deterioration: (i) Underlying impaired loans are increasing, despite the decline in “headline” impaireds. (ii) Broad-based deterioration in the loan book is emerging. (iii) Leading indicators of asset quality raise “red flags”. (iv) Provision coverage is deteriorating. (v) The Queensland macroeconomic backdrop is deteriorating. We explain these points in more detail below. (i) Underlying impaired loans are increasing BOQ highlighted that its total impaired asset balance declined from $578.7m in 1H12 to $525.3m in 2H12. Chart 1. However, the underlying trends are:  Total impaireds increased to $781.5m (up 35.0%) prior to property realisations and the sale of ~$156m of impaired property to Goldman Sachs on 17 July 2012 (reported to be at a 62% discount to face value). Chart 1.  Impaireds/total loans increased in 86% of the loan portfolio: housing (60% total loans), lines of credit (15% total loans) and leasing (11% total loans). Lines of credit arrears increase was significant, up from 0.88% to 1.79% of total loans. Chart 2. CHART 1: IMPAIRED LOAN BALANCES Source: BOQ Presentation
  • 3. 3 CHART 2: IMPAIRED LOAN TRENDS Source: EAP Research (ii) Broad-based loan book deterioration BOQ’s impaired loan cycle has progressed from large exposures to a more broadly- based portfolio deterioration, indicating that the macroeconomic cycle could drive further bad debts across these loan portfolios.  88% of new impaired loans are <$5m in value in 2H12 (compared to 30% in 1H11), which increased by 18% in 2H12. Table 1. Chart 3.  Management has guided that two-thirds of the next period’s bad debts will be from their retail loan book (housing and lines of credit). TABLE 1: IMPAIRED LOAN TRENDS Source: EAP Research
  • 4. 4 CHART 3: NEW IMPAIRED LOANS Source: BOQ Presentation (iii) Leading indicators of asset quality The key “red flag” is that commercial loans less than 30 days past due are increasing, up 12% in FY12 (vs FY11). This is a key area to watch. Table 2. TABLE 2: ASSET QUALITY LEADING INDICATORS BOQ stressed loans trend analysis (A$m) FY10 FY11 FY12 % growth FY11- FY10 % growth FY12- FY11 Retail 826 677 652 -18% -4% Commercial 246 207 231 -16% 12% Less than 30 days past due (DPD) 1,072 884 883 -18% 0% Retail 139 254 163 82% -36% Commercial 131 108 93 -17% -14% 31 to 90 days past due (DPD) 270 362 256 34% -29% Retail 186 318 232 71% -27% Commercial 142 165 115 16% -30% More than 90 days past due (90 DPD) 327 483 347 47% -28% Total loans past due but not impaired 1,669 1,729 1,486 4% -14% Impaired loans 148 444 525 201% 18% Loans past due and impaired 1,817 2,173 2,011 20% -7% Gross loans and advances 32,439 34,065 35,005 5% 3% (90 DPD + impaired)/gross loans 1.46% 2.72% 2.49% (Past due + impaired)/gross loans 5.6% 6.4% 5.7% Source: Company Reports; EAP Research
  • 5. 5 (iv) Provision coverage is deteriorating We believe that there is potential for increased provisioning because (i) underlying impaireds are increasing, and (ii) provision coverage is declining.  Collective provision/total loans down from 0.94% in 1H12 to 0.77% in 2H12, with reduced coverage in home loans, lines of credit and leasing segments. Tables 3-4.  Specific provision coverage down from 43.0% to 41.9%. BOQ reportedly sold some distressed property loans to Goldman Sachs at a 62% discount to face value. If this discount is applied to BOQ’s existing impaired commercial loans, this implies ~$48m in additional losses. TABLE 3: BOQ LOAN PROVISIONING PER SEGMENT AS AT 2H12 Segment Description Value (A$bn) % total loans % impaired Collective Provision (A$m) Specific Provision (A$m) Impaired loans (A$m) Specific/ impaired (%) CP/net loans (%) Total Provision/Loans ratio Home Loans 60% Qld, 16% Vic, 13% NSW, 8% WA 20.3 59.5% 0.61% 26 41.3 123.9 33.3% 0.13% 0.33% Lines of credit Secured by resi mortgages 5 14.7% 1.79% 14.1 32.7 89.5 36.5% 0.29% 0.94% Commercial SME segment 5.1 15.0% 5.58% 121.1 127.9 284.4 45.0% 2.51% 4.88% Leasing BOQ Equipment Finance 3.7 10.9% 0.71% 26.9 17.6 26.3 66.9% 0.73% 1.20% Provision overlays (GRCL) 70.2 Total 34.1 100.0% 258.3 219.5 524.1 41.9% 0.77% 1.40% Source: EAP Research TABLE 4: BOQ LOAN PROVISIONING PER SEGMENT AS AT 1H12 Segment Description Value (A$bn) % total loans % impaired Collective Provision (A$m) Specific Provision (A$m) Impaired loans (A$m) Specific/ impaired (%) CP/net loans (%) Total Provision/Loans (%) Home Loans 60% Qld, 16% Vic, 13% NSW, 8% WA 19.4 57.7% 0.46% 37.9 27.6 88.6 31.2% 0.20% 0.34% Lines of credit Secured by resi mortgages 5.2 15.5% 0.88% 22.8 19.1 45.5 42.0% 0.44% 0.81% Commercial SME segment 5.3 15.8% 8.00% 156.6 187.9 424.2 44.3% 3.21% 6.50% Leasing BOQ Equipment Finance 3.7 11.0% 0.53% 20.3 13.9 19.7 70.6% 0.55% 0.92% Provision overlays (GRCL) 74.4 Total 33.6 100.0% 312 248.5 578 43.0% 0.94% 1.67% Source: EAP Research Furthermore, we believe the disclosed “key management targets” of 28-34bps in bad debts to gross loans in FY13F normalising to 20bp in FY15 is optimistic, given it will likely take more time for changes to risk appetite at the front end of the book to work through the whole book and reduce the average portfolio loss rates. Chart 4.
  • 6. 6 CHART 4: KEY MANAGEMENT TARGETS Source: BOQ Presentation (v) Queensland downside risks prevail The CEO has previously referred to stresses in the SE Queensland property market, with price declines of 50-60%. Refer EAP Note, “SE Queensland Property – Slowing One Day...Declining the Next”, dated 9 October 2012. At the FY12 results analyst briefing, he commented that whilst property clearance rates were improved, it is still too early to call a market bottom.
  • 7. 7 BLENDED VALUATION Our $6.72 blended valuation reflects the risks of BOQ’s narrow business and geographical mix, near-term credit quality and operational concerns and long-term structural funding disadvantages. Table 5. Our 30% discount to the price/book value and 9.0x FY13F PE multiple are consistent with depressed trading historical multiple ranges and have been selected to incorporate suitable margin of safety discounts which we believe are warranted before investors should consider investing in BOQ. Chart 5-6. TABLE 5: BLENDED VALUATION Method Key Inputs Value ($) Discounted cash flow 11% Discount Rate $6.92 Price/book value 0.70x FY13F and FY14F $6.57 Dividend yield/bond yield 1.6x 5.5% bond yield $6.26 PE valuation FY13F PE of 9.0x $7.12 Average $6.72 Source: EAP Research CHART 5: HISTORICAL PRICE/EARNINGS CHART 6: HISTORICAL PRICE/BOOK MULTIPLE Source: Factset
  • 8. 8 FY12 RESULT SUMMARY Key result highlights are:  Net interest income increased +1.4% as average interest earning assets increased +1.35% and net interest margin remained steady at 1.66% over FY12. Table 6. NIM will benefit in 1H13 from the full period impact of BOQ’s +25bp out-of-cycle rate rises on the RBA rate cuts in May (-50bp), June (-25bp) and October (-25bp).  Reasonable +2.8% growth in operating income, driven by other banking income (+10.8%, fees and commissions; BOQ Finance); and net insurance income (+4.5%).  Disappointing cost performance, with +14.5% expense growth and a 55.3% cost-to- income ratio, driven by increased employee costs (+11.3%, FTE -10 to 1,448), IT costs and occupancy costs. Negative “jaws” for two consecutive halves is a concern (- 6.4% and -11.7% in 1H12 and 2H12).  Capital position largely stable - at 8.5% core tier 1 capital (versus 1H12 pro- forma 8.6%), at the top end of peer range. TABLE 6: GROUP PERFORMANCE Group Performance 1H09 2H09 1H10 2H10 1H11 2H11 1H12 2H12 1H10- 2H10 2H10- 1H11 1H11- 2H11 2H11- 1H12 1H12- 2H12 Interest Income 1098 933 1004 1233 1315 1362 1327 1270 22.8% 6.6% 3.6% -2.6% -4.3% Interest Expense -872 -678 -729 -947 -1005 -1049 -1003 -942 29.9% 6.1% 4.4% -4.3% -6.1% Net Interest Income 227 255 275 286 310 313 324 328 3.9% 8.5% 1.0% 3.3% 1.4% Other Banking Income 77 71 68 75 61 71 53 59 9.9% -18.0% 15.8% -25.4% 10.8% Net Banking Operating Income 304 325 343 360 371 384 376 387 5.1% 3.1% 3.5% -2.0% 2.7% Net Insurance Op. Income 0 0 0 7 19 22 20 21 10.8% -6.0% 4.5% Total Operating Income 304 325 343 368 391 406 397 408 7.2% 6.3% 3.8% -2.2% 2.8% Other Expenses -212 -158 -161 -187 -185 -189 -197 -226 -16.5% 1.3% -2.2% -4.2% -14.5% Pre-prov Operating Profit 92 167 182 180 206 217 200 182 -0.9% 14.1% 5.3% -7.8% -8.8% Bad Debts Expense -28 -38 -51 -53 -134 -66 -328 -73 -2.7% -154.5% 50.8% -395.8% 77.6% Profit Before Tax 64 129 131 128 71 151 -128 109 -2.4% -44.1% 111.1% -185.1% -184.9% Income Tax -18 -34 -40 -37 -21 -42 38 -35 Statutory NPAT 46 95 91 91 50 108 -91 73 0.1% -44.6% 114.9% -183.7% -181.1% Adjustments 34 12 2 13 5 13 18 30 Normalised NPAT 81 107 93 104 54.9 121.7 -72.4 103 11.1% -47.1% 121.7% -159.5% -242.3% Source: BOQ reports Growth ratesNormalised Earnings
  • 9. 9 FINANCIAL SUMMARY Bank of Queensland BOQ As at: 23/10/2012 Recommendation: Negative Share Price $7.46 Year end August 2011A 2012E 2013E 2014E INCOME STATEMENT Interest Income $m 2,677 2,596 2,483 2,715 Interest Expense $m (2,053) (1,945) (1,821) (2,029) Net Interest Income $m 623 652 662 686 Non Interest Income Fees & Commissions $m 135 120 156 149 Trading Income $m 0 0 0 0 Other Banking Income $m (3) (9) (9) (10) Banking Non Interest Income $m 132 112 147 139 Wealth Management Income $m 0 0 0 0 Income/(Loss) from Associates $m 0 0 0 0 Total operating income $m 796 804 861 887 Operating Expenses Personnel Expenses $m (155) (166) (154) (154) Occupancy & Equipment $m (94) (117) (111) (114) Total Operating Expenses $m (374) (423) (398) (404) Pre Prov. Oper. Profit Before Tax $m 422 382 463 483 Bad debt charge $m (201) (401) (114) (131) Pre Tax Profit $m 222 (19) 349 352 Tax Expense $m (63) 2 (105) (106) Minorities $m 0 0 0 0 Reported Profit Statutory $m 159 (17) 245 246 Cash earnings adjustment $m 14 9 6 7 Reported Cash Profit $m 165 (18) 243 243 Preference Share Dividends $m (8) (10) (8) (10) E&P Normalised NPAT $m 165 (18) 243 243 E&P Cash EPS ¢ 74.3 (6.8) 78.7 78.8 Basic Cash EPS ¢ 74.3 (6.8) 78.7 78.8 Reported EPS ¢ 68.0 (10.1) 76.6 76.7 Dividend per Share ¢ 54.0 52.0 51.5 51.9 BALANCE SHEET Gross Loans & Other Receivables $m 34,065 35,004 36,181 37,886 Total Assets $m 39,901 41,758 43,902 46,182 Impaired Assets $m 444 525 400 327 Deposits & Other Pub. Borrowing $m 36,278 37,860 39,985 42,093 Bonds, notes & subordinat’d debt $m 0 0 0 0 Total Shareholder Equity $m 2,574 2,899 2,862 2,979 Avg housing loans $m 23,192 24,755 25,477 26,891 Avg non-housing loans $m 9,485 9,306 9,578 10,110 Avg total gross loans $m 32,678 34,061 35,055 37,001 Avg Interest Earning Assets $m 38,174 39,410 40,876 43,093 Avg Total Assets $m 38,975 40,687 42,200 44,489 Avg Interest Bearing Liabilities $m 35,740 36,774 38,910 41,041 Avg Total Liabilities $m 36,483 37,515 39,651 41,783 Avg Shareholders’ Equity $m 2,492 3,172 2,549 2,707 GROWTH RATES Per Share E&P Cash EPS % (19.7)% N/A% N/A% 0.2% Basic Cash EPS % (19.7)% N/A% N/A% 0.2% Dividend Per Share % 3.8% (3.7)% (1.0)% 0.8% Profit & Loss Net Interest Income % 11.0% 4.5% 1.6% 3.7% Banking Non Interest Income % (0.1)% (15.6)% 31.9% (5.5)% Wealth Management Income % N/A% N/A% N/A% N/A% Total Non Interest Income % (0.1)% (15.6)% 31.9% (5.5)% Total Operating Income % 12.0% 1.0% 7.1% 3.0% Operating Expenses % 7.5% 13.0% (5.8)% 1.6% Pre-Provision Profit % 16.3% (9.6)% 21.4% 4.2% Impairment Charges % 92.4% 100.0% (71.6)% 14.8% Cash Profit % (16.3)% N/A% N/A% 0.2% Balance Sheet Gross Loans & Other Receivables % 5.0% 2.8% 3.4% 4.7% Total Shareholders’ Equity % 7.1% 12.7% (1.3)% 4.1% Average Balance Sheet Housing Loans % 10.3% 6.7% 2.9% 5.6% Non-Housing Loans % 4.7% (1.9)% 2.9% 5.6% Avg Interest Earning Assets % 8.7% 3.2% 3.7% 5.4% Avg Interest Bearing Liabilities % 8.2% 2.9% 5.8% 5.5% Year end August 2011A 2012E 2013E 2014E VALUATION METRICS E&P Cash P/E Multiple x 10.0 - 9.5 9.5 Basic P/E Multiple x 10.0 - 9.5 9.5 Price/Pre-prov. operating profit x 4.0 6.0 5.0 4.8 NTA per share $ 8.8 7.6 7.5 7.7 Book Value per Share $ 11.4 9.4 9.3 9.5 Price/NTA x 0.8 1.0 1.0 1.0 Price/Book x 0.7 0.8 0.8 0.8 Dividend per Share ¢ 54.0 52.0 51.5 51.9 Dividend Payout Ratio x 0.7 (7.6) 0.7 0.7 Dividend Yield % 7.2% 7.0% 6.9% 6.9% Grossed Up Yield % 10.3% 9.9% 9.8% 9.9% Issued Shares m 225.4 308.8 308.8 313.5 Weighted Average Shares m 221.9 263.8 308.8 308.8 PERFORMANCE ANALYSIS Profitability Income / Avg Assets % 2.0% 2.0% 2.0% 2.0% Expense / Avg Assets % 0.2% 0.0% 0.2% 0.2% Return on Average Assets % 0.4% 0.0% 0.6% 0.5% Return on Ordinary Equity % 6.6% (0.6)% 9.5% 9.0% Return on Risk Weighted Assets % 0.8% (0.1)% 1.1% 1.1% Net Interest Margin Analysis Net Interest Spread % 1.3% 1.3% 1.4% 1.4% Net Interest Margin % 1.6% 1.7% 1.6% 1.6% Non Int. Income to Total Income % 21.7% 19.0% 23.1% 22.6% Efficiency Cost/Income % 47.0% 52.5% 46.2% 45.6% Tax Rate Effective tax rate % 28.4% 11.4% 30.0% 30.0% CAPITAL ADEQUACY Risk Weighted Assets $m 20,525 21,098 21,247 22,236 Tier 1 Capital $m 1,718 1,998 2,033 2,150 Total Capital $m 2,343 2,657 2,707 2,865 Tier 1 Ratio % 8.4% 9.5% 9.6% 9.7% Tier 2 Ratio % 3.1% 3.1% 3.2% 3.2% Total Capital Ratio % 11.4% 12.6% 12.7% 12.9% ACE Ratio % 6.7% 8.9% 8.6% 8.4% Tangible Leverage Ratio % 5.0% 5.6% 5.3% 5.2% ASSET QUALITY 90-day Past Due Loans $m 483 347 264 216 Non Performing Loans $m 444 525 400 327 NPL / Gross Loans and Other Rec % 1.3% 1.5% 1.1% 0.9% Total Provisions $m 254 413 138 (115) Total Prov. / Gr. Loans & Oth Rec % 0.7% 1.2% 0.4% (0.3)% Individual Provision $m 174 220 (28) (266) Individual Provision Cover % 39.1% 41.9% (7.0)% (81.6)% Collective Provision $m 80 193 166 151 Collective Prov. / Perform. Loans % 0.2% 0.6% 0.5% 0.4% Impairment Charges / Avg RWA % 1.0% 1.9% 0.5% 0.6% Imp Assets / Gr. Loans & Oth Rec % 1.3% 1.5% 1.1% 0.9% Impaired asset coverage % 39.1% 41.9% (7.0)% (81.6)% Collective Provision / RWA % 0.4% 0.9% 0.8% 0.7% BDD / Gr. loans and Oth Rec % 0.6% 1.1% 0.3% 0.3% WEALTH MANAGEMENT Funds Under Administration $m 0 0 0 0 Inforce Premiums $m 0 0 0 0 Funds Mgt Revenue Margin % 0.0% 0.0% 0.0% 0.0% Life Insurance Revenue margin % 0.0% 0.0% 0.0% 0.0% Shareholder Invest. Returns % 0.0% 0.0% 0.0% 0.0%
  • 10. 10 RESEARCH RECOMMENDATION DEFINITIONS Positive Stock is expected to outperform the S&P/ASX 200 over the coming 24 months Neutral Stock expected to perform in line with the S&P/ASX 200 over the coming 24 months Negative Stock is expected to underperform the S&P/ASX 200 over the coming 24 months Speculative Stock has limited history from which to derive a fundamental investment view or its prospects are highly dependent on event risk, eg. Successful exploration, scientific breakthrough, high commodity prices, regulatory change, etc. Suspended Stock is temporarily suspended due to compliance with applicable regulatory and/or Evans & Partners policies in circumstances where Evans & Partners is acting in an advisory capacity. Not Rated Stock is not included in our investment research universe. Research Criteria Definitions Recommendations are primarily determined with reference to how a stock ranks relative to the S&P/ASX 200 on the following criteria: Valuation Rolling 12 month prospective multiples (composite of Price-to-Earnings Ratio, Dividend Yield and EV/EBITDA), or long-term NPV for resource stocks. Earnings Outlook Forecast 2 year EPS growth. Earnings Momentum Percentage change in the current consensus EPS estimate for the stock (rolling 1 year forward basis) over the consensus EPS estimate for the stock 3 months ago. Shareholder Returns Composite of forecast ROE (rolling 1 year forward basis) and the percentage change in ROE over 2 years. Debt Servicing Capacity Rolling 12 month EBIT Interest Cover ratio. Cyclical Risk Qualitative assessment of the 2 year outlook for a stock/industry’s profit cycle. Industry Quality Qualitative assessment of an industry’s growth/returns potential and company specific management capability. Financial Transparency If we don’t understand it, we won’t recommend it. For stocks where Evans & Partners does not generate its own forecasts, Bloomberg consensus data is used. Analysts can introduce other factors when determining their recommendation, with any material factors stated in the written research where appropriate.
  • 11. 11 GENERAL RESEARCH DISCLAIMER, WARNING & DISCLOSURES This document is provided by Evans and Partners ABN 85 125 338 785, holder of AFSL 318075. The information is general advice only and does not take into consideration an investor’s objectives, financial situation or needs. Before acting on the advice, investors should consider the appropriateness of the advice, having regard to the investor’s objectives, financial situation and needs. If the advice relates to a financial product that is the subject of a Product Disclosure Statement (e.g. unlisted managed funds) investors should obtain the PDS and consider it before making any decision about whether to acquire the product. The material contained in this document is for information purposes only and does not constitute an offer, solicitation or recommendation with respect to the purchase or sale of securities. It should not be regarded by recipients as a substitute for the exercise of their own judgment. Investors should be aware that past performance is not an infallible indicator of future performance and future returns are not guaranteed. Any opinions and/or recommendations expressed in this material are subject to change without notice and Evans and Partners is not under any obligation to update or keep current the information contained herein. References made to third parties are based on information believed to be reliable but are not guaranteed as being accurate. This document is provided to the recipient only and is not to be distributed to third parties without the prior consent of Evans and Partners. EVANS AND PARTNERS DISCLOSURE OF INTERESTS Evans and Partners and its respective officers and associates may have an interest in the securities or derivatives of any entities referred to in this material. Evans and Partners does, and seeks to do, business with companies that are the subject of its research reports. EVANS AND PARTNERS CORPORATE RELATIONSHIP DISCLOSURE AFI: Evans and Partners have arranged, managed or co-managed a public offering of the company or its affiliates in the past 12 months. AQHHA: Evans and Partners have arranged, managed or co-managed a public offering of the company or its affiliates in the past 12 months. BENPD: Evans and Partners managed or co-managed a public offering of securities of the company or its affiliates in the past 12 months. BHP: A director of Evans and Partners Pty Ltd Advisory Board is a director of BHP Billiton Ltd. BSL: A director of Evans and Partners Pty Ltd Advisory Board is a director of BlueScope Steel Ltd. BOQ, BOQPA, BOQPC: A director of Evans and Partners Pty Ltd Advisory Board is a director of Bank of Queensland. CNGHA: Evans and Partners managed or co-managed a public offering of securities of the company or its affiliates in the past 12 months. HBSHB: Evans and Partners managed or co-managed a public offering of securities of the company or its affiliates in the past 12 months. HHY: Evans and Partners has been appointed by the Issuer as Broker to an on-market buy-back. Accordingly, Evans and Partners is unable to give Sellers advice in respect to a sale of this security. LLC: A director of Evans and Partners Pty Ltd Advisory Board is a director of Lend Lease Corporation Ltd. MQG: MQCPA: A director of Evans and Partners Pty Ltd Advisory Board is a director of Macquarie Group Ltd. MGR: A director of Evans and Partners Pty Ltd Advisory Board is a director of Mirvac Group. NXT: Evans and Partners has been appointed as Lead Manager to the proposed IPO of the Asia Pacific Data Centre Trust by NXT and expects to receive fees for acting in this capacity. ORG: A director of Evans and Partners Pty Ltd Advisory Board is a director of Origin Energy Ltd. OOH: Evans and Partners have arranged, managed or co-managed a public offering of the company or its affiliates in the past 12 months. SAR: Evans and Partners managed or co-managed a public offering of securities of the company or its affiliates in the past 12 months. SPT: Evans and Partners acted in an advisory capacity for the bidder in relation to the proposed offer made to Spotless Group as announced 9 May 2011. SWM: A director of Evans and Partners Pty Ltd Board is a director of Seven West Media Ltd. TTSHA: Evans and Partners managed or co-managed a public offering of securities of the company or its affiliates in the past 12 months. TOX: Evans and Partners managed or co-managed a public offering of securities of the company or its affiliates in the past 12 months. WHF: Evans and Partners managed or co-managed a public offering of securities of the company or its affiliates in the past 12 months. RESEARCH ANALYST CERTIFICATION I, George Gabriel, CFA, hereby certify that all the views expressed in this report accurately reflect my personal views about the subject investment theme &/or company securities. I also certify that no part of my compensation was, is, or will be, directly or indirectly, related to the specific recommendations or views expressed in this report. RESEARCH ANALYST DISCLOSURE OF INTEREST I, George Gabriel, CFA, &/or entities in which I have a pecuniary interest, have an exposure to the following securities &/or managed products: TGA. DISCLAIMER Except for any liability which cannot be excluded, Evans & Partners, its directors, employees & agents accept no liability or responsibility whatsoever for any loss or damage of any kind, direct or indirect, arising out of the use of all or any part of this material. All information is correct at the time of publication; additional information may be available upon request.