

Recommended
More Related Content
What's hot
What's hot (17)
Similar to Ir mass interpration
Similar to Ir mass interpration (20)
More from Ganesh Shinde
More from Ganesh Shinde (20)
Recently uploaded
Recently uploaded (20)
Ir mass interpration
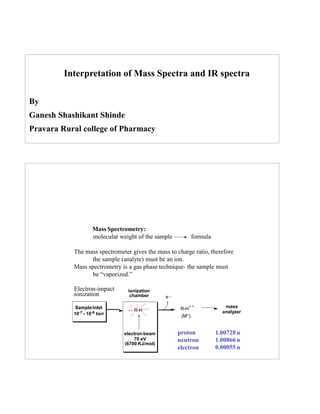
- 1. Interpretation of Mass Spectra and IR spectra By Ganesh Shashikant Shinde Pravara Rural college of Pharmacy Mass Spectrometry: molecular weight of the sample formula The mass spectrometer gives the mass to charge ratio, therefore the sample (analyte) must be an ion. Mass spectrometry is a gas phase technique- the sample must be “vaporized.” Electron-impact ionization SampleInlet 10-7 - 10-8 torr R-H electron beam 70 eV (6700 KJ/mol) e _ + mass analyzer ionization chamber R-H (M+) proton neutron electron 1.00728 u 1.00866 u 0.00055 u 1
- 2. Magnetic Field, Bo mass m charge = = B2 r2 z 2V B= magnetic field strength r= radius of the analyzer tube V= voltage (accelerator plate) The Mass Spectrometer Ionization chamber Ions of selected mass/chargeratio are detected Ions of non-selected mass/charge ratio are not detected Molecular Ion (parent ion, M)= molecular mass of the analyte; sample minus an electron Nitrogen rule: organic molecules with an odd mass must have an odd number of nitrogens. Organic molecules with an even mass have an even number of nitrogens (0 is an even number) Base peak- largest (most abundant) peak in a mass spectra; arbitarily assigned a relative abundance of 100%. If the mass can be determined accurately enough, then the molecular formula can be determined (high resolution mass spectrometry) - double focusing mass spectrometer 2
- 3. Exact Masses of Common Natural Isotopes Isotope mass natural abundance 1H 1.00782 99.985 2H 2.01410 0.015 12C 12.0000 98.892 13C 13.00335 1.108 (1.11%) 35Cl 34.96885 75.77 37Cl 36.96590 24.23 (32.5%) 79Br 78.9183914N 14.00307 99.634 50.69 81Br 80.9164215N 15.00010 0.366 (0.38%) 49.31 (98%) 16O 15.99491 99.763 127I 126.90447 100.00 17O 16.99913 0.037(0.04%) 18O 17.99916 0.200(0.20%) Isotope mass natural abundance 19F 18.99840 100.00 N3O 58.0042 N4H2 58.0280 CNO2 57.9929 CH2N2O 58.0167 CH4N3 58.0406 C2H2O2 58.0054 C2H4NO 58.0293 C2H6N2 58.0532 C3H6O 58.0419 C3H6N 58.0657 C4H10 58.0783 High resolution mass spectrometry can give the formula of the sample mass= 58 For mass = 200, there are at least 51 empirical formulas with C,H,N,O 3
- 4. The radical cation (M•) is unstable and will fragment into smaller ions + H H C H H H H C H H + H+ H H C + H m/z = 15 charge neutral not detected + H C H H+ charge neutral m/z = 14 not detected - e _ m/z=15 m/z=14 (M) m/z=17 (M+1) H H H H C C C H H H H - e_ H H H H C C C H H H H + H H H H H C C C + + H H H charge neutral not detectedm/z = 43m/z = 44 H H H H C C C H H H H - e_ + H C H H + H H H H C C + + C H H H H H H H C C + H H m/z = 29 charge neutral charge neutral m/z = 15 not detected not detected -or- m/z=15 m/z=29 m/z=43 m/z=45 (M+1) (M) 4
- 5. CH3 H3C C CH3 CH3 - e _ + +CH3 H3C C CH3 CH3 m/z = 72 H C H H charge neutral not detected + H3C C CH3 CH3 m/z = 57 m/z=57 No molecularion m/z=72 Mass spectra can be quite complicated and interpretation difficult. Some functional groups have characteristic fragmentation (sect. 12.4) It is difficult to assign an entire structure based only on the mass spectra. However, the mass spectra gives the mass and formula of the sample which is very important information. To obtain the formula, the molecular ion must be observed. soft ionization techniques (chemical ionization, fastatom bombardment) Methods have been developed to get large molecules such as polymers and biological macromolecules (proteins, peptides, nucleic acids) into the vapor phase (matrix-assisted laser desorption ionization and electrospray ionization) 5
- 6. Spectroscopy and the Electromagnetic Spectrum Electromagnetic (EM) radiation = light matter energy photon (quanta) Spectroscopy: the interaction of EM radiation with matter (organic molecule) light (h) organic molecule (ground state) organic molecule (higher energy state) organic molecule (ground state) + h * relax absorption emission quantized energy levels: the energy states are at discrete levels; there is no continuum between these levels E = h = c/ hc c = speed of light (3 x 1010 cm•sec-1) = wavelength (distance of one wave) = frequency: number of waves per unit time (sec-1 , Hz) h = Planck’s constant = 6.62 x 10⁻³⁴ J•sec-1 E E 6
- 7. The Electromagnetic Spectrum Increasing Energy Longer wavelength () Infrared: molecular vibrations; stretching and bending of bonds - identify functional groups (Ch. 12) Radiowaves: nuclear magnetic resonance spectroscopy; nuclear magnetic moments versus an external magnetic field - gives a H and C map of the molecule (Ch. 13) UV-vis: valance electron transitions; types of -bonds (Ch. 14) 7
- 8. Infrared Spectroscopy: Vis Near IR Infrared (IR) Far IR microwave 2.5 x 10⁻⁴ cm 2.5m 2.4 x 10⁻³ cm 25 m 10-4 10-2 _ 4000 _ 400 E 1 is expressed as (wavenumber), reciprocal cm (cm-1) _ = 1 _ E therefore _ Symmetric stretch Antisymmetric stretch In-plane bend Out-of-plane bend Absorption of infrared radiation causes bonds within a molecule to vibrate, stretch and bend. Bonds behave likes springs. Stretch- deforms bond length http://www2.chem.ucalgary.ca/Flash/photon.html Bend- deform bond angle 8
- 9. Bond Stretch: Hooke’s Law _ 1 2 c f mx my mx + my 1 2 X Y _ = vibrational frequency c = speed of light mx = mass of X my = mass of Y mx my mx + my = reduced mass () f = spring constant; type of bond between X and Y (single, double or triple) _ E f Hooke’s law simulation: http://www2.chem.ucalgary.ca/Flash/hooke.html Interpretation of an Infrared Spectra: organic molecules contain many atoms. As a result, there are many stretching and bending modes- IR spectra have many absorption bands Four distinct regions of an IR spectra X-H singlebond region triple bond region double bond region fingerprint region 4000 cm-1 600 cm-12500 cm-1 2000 cm-1 1500 cm-1 9
- 10. Fingerprint region (600 - 1500 cm-1)- low energy single bond stretching and bending. The fingerprint region is unique for a given organic compound and is thus used to identify them. However there are few diagnostic absorptions. Double-bond regions (1500 - 2000 cm-1) C=C 1650 - 1670 cm-1 C=O 1670 - 1780 cm-1 Triple-bond region: (2000 - 2500 cm-1) CC 2100 - 2260 cm-1 (weak, often not observed) CN 2200 - 2260 cm-1 X-H Single-bond region (2500 - 4000 cm-1) O-H 3300 - 3600 cm-1 N-H 3300 - 3600 cm-1 C-H 2700 - 3000 cm-1 sp3 -C-H 2850 - 3000 cm-1 sp2 =C-H 3000 - 3100 cm-1 sp C-H ~3300 cm-1 Conjugation moves the C=O stretch to lower energy (right) H Carbonyl groups: O O O H3C CH3 O O O aliphatic aldehyde 1730 cm-1 aliphatic ketone 1715 cm-1 OCH3 aliphatic ester 1735 cm-1 H conjugated aldehyde 1705 cm-1 CH3 conjugated ketone 1690 cm-1 OCH3 conjugated ester 1715 cm-1 H O aromatic aldehyde 1705 cm-1 CH3 O aromatic ketone 1690 cm-1 OCH3 O aromatic ester 1715 cm-1 10
- 11. Cyclic Ketones: CH3 O H3C CH3 O conjugated ketone 1690 cm-1 CH3 aliphatic ketone 1715 cm-1 O aromatic ketone 1690 cm-1 O O O O 1715 cm-1 1750 cm-1 1780 cm-1 1815 cm-1 Ring strain moves the C=O absorption to higher energy (left) medium - strong medium strong weak strong Alkynes 3020 - 3100cm-1 1640 - 1680cm-1 3030 cm-1 1660 - 2000cm-1 1450 - 1600cm-1 3300 cm-1 2100-2260 strong weak - medium 1050 - 1150cm-1 3400 - 3600cm-1 strong strong and broad 1030 - 1230cm-1 3300 - 3500cm-1 medium medium Table 12.1 (page 458) Alkenes =C-H C=C Aromatic =C-H C=C C-H CC Alcohols C-O O-H Amines C-N N-H Carbonyl 1670 - 1780 cm-1 strong 2500 - 3500 cm-1 strong and very broad C=O Carboxylic acids O-H Nitrile CN 2210 - 2260 medium 11