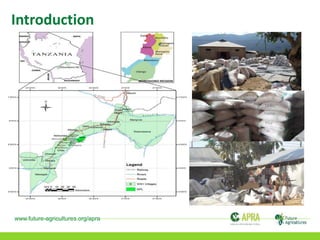
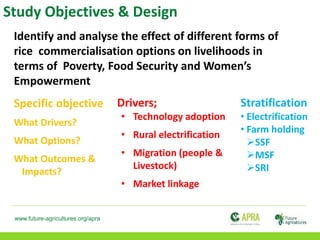
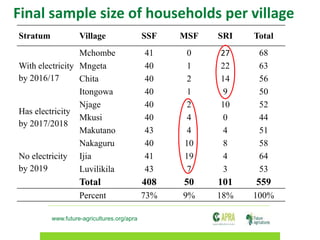
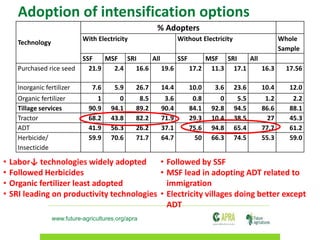
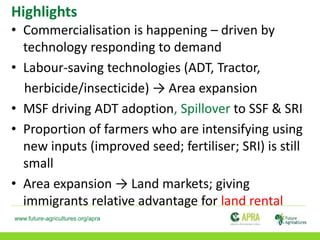
Dynamics of Rice Commercialisation
in Tanzania
Aida Isinika – Sokoine University of Agriculture, Tanzania
Christopher Magomba – Sokoine University of Agriculture, Tanzania
APRA Work Stream 1 Panel Study Review and Planning Workshop
Afrint-APRA Seminar, IDS, Brighton - 3 October 2018
Funded by UK aid from the UK Government
www.future-agricultures.org/apra
Introduction
www.future-agricultures.org/apra
Study Objectives & Design
Drivers;
• Technology adoption
• Rural electrification
• Migration (people &
Livestock)
• Market linkage
Stratification
• Electrification
• Farm holding
SSF
MSF
SRI
Identify and analyse the effect of different forms of
rice commercialisation options on livelihoods in
terms of Poverty, Food Security and Women’s
Empowerment
Specific objective
What Drivers?
What Options?
What Outcomes &
Impacts?
www.future-agricultures.org/apra
Stratum Village SSF MSF SRI Total
With electricity
by 2016/17
Mchombe 41 0 27 68
Mngeta 40 1 22 63
Chita 40 2 14 56
Itongowa 40 1 9 50
Has electricity
by 2017/2018
Njage 40 2 10 52
Mkusi 40 4 0 44
Makutano 43 4 4 51
Nakaguru 40 10 8 58
No electricity
by 2019
Ijia 41 19 4 64
Luvilikila 43 7 3 53
Total 408 50 101 559
Percent 73% 9% 18% 100%
Final sample size of households per village
www.future-agricultures.org/apra
Adoption of intensification options
Technology
% Adopters
With Electricity Without Electricity Whole
Sample
SSF MSF SRI All SSF MSF SRI All
Purchased rice seed 21.9 2.4 16.6 19.6 17.2 11.3 17.1 16.3 17.56
Inorganic fertilizer 7.6 5.9 26.7 14.4 10.0 3.6 23.6 10.4 12.0
Organic fertilizer 1 0 8.5 3.6 0.8 0 5.5 1.2 2.2
Tillage services 90.9 94.1 89.2 90.4 84.1 92.8 94.5 86.6 88.1
Tractor 68.2 43.8 82.2 71.9 29.3 10.4 38.5 27 45.3
ADT 41.9 56.3 26.2 37.1 75.6 94.8 65.4 77.7 61.2
Herbicide/
Insecticide
59.9 70.6 71.7 64.7 50 66.3 74.5 55.3 59.0
• Labor↓ technologies widely adopted
• Followed Herbicides
• Organic fertilizer least adopted
• SRI leading on productivity technologies
• Followed by SSF
• MSF lead in adopting ADT related to
immigration
• Electricity villages doing better except
ADT
www.future-agricultures.org/apra
Main alternative income
10.2
44
57.2
25.9
4.85.5
60.7
36.8
17.9
3.5
7.6
53.1
46.1
21.5
4.1
0
10
20
30
40
50
60
70
Regulary
employment
Casual labour Household
Enterpise
Gift&Remittance Social transfer
%
Main alternative income source
With electricity Without electricity Total
www.future-agricultures.org/apra
Highlights
• Commercialisation is happening – driven by
technology responding to demand
• Labour-saving technologies (ADT, Tractor,
herbicide/insecticide) → Area expansion
• MSF driving ADT adoption, Spillover to SSF & SRI
• Proportion of farmers who are intensifying using
new inputs (improved seed; fertiliser; SRI) is still
small
• Area expansion → Land markets; giving
immigrants relative advantage for land rental
www.future-agricultures.org/apra
The Team
Team Member Organisational
Affiliation
Area of Responsibility
Aida Isinika Sokoine University of
Agriculture(SUA)
Research leader/ Qualitative
Gilead Mlay SUA Quantitative (sampling & data
analysis)
Christopher Magomba SUA Quantitative/ Data analysis
Kizito Mwajombe SUA Extension/ Sociology
Jeckonia John SUA Political Scientist
Devotha Kilave SUA Gender/ nutrition
Ntengua Mdoe SUA Advisor
Isack Minde SUA Advisor
Colin Poulton SOAS Advisor

APRA Tanzania Work Stream 1 Update

  • 1.
    Dynamics of RiceCommercialisation in Tanzania Aida Isinika – Sokoine University of Agriculture, Tanzania Christopher Magomba – Sokoine University of Agriculture, Tanzania APRA Work Stream 1 Panel Study Review and Planning Workshop Afrint-APRA Seminar, IDS, Brighton - 3 October 2018 Funded by UK aid from the UK Government www.future-agricultures.org/apra
  • 2.
  • 3.
    www.future-agricultures.org/apra Study Objectives &Design Drivers; • Technology adoption • Rural electrification • Migration (people & Livestock) • Market linkage Stratification • Electrification • Farm holding SSF MSF SRI Identify and analyse the effect of different forms of rice commercialisation options on livelihoods in terms of Poverty, Food Security and Women’s Empowerment Specific objective What Drivers? What Options? What Outcomes & Impacts?
  • 4.
    www.future-agricultures.org/apra Stratum Village SSFMSF SRI Total With electricity by 2016/17 Mchombe 41 0 27 68 Mngeta 40 1 22 63 Chita 40 2 14 56 Itongowa 40 1 9 50 Has electricity by 2017/2018 Njage 40 2 10 52 Mkusi 40 4 0 44 Makutano 43 4 4 51 Nakaguru 40 10 8 58 No electricity by 2019 Ijia 41 19 4 64 Luvilikila 43 7 3 53 Total 408 50 101 559 Percent 73% 9% 18% 100% Final sample size of households per village
  • 5.
    www.future-agricultures.org/apra Adoption of intensificationoptions Technology % Adopters With Electricity Without Electricity Whole Sample SSF MSF SRI All SSF MSF SRI All Purchased rice seed 21.9 2.4 16.6 19.6 17.2 11.3 17.1 16.3 17.56 Inorganic fertilizer 7.6 5.9 26.7 14.4 10.0 3.6 23.6 10.4 12.0 Organic fertilizer 1 0 8.5 3.6 0.8 0 5.5 1.2 2.2 Tillage services 90.9 94.1 89.2 90.4 84.1 92.8 94.5 86.6 88.1 Tractor 68.2 43.8 82.2 71.9 29.3 10.4 38.5 27 45.3 ADT 41.9 56.3 26.2 37.1 75.6 94.8 65.4 77.7 61.2 Herbicide/ Insecticide 59.9 70.6 71.7 64.7 50 66.3 74.5 55.3 59.0 • Labor↓ technologies widely adopted • Followed Herbicides • Organic fertilizer least adopted • SRI leading on productivity technologies • Followed by SSF • MSF lead in adopting ADT related to immigration • Electricity villages doing better except ADT
  • 6.
    www.future-agricultures.org/apra Main alternative income 10.2 44 57.2 25.9 4.85.5 60.7 36.8 17.9 3.5 7.6 53.1 46.1 21.5 4.1 0 10 20 30 40 50 60 70 Regulary employment Casuallabour Household Enterpise Gift&Remittance Social transfer % Main alternative income source With electricity Without electricity Total
  • 7.
    www.future-agricultures.org/apra Highlights • Commercialisation ishappening – driven by technology responding to demand • Labour-saving technologies (ADT, Tractor, herbicide/insecticide) → Area expansion • MSF driving ADT adoption, Spillover to SSF & SRI • Proportion of farmers who are intensifying using new inputs (improved seed; fertiliser; SRI) is still small • Area expansion → Land markets; giving immigrants relative advantage for land rental
  • 8.
    www.future-agricultures.org/apra The Team Team MemberOrganisational Affiliation Area of Responsibility Aida Isinika Sokoine University of Agriculture(SUA) Research leader/ Qualitative Gilead Mlay SUA Quantitative (sampling & data analysis) Christopher Magomba SUA Quantitative/ Data analysis Kizito Mwajombe SUA Extension/ Sociology Jeckonia John SUA Political Scientist Devotha Kilave SUA Gender/ nutrition Ntengua Mdoe SUA Advisor Isack Minde SUA Advisor Colin Poulton SOAS Advisor

Editor's Notes

  • #2 Please prepare a fairly detailed presentation of your study design, methodology, descriptive statistics, emerging findings and next steps.
  • #3 Include a map of your field sites Please add one or two photos from your first round fieldwork and/or team training and planning. These could be added to other slides, if space allows.
  • #4 Include a map of your field sites Please add one or two photos from your first round fieldwork and/or team training and planning. These could be added to other slides, if space allows.
  • #5 Sample size: How was this determined? Report the sampling strategy, including the definition of the sampling unit, the sample size required to meet the objectives and the sampling design used to get the sample from the target population.
  • #8 You can’t cover everything in a short presentation, so please try to select one or two ‘gems’ or ‘nuggets’ (i.e. exciting findings or unexpected outcomes) to report to the audience!
  • #9 List key team members Explain who is doing what – the roles and responsibilities