
Recommended
Recommended
More Related Content
Similar to Student ________________________ Course-Section ______________.docx
Similar to Student ________________________ Course-Section ______________.docx (20)
More from florriezhamphrey3065
More from florriezhamphrey3065 (20)
Recently uploaded
Recently uploaded (20)
Student ________________________ Course-Section ______________.docx
- 1. Student: ________________________ Course-Section: ______________________ Date: ___________ MATH Assignment for Core Assessment, 2017-18 Job opportunity surveys have consistently shown a high demand for those who can use mathematics to model complex processes and make informed predictions of the future. With this assignment, the student has the opportunity to demonstrate his or her level of sophistication with respect to the key, in-demand skills of communication, quantitative literacy, and critical thinking. One skill of critical thinking involves evaluating information taken from sources and questioning its authenticity. This assignment may contain questionable information. Objective: You are to consider the implications of rising tuition costs and make better, more informed life decisions with respect to course load. Specifically, you will estimate the tuition costs in the year 2019 - 2020. Answer the following questions using complete sentences. I. Visual Communication (the ability to recognize and understand ideas conveyed through visible images.) The attached set of images, “Are you on the Fast-Track?” is found on the Eastfield College website. Although figure numbers are not actually printed on the graphic, consider Figure 1 as being “Time Is Money”. This particular image will not be used in this assignment. Consider Figure 2 as relating the number of classes taken per semester to the time required to complete a degree. Consider Figure 3 as the COST graph, predicting costs of tuition (the smooth solid (red) line with an arrow.) (Perhaps writing “Fig. 2” and “Fig 3” beside these images would be helpful.) 1. Description of the image For Figure 2, “Number of classes” and Figure 3, “Cost,”
- 2. identify the type of graph. Choose one of the following: line graph, bar graph, picture graph, or pie (circle) graph. a. Figure 2 is a _______________________________ b. Figure 3 is a _______________________________ c. Explain how the choice of books and caps as icons in Figure 2 affect the image’s message._____________________________________________ _____________________________________________________ _____________________________________________________ __________ d. What other icons would you suggest that could convey the message of Figure 2? _____________________________________________________ _____________________________________________________ _____________________________________________________ __________ 2. Explanation (meanings and purposes of the image) a. How do you interpret the message of Figure 2 (books and caps)? _____________________________________________________ ____________________________ b. How do you interpret the message of Figure 3 (colored lines)? _____________________________________________________ ____________________________ 3. Consequences and Implications a. In Figure 2 (books and caps), the choice of taking 4 classes per semester (a full load) is conspicuously absent. Assuming 4 classes per semester, how many years do you think it would take to complete an Associates Degree? _____________________________________________________ ____________________________ b. For whom are Figures 2 and 3 designed? _____________________________________________________ _____________________________________________________
- 3. _____________________________________________________ ___ c. What do you need to do based on the suggestion of this visual graphic? _____________________________________________________ __________________________ II. Quantitative Literacy (using numerical data to reason and accurately solve quantitative problems.) 1. Interpretation a. Explain the information presented in Table 1 (Note: Table 1- A costs have been adjusted for inflation relative to the 2014- 2015 school year costs. Table 1-B costs represent actual costs at that time for that specific school year.) _____________________________________________________ _____________________________________________________ _____________________________________________________ ___________ b. Notice that all of the numbers in Table 1-A and 1-B differ for the same school year period except for the last column of $2286. Why is this? _____________________________________________________ _________________________ 2. Representation (converting information into mathematical forms) 3. Calculations a. Compute the average (the mean) tuition costs for public two- year colleges, using Table 1-B. _____________________________________________________ _____________________________________________________ _____________________________________________________ ___ b. Find the median of Table 1-A. ___________________________________________________
- 4. c. Find the mode of Table 1-A. _____________________________________________________ d. Now round the numbers in Table 1-A to the nearest $10. Find the mode using these rounded figures. __________________ e. How much did tuition increase from 2004 through 2015 from Table 1-A? _____________________________________________________ ____________________________ Find the average increase per year: ______________________________________________ f. How much did tuition increase from 2004 through 2015 from Table 1-B? _____________________________________________________ ____________________________ Find the average increase per year: ______________________________________________ g. Using your averages in (e) and (f), estimate: Tuition in 2019-2020 in 2014 dollars (Table 1-A): _________________________________ Tuition in 2019-2020 in current dollars (Table 1-B): ______________________________ 4. Application/Analysis Make a judgment and draw appropriate conclusions based on the quantitative analysis of the data in Table 1 using your math model. Recognize the limits of this analysis. _____________________________________________________ _____________________________________________________ _____________________________________________________ ___________ 5. Assumptions What assumptions were made in your estimate of tuition costs in Part II.3.g? _____________________________________________________
- 5. _____________________________________________________ _____________________________________________________ ___________ 6. Use of quantitative information Which calculations in Section II.3 above might satisfy the stated objective of estimating tuition costs in the year 2019- 2020? Explain. _____________________________________________________ ________________________________ _____________________________________________________ _____________________________ III. Critical Thinking (exploring issues and ideas before accepting or formulating an opinion or conclusion.) 1. Explanation What exactly are you being asked to do with this assignment? _____________________________________________________ _____________________________________________________ _____________________________________________________ ___________ 2. Evidence What are the sources of data used in this problem? a. Source of EFC data in Figure 3, the COST graph: ______________________________________ b. Source of data of Table 1? __________________________________________ Are there other sources of information which could be considered? _____________________________________________________ _____________________________________________________ _____________________________________________________ ___________ 3. Influence of context and assumptions a. What mathematical assumptions do you think were made in
- 6. deriving Fig 3, the COST graph? _____________________________________________________ _____________________________________________________ _____________________________________________________ ___ b. Compare your cost estimates in 2020 using Table 1, A and B, (Part II.3.g) with the cost estimates in Figure 3 of the EFC image. (The smooth solid (red) line with the arrow is the tuition cost line.) _____________________________________________________ _____________________________________________________ _____________________________________________________ ___ c. What contextual influences of cultural, social, political, philosophical, and/or historical do you recognize? _____________________________________________________ _____________________________________________________ _____________________________________________________ ___ 4. Conclusions What conclusions can be made from your analysis? _____________________________________________________ _____________________________________________________ _____________________________________________________ ___________ 5. Application What do you need to do based on your consideration of the factors in this study? _____________________________________________________ _____________________________________________________ _____________________________________________________ ___________ --------------------------------------------------------------------------- ----------------------------------------------- ---------------------------------------------------------------------------
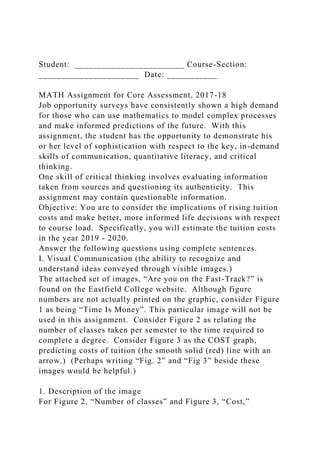
- 7. ----------------------------------------------- Graphic by: Liliana Rodriguez Page 3 of 4 TABLE 1. Average Published Tuition and Fees in Current Dollars and in 2014 Dollars, by State, 2004-05 to 2014-15 In 2014 Dollars2004-052005-062006-07 2007-08 2008-092009- 10 2010-112011-122012-132013-142014-15 Texas$1,738$1,791$1,885$1,886$1,800$1,932$2,030$2,151$2,2 32$2,248$2,286 Table 1-A In Current Dollars2004-052005-062006-07 2007-08 2008- 092009-10 2010-112011-122012-132013-142014-15 Texas$1,382$1,469$1,610$1,649$1,662$1,746$1,858$2,040$2,1 46$2,204$2,286 Table 1-B SOURCE: The College Board, Annual Survey of Colleges. Note: Average tuition and fee prices are weighted by full-time enrollment. Public Two-Year In-District Tuition and Fees Public Two-Year In-State Tuition and Fees Literacy in Media. You have earned 0 point(s) out of 0 point(s) thus far. Historical Development of Media in the U.S. The Historical Foundation of U.S. Media. With media filling our lives, from television to cellphones, they can have undue influence on us in how we make decisions and use our time; unless we understand how they make their messages and how we receive them. Media literacy can be defined here as “Understanding a message’s design, its underlying messages and the filtering that selects what is left in and kept out.” We start developing this literacy in you by covering US media in the three areas of historical background,
- 8. grammar and commercialization. A. The first element of literacy is understanding it's Historical Development. 1 Media in the US developed on a for-profit basis. In the early 1800's the Us government made a fateful decision that transportation, communication and media should all be operated by private corporations, rather than the government. This followed the philosophy of small government and has been maintained since. a. In 1840 the first successful telegraph line between Washington and Baltimore was funded by the government, who then handed it over to private development, which became the Western Union monopoly. This pattern was maintained for later systems of railroads, telephone systems, radio and television networks, and the internet. A result of this is systems that focus first on profitability rather than a less-clear concept of "public good". For example the Public Broadcasting system in the US received approximately $1.40 per citizen in funding. Most of its revenue comes from corporate and individual donations, making it difficult to compete with entertainment networks for audience share. Compare this to the alternative British Broadcasting Corporation model which receives tax revenue at a level of approximately $16 per citizen. b. Other countries chose to follow different patterns of direct government control. This is seen today in systems such as the popular German rail system, BBC television and France Telecom, the national government-owned telephone system. c. Regulation is an attempt by the government to counteract the negative effects of for-profit forces that can work against the public good. This is a continual conflict
- 9. between the concept of "public good" and for-profit organizations. i. The most common regulation is anti-trust to try to prevent Monopoly systems limiting what the public gets. For example Newscorp, parent of Fox, has had to work around regulations by limiting its ownership of both television stations and newspapers in one market, and keep from gaining too much control in media delivery. ii. Recent regulation on Net neutrality was used to keep ISP systems, such as Comcast, from throttling your internet speed, charging more for sites such as Netflix, filtering sites, etc. That has helped prevent the internet being run like cable television: 2. Sociocultural influences direct what is developed as much as, or more than, pure reason would dictate. The specifics of a culture can make media decisions that aren't predictable by business calculations. a. Videoconferencing is a good alternative to the expensive and time-consuming flights needed for face-to-face meetings. Yet in the US these were little used because of the popular appeal of 'business travel'. Only after business expense cutbacks and the 9/11 flight limits, was videoconferencing commonly used. It was found to work fine and was cheaper. b. The telephone was designed as a business device in the U.S. The company even developed a series of advertisements to train people how to communicate briefly for quick commercial purposes only. But the culture of people here kept using the telephone for social calls and personal interaction until finally the system had to accommodate them.
- 10. c. The US is more comfortable with having limited privacy than other cultures. Thus we have fast-growing use of Youtube submissions, Google sites that provide information on ourselves and homes, and sites such as Facebook that favor very little personal privacy in favor of publicity. This is less popular in Europe and their searches and websites are different in what you can find because of it. 3. Technological development is stifled by inertia. Once a system is in place, it tends to limit development of alternatives. Our internet systems, for example, are slower than much of the world as ours is built on the slower systems of telephone and cable systems. a. The US is ranked 26th for internet speed and penetration. Our early systems of telephone and cable at “good enough” levels keep us from putting in better systems like South Korea has. b. People use older internet browsers not because they are better, but because they are comfortable and familiar with what they first experienced. They often stop looking for better alternatives. B. Digital media is the biggest concern in media today because it threatens all pre-existing business models. 1. Prior media systems depended on controlling access to a limited amount of content. They profited by providing what was difficult for the public to get. i. A small town with a single movie theater offered usually only 2 films per week. With such limited choice, many people would pay to see whatever was offered.
- 11. ii. Most towns have only one newspaper. They can charge more to advertisers and subscribers who want local news. iii. Television networks in the 1960's had only 3 networks. If you wanted entertainment or news at home, these were your only choices. 2. Digital systems provide a variety of media forms anywhere, at any time, at very low cost. Providers must essentially adapt to this new system or perish. i. Digital books have already become popular enough to result in the closing of bookstores and bypass traditional editors and reviewers. With free digital books online, the pressure to change quickly for old book systems is intense. ii. Digital news means that you can find news at anytime and at your convenience: cable, internet, twitter, etc. The developing news sites blend entertainment, news and user commentary together in a form completely foreign to past newspaper and television news patterns. iii. Youtube is taking over, for some, from television programming. Dashcam videos, fail videos, etc are popular enough that some people find them more entertaining than 19 Kids and Counting, or Keeping Up With the Kardashians. 3. Regulation will be a concern in this digital system to try to maintain a public good. The Digital Divide is a problem whereby those with the least education and income, or even just limited access to the internet, can leave them substantially behind in their information and ability to participate. This is already seen in some areas as fast-moving systems are leaving some elements of our society behind. Those who have only the old systems, such as cable television, will be less informed and less involved in our society. The US experiment in media is that it has allowed for private
- 12. development and operation of systems. This has given us service, but not necessarily better in access or content than other systems. The challenge in the future is with digital systems to try to develop these for the public good while maintaining the approach of private companies and limited government regulation. Literacy in Media. You have earned 0 point(s) out of 0 point(s) thus far. Media Grammar The second element in developing your Media Literacy is to increase your understanding of Media Grammar. In writing your grammar knowledge allows you to know how to identify formal, business writing as compared to casual writing. You have a variety of levels you can operate within such as research reports, friendly letters and brief messages. This ability to operate on multiple levels in digital media requires you to know the formats, styles and expectations to meet. A. Each communication medium presents its ideals in a distinct way that has identifiable patterns. 1. Print media developed over a period of centuries and have many subtle cues that most of us can interpret. a. Spacing, size and font selection are all important in our reception of a message. We know that Comic Sans 14 is very different in its appeal than Ariel 10. The Times New Roman font is more “ink efficient” than Ariel. b. Newspapers built on standard expectations of font type and story writing by adding expanded graphics and shortened stories. This has especially increased since the 1980’s, as seen in the following comparison, in order to compete with television.
- 13. i. Some of the more subtle expectations of news grammar is that the first story is most important in newspapers and magazines, with later stories considered as less significant. In addition any story that is not of that day counts for less, regardless of how much research and detail has gone into it. 2. Audio media needs dramatic elements to capture audience interest. With print media we can easily see stunning photos and read startling stories. Audio media, such as radio and music, need to capture our attention with their own unique appeals. a. Sound effects are used to heighten the effect of stories. This was used in radio plays and is often found with radio news emphasizing sounds such as gunfire to grab attention. It provides little information, just emotional appeal. You can find almost any sound effect you can think of to add appeal to your creations. b. Music emphasizes Dramatic singing as if your life depended on it, or uses autotune to create unique effects not found in nature. The more competition there is, the more dramatic you need to be to get noticed. 2000~11 Best Korean Drama Soundtracks(50 Songs) <div class="player-unavailable"><h1 class="message">An error
- 14. occurred.</h1><div class="submessage"><a href="http://www.youtube.com/watch?v=FYHo27cEgZY" target="_blank">Try watching this video on www.youtube.com</a>, or enable JavaScript if it is disabled in your browser.</div></div> c. Music formats are associated with different ages and cultures. We have learned to expect Jazz to be for older and hipper audiences, classical for more educated, dance music for younger audiences. You can see the stability of these expectations when car advertisements use particular music backgrounds to appeal to a target audience. d. Talk radio is competing with many other forms of entertainment and information. In order to succeed it uses dramatic delivery. Most common is the use of outrage and creative delivery over current events. It succeeds on an emotional basis rather than an informative one. 3. Visual media conveys information through subtle design elements. By identifying these elements we can see how the message is constructed and if it is being artistic, or manipulative. See if you can identify any other visual keys besides the 3 following. a. Having very fast cutting of shots tells us that a scene is exciting. If not done well it can tell us that a scene is largely pointless. Slower cutting shows more emotion and emphasizes the story. Watch any one of Key & Peel's clips and identify a visual factor that influenced your evaluation. b. The camera viewpoint favors one subject over others. Note how the simple shooting up or down at a subject influences how we evaluate the subject. 2 c. The placing of people or objects on the right side of the
- 15. screen indicates that they are more important. What is on the left is almost always less so. Almost every talk show, for example, uses this basic set design. B. The Digital grammar is still developing and so we have the opportunity to see the standards being created. Can you identify any one element of a website or digital communication that clearly identifies the originator as professional or amateur? 1. General rules are already being seen in digital grammar: We expect in a Website that the logo is in the upper left of the screen. Hypertext is underlined, regular text is not. Standard icons are used for printing, zooming, etc. Emoticons in texts are shorthand for feelings. 2. Multimedia: It is very easy to combine sight, sound and print in digital media. What is unclear is how to do this and emphasize the key ideas while maintaining interest. Public likes visual the most so most formats highlight video, pictures, graphs. Compare the two websites below and see what elements work best to attract you but not deter you getting the important ideas. 3. Interactivity is an increasing part of digital media. With the
- 16. ability for media to have users customize their experience, those media that allow this are more popular. What is yet to be determined is how much control the user wants. Is the google news website, for example, one that appears professional and desirable in how much you can interact with it? Knowing grammar is recognizing the tools used to construct a message. The best messages used these tools well to communicate ideas and emotions. The lesser messages use them just to grab audiences without much concern about the quality of the messages. You will be learning digital media grammar as it develops in your lifetime. Questions: Describe one element of a good website that you expect. It may be a clear "buy now" placement or a clear search function. Name one site that you find has this element done especially well.