
Recommended
More Related Content
What's hot
What's hot (16)
Similar to Grup 3 graphic organizer pak deden
Similar to Grup 3 graphic organizer pak deden (20)
Recently uploaded
Recently uploaded (20)
Grup 3 graphic organizer pak deden
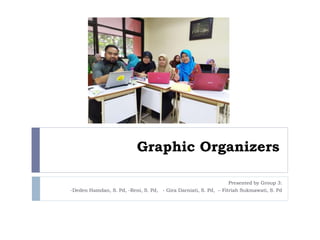
- 1. Graphic Organizers Presented by Group 3: -Deden Hamdan, S. Pd, -Reni, S. Pd, - Gira Darniati, S. Pd, – Fitriah Sukmawati, S. Pd
- 2. DEFINITIONS A graphic organizer is a visual display that demonstrates relationships between facts, concepts or ideas. Its guide learners’ thinking as they fill in and build upon a visual map or diagram In addition to helping students organize their thinking and writing process, graphic organizers can act as instructional tools. Teachers can use graphic organizers to illustrate a student’s knowledge about a topic or section of text showing areas for improvement.
- 3. How To Use Graphic Organizers Graphic organizers are tools that can be used to visualize and organize information. Graphic organizers provide many benefits to students who use them including: Helping students structure writing project Encouraging students to make decisions Making it easy for students to classify ideas and communicate Allowing students to examine relationships Guiding students in demonstrating their thinking process Helping students increase reading comprehension Making it easy to brainstorm Encouraging students to organize essential concepts and ideas Making it clear how to break apart a story into the main elements (intro, rising action, climax, etc.)
- 4. Social function To explain, To describe, To compare - contrast
- 5. Text structure Title Data Labels Data Variables
- 6. Type of Graphic Organizer 1. Types Of Tables, 2. Bar Charts, 3. Flow Charts, 4. Process Diagram, 5. Concept Maps, 6. Mind Maps, 7. Stack Plots, 8. Venn Diagrams, 9. Pie Chart 10. Line Charts
- 7. Table Month of the year Average daytime temperature 0C Average nighttime temperature 0C January 30 19 February 29 20 March 30 21 April 31 21 May 31 22 June 32 23 July 32 23 August 33 27 September 32 23 October 32 23 November 31 22 December 31 21
- 8. Bar Chart
- 9. Flow Chart
- 10. Process Diagram
- 11. Concept Maps
- 13. Mind Map
- 14. Stack Plots/
- 15. Line Charts
- 16. Venn Diagrams
- 17. Pie Charts
- 18. Teaching with Graphic Organizers Cause and effect Note taking Comparing and contrasting concepts Organizing problems and solutions Relating information to main themes and ideas Organizational skills Vocabulary knowledge Sequencing
- 19. Hope It's Useful Thank You Very Much