
Recommended
Recommended
More Related Content
What's hot
What's hot (20)
Similar to Social Media Report Highlights Influencers, Reach & Engagement
Similar to Social Media Report Highlights Influencers, Reach & Engagement (20)
Recently uploaded
Recently uploaded (20)
Social Media Report Highlights Influencers, Reach & Engagement
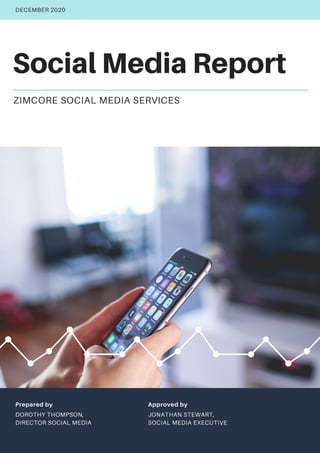
- 1. Social Media Report ZIMCORE SOCIAL MEDIA SERVICES DECEMBER 2020 Prepared by DOROTHY THOMPSON, DIRECTOR SOCIAL MEDIA Approved by JONATHAN STEWART, SOCIAL MEDIA EXECUTIVE
- 2. ZIMCORE SOCIAL MEDIA SERVICES Influencers among Our Followers With the ubiquity of smartphones nowadays, we cannot deny the huge impact of social media in driving consumer behavior. That’s why brands both big and small tap digital platforms in a bid to capture market share. But being online simply isn't enough—brands need to have insights of their consumers’ online behavior, and use that data to drive revenue for their business. This is where social media reports come in. By tinkering with some data points here and there, social media marketers can tell middle managers and top-level executives how their brands are perceived by their customers. More than just the numbers, digital marketers must also create a concise yet effective social media report that is meaningful for all stakeholders involved. Volume of Posts and Reach Rate Before even typing your report, first take the time to consider who the report is for. One good rule of thumb to remember is that the higher up the stakeholder is in the organizational ladder, the more succinct the report needs to be. With the myriad of metrics social media marketers have access to, it’s tempting to drown your audience in numbers. While figures aren't bad per se, you do have to make sure that these are relevant to the role of those receiving the report. Strive to tell the story behind the numbers by including learnings or insights.
- 3. PAGE 02 ZIMCORE SOCIAL MEDIA SERVICES Engagements per Post The next step is to decide what metrics matter to you. Below are some metrics you can start with: 1. Follower growth – the number of people you have reached 2. Influencer report – the influential people in your network 3. Volume of posts – the number of times you have shared content 4. Reach rate – the number of users who have seen your post 5. Total engagement – how much interaction each post generated 6. Engagement per follower – engagement each post generated Engagement per Follower Now that you know your audience and metrics, you can start creating your report. Kick things off by presenting the big picture. Give a snapshot which summarizes how you are doing across all social media platforms. Here, you can do a health check and assess how well these platforms are doing for the reporting period. Remember that you don't have to jam all metrics in one page. Make it easy for your audience by selecting just the top three or four important metrics. Then give a few takeaways, which lets you transition smoothly to the other parts of your report.
- 4. ZIMCORE SOCIAL MEDIA SERVICES Returns to the Website "Our posts on social media have brought more than 500 followers back to our website this month.". After presenting your social media overview, you're ready to show your goals and key initiatives. Start by identifying the objectives that the team has set for the reporting period, then relate these to bigger business objectives. If the team has been embarking on key initiatives, include that here as well. Remember to keep it simple and zero in on your main goals. For context, present data in easy-to- follow charts, which present the progress you have done month to month. Doing so gives you the opportunity to show how your social media program has been improving over time, as well as how these activities are adding value to the organization. While it’s important to mention how great things are going, don't paint an overly rosy picture. Make sure to note gaps in your initiatives, and come up with an action plan on how you will address these issues the next time around.
- 5. PAGE 04 ZIMCORE SOCIAL MEDIA SERVICES Social Referral Traffic Whether you choose to have a monthly or quarterly report, there are some tips you can learn to help your report shine. First is to make the report relevant to your audience. Selecting the right information from a glut of data makes a difference in supporting the goals of your team and organization. Second, keep in mind that social media statistics don’t operate in a vacuum. That’s why you need to relate current data to previous data. Lastly, aside from keeping it simple, your report should always answer “so what?” What brings traffic to websites? A short report on strategies employed to attract more followers.
- 6. ZIMCORE SOCIAL MEDIA SERVICES The Role of Advertisement Giving the brand website a facelift for visual appeal, and easy navigation.. Still not sure how to present your data? Here are some types of social media reports: 1. Daily dashboard – This report takes note of spikes of activity for the social media team to respond to trends quickly. 2. Weekly KPI report – A weekly snapshot of your most important KPIs in comparison to the previous week, and the corresponding week from the previous year 3. Monthly roll-up report –This is a more objective report for management covering a longer period of time. 4. Quarterly strategy review – Here, the focus is less on the numbers and more on actions, prioritization, and goal- setting. PAGE 5
- 7. PAGE 06 ZIMCORE SOCIAL MEDIA SERVICES New Content for the Website "Our followers appreciate the images that go along with the content. According to them, images encourage more views." With the ubiquity of smartphones nowadays, we cannot deny the huge impact of social media in driving consumer behavior. That’s why brands both big and small tap digital platforms in a bid to capture market share. But being online simply isn't enough—brands need to have insights of their consumers’ online behavior, and use that data to drive revenue for their business. This is where social media reports come in. By tinkering with some data points here and there, social media marketers can tell middle managers and top- level executives how their brands are perceived by their customers. More than just the numbers, digital marketers must also create a concise yet effective social media report that is meaningful for all stakeholders involved. Top networks that can support our brand image.
- 8. ZIMCORE SOCIAL MEDIA SERVICES Making Use of Paid Campaigns Before even typing your report, first take the time to consider who the report is for. One good rule of thumb to remember is that the higher up the stakeholder is in the organizational ladder, the more succinct the report needs to be. With the myriad of metrics social media marketers have access to, it’s tempting to drown your audience in numbers. While figures aren't bad per se, you do have to make sure that these are relevant to the role of those receiving the report. Strive to tell the story behind the numbers by including learnings or insights. Getting users to participate in the campaign by offering incentives.. "Our followers appreciate the images that go along with the content. According to them, images encourage more views." PAGE 07
- 9. PAGE 08 ZIMCORE SOCIAL MEDIA SERVICES Doubling Subscriber Numbers for 2020 The next step is to decide what metrics matter to you. Below are some metrics you can start with: 1. Follower growth – the number of people you have reached 2. Influencer report – the influential people in your network 3. Volume of posts – the number of times you have shared content 4. Reach rate – the number of users who have seen your post 5. Total engagement – how much interaction each post generated 6. Engagement per follower – engagement each post generated Accessing the power of influencers on social media to attract more traffic to the website.
- 10. ZIMCORE SOCIAL MEDIA SERVICES Interacting with Users Now that you know your audience and metrics, you can start creating your report. Kick things off by presenting the big picture. Give a snapshot which summarizes how you are doing across all social media platforms. Here, you can do a health check and assess how well these platforms are doing for the reporting period. Remember that you don't have to jam all metrics in one page. Make it easy for your audience by selecting just the top three or four important metrics. Then give a few takeaways, which lets you transition smoothly to the other parts of your report. Start a forum on the website and post a link on the main page to encourage user participation. PAGE 09