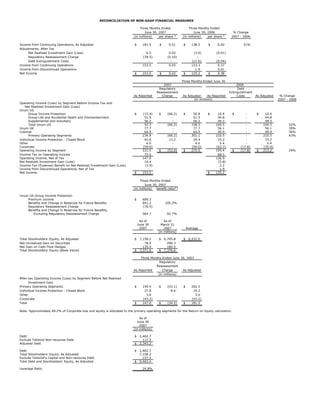
1. RECONCILIATION OF NON-GAAP FINANCIAL MEASURES
Three Months Ended Three Months Ended
June 30, 2007 June 30, 2006 % Change
(in millions) per share * (in millions) per share * 2007 - 2006
Income from Continuing Operations, As Adjusted $ 181.5 $ 0.51 $ 138.5 $ 0.42 31%
Adjustments, After Tax
Net Realized Investment Gain (Loss) 6.5 0.02 (3.6) (0.01)
Regulatory Reassessment Charge (34.5) (0.10) - -
Debt Extinguishment Costs - - (11.6) (0.04)
Income from Continuing Operations 153.5 0.43 123.3 0.37
Income from Discontinued Operations - - 1.9 0.01
Net Income $ 153.5 $ 0.43 $ 125.2 $ 0.38
Three Months Ended June 30
2007 2006
Regulatory Debt
Reassessment Extinguishment
As Reported Charge As Adjusted As Reported Costs As Adjusted % Change
(in millions) 2007 - 2006
Operating Income (Loss) by Segment Before Income Tax and
Net Realized Investment Gain (Loss)
Unum US
Group Income Protection $ (15.4) $ (66.2) $ 50.8 $ 10.4 $ - $ 10.4
Group Life and Accidental Death and Dismemberment 51.5 - 51.5 44.8 - 44.8
Supplemental and Voluntary 56.2 - 56.2 49.3 - 49.3
Total Unum US 92.3 (66.2) 158.5 104.5 - 104.5 52%
Unum UK 77.7 - 77.7 56.1 - 56.1 39%
Colonial 64.9 - 64.9 49.9 - 49.9 30%
Primary Operating Segments 234.9 (66.2) 301.1 210.5 - 210.5 43%
Individual Income Protection - Closed Block 42.6 13.2 29.4 33.2 - 33.2
Other 4.0 - 4.0 5.4 - 5.4
Corporate (59.0) - (59.0) (53.7) (17.8) (35.9)
Operating Income by Segment 222.5 $ (53.0) $ 275.5 195.4 $ (17.8) $ 213.2 29%
Income Tax on Operating Income 75.5 68.5
Operating Income, Net of Tax 147.0 126.9
Net Realized Investment Gain (Loss) 10.4 (5.8)
Income Tax (Expense) Benefit on Net Realized Investment Gain (Loss) (3.9) 2.2
Income from Discontinued Operations, Net of Tax - 1.9
Net Income $ 153.5 $ 125.2
Three Months Ended
June 30, 2007
(in millions) benefit ratio**
Unum US Group Income Protection
Premium Income $ 609.3
Benefits and Change in Reserves for Future Benefits 641.2 105.2%
Regulatory Reassessment Charge (76.5)
Benefits and Change in Reserves for Future Benefits,
Excluding Regulatory Reassessment Charge 564.7 92.7%
As of As of
June 30 March 31
2007 2007 Average
(in millions)
Total Stockholders' Equity, As Adjusted $ 7,158.2 $ 6,705.8 $ 6,932.0
Net Unrealized Gain on Securities 78.0 490.3
Net Gain on Cash Flow Hedges 135.4 180.5
Total Stockholders' Equity (Book Value) $ 7,371.6 $ 7,376.6
Three Months Ended June 30, 2007
Regulatory
Reassessment
As Reported Charge As Adjusted
(in millions)
After-tax Operating Income (Loss) by Segment Before Net Realized
Investment Gain
Primary Operating Segments $ 159.4 $ (43.1) $ 202.5
Individual Income Protection - Closed Block 27.8 8.6 19.2
Other 3.0 - 3.0
Corporate (43.2) - (43.2)
Total $ 147.0 $ (34.5) $ 181.5
Note: Approximately 69.2% of Corporate loss and equity is allocated to the primary operating segments for the Return on Equity calculation.
As of
June 30
2007
(in millions)
Debt $ 2,462.7
Exclude Tailwind Non-recourse Debt 117.5
Adjusted Debt $ 2,345.2
Debt $ 2,462.7
Total Stockholders' Equity, As Adjusted 7,158.2
Exclude Tailwind's Capital and Non-recourse Debt 157.5
Total Debt and Stockholders' Equity, As Adjusted $ 9,463.4
Leverage Ratio 24.8%
2. RECONCILIATION OF NON-GAAP FINANCIAL MEASURES - Continued
Outlook Range
Twelve Months Ended December 31, 2007
(in millions) per share *** (in millions) per share ***
After-tax Operating Income (Loss) by Segment Excluding Net
Realized Investment Gain and Regulatory Reassessment Charge
Primary Operating Segments $ 761.9 $ 772.5
Individual Income Protection - Closed Block 66.2 66.2
Other 9.5 9.5
Corporate (122.4) (122.4)
Total 715.2 $ 2.01 725.8 $ 2.04
Regulatory Reassessment Charge, Net of Tax (34.5) (0.10) (34.5) (0.10)
After-tax Operating Income Excluding Net Realized
Investment Gain 680.7 1.91 691.3 1.94
6.7 0.02 6.7 0.02
Net Realized Investment Gain
(3.4) (0.01) (3.4) (0.01)
Income Tax Expense on Net Realized Investment Gain
$ 684.0 $ 1.92 $ 694.6 $ 1.95
Net Income
Note: Outlook range for Return on Equity assumes $7.0 billion average equity, as adjusted. Approximately 69.0% of Corporate loss and
equity is allocated to the primary operating segments for the Return on Equity Outlook calculations.
* Assuming Dilution
Benefits and Change in Reserves for Future Benefits as a percent of Premium Income
**
*** Assuming Dilution - Forecasted Weighted Average Shares of 355.8 million