VIP Kolkata Call Girl Jodhpur Park 👉 8250192130 Available With Room
RyderPresReleasTablesQ32005
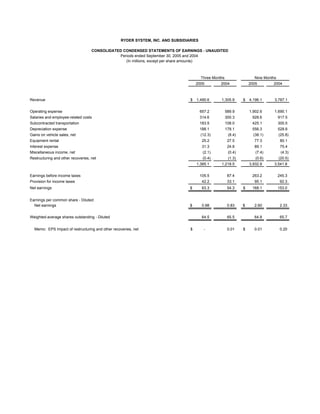
1. RYDER SYSTEM, INC. AND SUBSIDIARIES
CONSOLIDATED CONDENSED STATEMENTS OF EARNINGS - UNAUDITED
Periods ended September 30, 2005 and 2004
(In millions, except per share amounts)
Three Months Nine Months
2005 2004 2005 2004
Revenue $ 1,490.6 1,305.9 $ 4,196.1 3,787.1
Operating expense 657.2 589.9 1,902.6 1,690.1
Salaries and employee-related costs 314.6 300.3 928.6 917.5
Subcontracted transportation 183.5 108.0 425.1 300.5
Depreciation expense 188.1 178.1 556.3 528.8
Gains on vehicle sales, net (12.3) (8.4) (38.1) (25.8)
Equipment rental 25.2 27.5 77.3 80.1
Interest expense 31.3 24.8 89.1 75.4
Miscellaneous income, net (2.1) (0.4) (7.4) (4.3)
Restructuring and other recoveries, net (0.4) (1.3) (0.6) (20.5)
1,385.1 1,218.5 3,932.9 3,541.8
Earnings before income taxes 105.5 87.4 263.2 245.3
Provision for income taxes 42.2 33.1 95.1 92.3
Net earnings $ 63.3 54.3 $ 168.1 153.0
Earnings per common share - Diluted:
Net earnings $ 0.98 0.83 $ 2.60 2.33
Weighted-average shares outstanding - Diluted 64.5 65.5 64.8 65.7
Memo: EPS Impact of restructuring and other recoveries, net $ - 0.01 $ 0.01 0.20
2. RYDER SYSTEM, INC. AND SUBSIDIARIES
CONSOLIDATED CONDENSED BALANCE SHEETS
(Dollars in millions)
(unaudited)
September 30, December 31,
2005 2004
Assets:
Cash and cash equivalents $ 140.5 101.0
Other current assets 1,201.6 1,126.7
Revenue earning equipment, net 3,633.3 3,331.7
Operating property and equipment, net 485.5 479.6
Other assets 583.1 598.9
$ 6,044.0 5,637.9
Liabilities and shareholders' equity:
Current liabilities (including current portion of long-term debt) $ 1,278.3 1,454.8
Long-term debt 1,888.6 1,393.7
Other non-current liabilities (including deferred income taxes) 1,260.2 1,279.2
Shareholders' equity 1,616.9 1,510.2
$ 6,044.0 5,637.9
SELECTED KEY RATIOS
September 30, December 31,
2005 2004
Debt to equity 137% 118%
Total obligations to equity (a) * 146% 129%
Twelve months ended September 30,
2005 2004
Return on average shareholders' equity 15.1% 14.1%
Return on average assets 4.0% 3.6%
Average asset turnover 96.6% 92.9%
Return on capital* 7.8% 7.5%
(a) Total obligations represent debt plus off-balance sheet equipment obligations.
* Non-GAAP financial measure; see reconciliation to closest GAAP financial measure included within this
release.
3. RYDER SYSTEM, INC. AND SUBSIDIARIES
BUSINESS SEGMENT REVENUE AND EARNINGS - UNAUDITED
Periods ended September 30, 2005 and 2004
(Dollars in millions)
Three Months Nine Months
2005 2004 B(W) 2005 2004 B(W)
Revenue:
Fleet Management Solutions:
Full service lease $ 447.4 $ 444.0 0.8% $ 1,334.6 $ 1,319.1 1.2%
Contract maintenance 34.0 34.5 (1.5%) 101.9 102.6 (0.7%)
Contract-related maintenance 48.3 43.1 12.2% 146.2 131.5 11.2%
Commercial rental 183.4 176.7 3.8% 511.0 475.0 7.6%
Other 15.5 15.3 0.9% 47.6 53.1 (10.3%)
Fuel 282.2 205.1 37.6% 763.7 571.0 33.8%
Total Fleet Management Solutions 1,010.8 918.7 10.0% 2,905.0 2,652.3 9.5%
Supply Chain Solutions 433.4 338.5 28.0% 1,155.1 986.6 17.1%
Dedicated Contract Carriage 139.0 125.9 10.4% 400.8 377.7 6.1%
Eliminations (92.6) (77.2) (20.0%) (264.8) (229.5) (15.4%)
Total revenue $ 1,490.6 1,305.9 14.1% $ 4,196.1 3,787.1 10.8%
Business segment earnings:
Earnings before income taxes:
Fleet Management Solutions $ 102.6 85.8 19.6% $ 262.4 223.2 17.6%
Supply Chain Solutions 10.6 9.8 8.7% 25.4 25.7 (0.9%)
Dedicated Contract Carriage 9.2 7.5 22.4% 24.8 22.6 9.5%
Eliminations (8.2) (8.0) (3.8%) (23.3) (23.4) 0.5%
114.2 95.1 20.1% 289.3 248.1 16.6%
Unallocated Central Support Services (9.1) (9.0) (1.6%) (26.7) (23.3) (14.7%)
Earnings before restructuring and other recoveries, net
and income taxes 105.1 86.1 22.0% 262.6 224.8 16.8%
Restructuring and other recoveries, net 0.4 1.3 (65.7%) 0.6 20.5 (96.9%)
Earnings before income taxes 105.5 87.4 20.7% 263.2 245.3 7.3%
Provision for income taxes 42.2 33.1 (27.3%) 95.1 92.3 (3.0%)
Net earnings $ 63.3 54.3 16.7% $ 168.1 153.0 9.9%
Note: Certain prior period amounts have been reclassified to conform to current year presentation.
Amounts may not recalculate due to rounding.
4. RYDER SYSTEM, INC. AND SUBSIDIARIES
BUSINESS SEGMENT INFORMATION - UNAUDITED
Periods ended September 30, 2005 and 2004
(Dollars in millions)
Three Months Nine Months
2005 2004 B(W) 2005 2004 B(W)
Fleet Management Solutions
Total revenue $ 1,010.8 918.7 10.0% $ 2,905.0 2,652.3 9.5%
Fuel revenue (282.2) (205.1) 37.6% (763.7) (571.0) 33.8%
Operating revenue * $ 728.6 713.6 2.1% $ 2,141.3 2,081.3 2.9%
Segment net before tax earnings $ 102.6 85.8 19.6% $ 262.4 223.2 17.6%
Earnings before income taxes as % of total revenue 10.1% 9.3% 9.0% 8.4%
Earnings before income taxes as % of operating revenue * 14.1% 12.0% 12.3% 10.7%
Supply Chain Solutions
Total revenue $ 433.4 338.5 28.0% $ 1,155.1 986.6 17.1%
Subcontracted transportation (179.1) (104.9) 70.7% (413.5) (293.8) 40.7%
Operating revenue * $ 254.3 233.6 8.9% $ 741.6 692.8 7.0%
Segment net before tax earnings $ 10.6 9.8 8.7% $ 25.4 25.7 (0.9%)
Earnings before income taxes as % of total revenue 2.4% 2.9% 2.2% 2.6%
Earnings before income taxes as % of operating revenue * 4.2% 4.2% 3.4% 3.7%
Memo: Fuel costs $ 23.8 15.9 (49.7%) $ 66.5 46.5 (43.0%)
Dedicated Contract Carriage
Total revenue $ 139.0 125.9 10.4% $ 400.8 377.7 6.1%
Subcontracted transportation (4.4) (3.2) 39.8% (11.6) (6.7) 74.1%
Operating revenue * $ 134.6 122.7 9.7% $ 389.2 371.0 4.9%
Segment net before tax earnings $ 9.2 7.5 22.4% $ 24.8 22.6 9.5%
Earnings before income taxes as % of total revenue 6.6% 6.0% 6.2% 6.0%
Earnings before income taxes as % of operating revenue * 6.8% 6.1% 6.4% 6.1%
Memo: Fuel costs $ 24.9 18.2 (36.8%) $ 67.7 52.3 (29.4%)
* Non-GAAP financial measure
Note: Certain prior period amounts have been reclassified to conform to current year presentation.
Amounts may not recalculate due to rounding.
5. RYDER SYSTEM, INC. AND SUBSIDIARIES
NON-GAAP FINANCIAL MEASURE RECONCILIATIONS - UNAUDITED
Periods ended September 30, 2005 and 2004
(In millions, except per share amounts)
FREE CASH FLOW RECONCILIATION Nine Months
2005 2004
Net cash provided by operating activities $ 469.1 656.5
Net cash used in investing activities (817.5) (494.7)
Free cash flow * $ (348.4) 161.8
DEBT TO EQUITY RECONCILIATION September 30, December 31,
2005 % to Equity % to Equity
2004
On-balance sheet debt $ 2,218.3 137% $ 1,783.2 118%
PV of minimum lease payments and guaranteed residual
values under operating leases for vehicles (a) 145.4 161.1
Total obligations * $ 2,363.7 146% $ 1,944.3 129%
EPS RECONCILIATION Three Months Nine Months
2005 2004 2005 2004
Earnings per share $ 0.98 0.83 $ 2.60 2.33
Less: Tax change - - 0.12 -
Gain on sale of headquarters, after tax - 0.01 - 0.23
Earnings per share excluding tax change and headquarters
complex sale* $ 0.98 $ 0.82 $ 2.48 $ 2.09
RETURN ON CAPITAL RECONCILIATION
Twelve months ended September 30,
2005 2004
Net earnings — as reported [1] $ 230.8 192.4
Restructuring charges (recoveries), net 2.2 (17.0)
Income taxes 118.3 114.7
Earnings before net restructuring charges (recoveries) and
income taxes 351.3 290.1
Interest expense 113.8 101.1
Implied interest expense from off-balance sheet debt 7.0 9.2
Adjusted earnings before income taxes 472.1 400.4
Adjusted income taxes (182.7) (149.2)
Adjusted net earnings* [2] $ 289.4 $ 251.2
Average total debt $ 2,035.3 1,822.6
Average shareholders' equity 1,530.6 1,365.3
Total capital — as reported [3] 3,565.9 3,187.9
Average off-balance sheet debt 160.4 149.3
Adjusted total capital * [4] $ 3,726.3 $ 3,337.2
Return on capital — as reported [1] / [3] 6.5% 6.0%
Return on capital * [2] / [4] 7.8% 7.5%
(a) Discounted at the incremental borrowing rate at lease inception.
* Non-GAAP financial measure
Note: Earnings per share amounts are calculated independently for each component and may not be additive due to rounding.