I scan
•Download as PPSX, PDF•
1 like•219 views

With a current sensor you can easily, quickly and reliably diagnose almost any electronic device.

Recommended
Recommended
More Related Content
What's hot
Similar to I scan
Similar to I scan (20)
Recently uploaded
Recently uploaded (20)
I scan
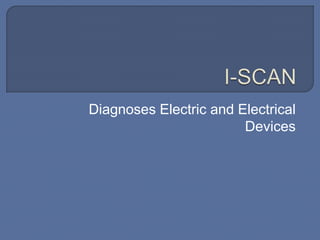
- 1. Diagnoses Electric and Electrical Devices
- 2. I-Scan uses the electrical current consumption of an electric device to diagnoses several different type of failures on both Electronic and Electrical Boards (EB) .
- 3. I-Scan makes the process of repairing much more feasible and efficient with a small adaptation of a general profile the user is able to implement it to any EB.
- 4. I-Scan also requires an interface which couples the given EB to be diagnoses. The needed information is then acquired using an acquisition card and processed by an external PC. A user interface allows the user to see the failure(s) on the EB being tested.
- 5. I-Scan’s Block Diagram Power Source Sensor Load Amplifier DAQ Control Control A1 A2 A3 A4 PC A5 A6 Profile
- 6. Programming algorithm flowchart of the signal processing steps as well as the user interface. I-Scan F(range setup) F(Section setup) Digital Filtering F(Compare) F(Display) F(Open Profile) A1 A2 A3 A4 A5 A6 A7 PC
- 7. RUN Power _ON Power Supply Analysis Power Supply OK? yesno Board defective Analysis of HCD’s and MCD’s Electric Energy Pattern I--SCAN Signal Acquisition Successful Analysis? Device(s) Defective no yes Waiting Time Analysis of LCD’s Electrical Energy Pattern Successful Analysis? I--SCAN Signal Acquisition no yes Device(s) Defective Good Board Signal Acquisition time established to analyze both HCD and MCD. Signal Acquisition time established to analyze LCD. Flowchart Software
- 8. In terms of electrical energy consumption there are three type of devices on a Given Electrical Board (EB) High Consumption Devices (HCD) HCD>15% of the total EB’s Energy Consumption Medium Consumption Devices (MCD) 5%<MCD<15% of the total EB’s Energy Consumption Low Consumption Devices (LCD) LCD<5% of the total EB’s Energy Consumption - A HCD, MCD, or LCD will be diagnosed as a Defective Device if its Energy consumption is 5% of its EEP - A HCD, MCD, or LCD will be diagnosed as a Good Device if its Energy consumption is 1% of its EEP - A given Device’s Electrical Energy Pattern (EEP) will be the range of consumption levels that the device will have to fall into; in order to be in a good working condition.