MATLAB GUI for Beam Analysis
•
2 likes•926 views

The document describes the development of a graphical user interface (GUI) in MATLAB software to analyze beams. The GUI allows users to input beam properties like span, support conditions, and load types/values. It then calculates and displays the reaction forces, shear forces, bending moments, and plots the shear force and bending moment diagrams. The GUI provides a quick and easy way to analyze beams without requiring knowledge of complex coding. The authors aim to expand the program to analyze multiple span beams with different load combinations.

Recommended
More Related Content
What's hot
What's hot (20)
Viewers also liked
Viewers also liked (12)
Similar to MATLAB GUI for Beam Analysis
Similar to MATLAB GUI for Beam Analysis (20)
More from eSAT Journals
More from eSAT Journals (20)
Recently uploaded
Recently uploaded (20)
MATLAB GUI for Beam Analysis
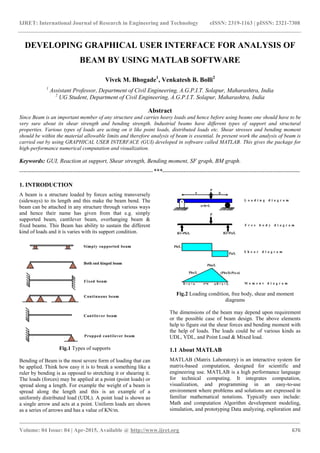
- 1. IJRET: International Journal of Research in Engineering and Technology eISSN: 2319-1163 | pISSN: 2321-7308 _______________________________________________________________________________________ Volume: 04 Issue: 04 | Apr-2015, Available @ http://www.ijret.org 676 DEVELOPING GRAPHICAL USER INTERFACE FOR ANALYSIS OF BEAM BY USING MATLAB SOFTWARE Vivek M. Bhogade1 , Venkatesh B. Bolli2 1 Assistant Professor, Department of Civil Engineering, A.G.P.I.T. Solapur, Maharashtra, India 2 UG Student, Department of Civil Engineering, A.G.P.I.T. Solapur, Maharashtra, India Abstract Since Beam is an important member of any structure and carries heavy loads and hence before using beams one should have to be very sure about its shear strength and bending strength. Industrial beams have different types of support and structural properties. Various types of loads are acting on it like point loads, distributed loads etc. Shear stresses and bending moment should be within the material allowable limits and therefore analysis of beam is essential. In present work the analysis of beam is carried out by using GRAPHICAL USER INTERFACE (GUI) developed in software called MATLAB. This gives the package for high-performance numerical computation and visualization. Keywords: GUI, Reaction at support, Shear strength, Bending moment, SF graph, BM graph. --------------------------------------------------------------------***---------------------------------------------------------------------- 1. INTRODUCTION A beam is a structure loaded by forces acting transversely (sideways) to its length and this make the beam bend. The beam can be attached in any structure through various ways and hence their name has given from that e.g. simply supported beam, cantilever beam, overhanging beam & fixed beams. This Beam has ability to sustain the different kind of loads and it is varies with its support condition. Fig.1 Types of supports Bending of Beam is the most severe form of loading that can be applied. Think how easy it is to break a something like a ruler by bending is as opposed to stretching it or shearing it. The loads (forces) may be applied at a point (point loads) or spread along a length. For example the weight of a beam is spread along the length and this is an example of a uniformly distributed load (UDL). A point load is shown as a single arrow and acts at a point. Uniform loads are shown as a series of arrows and has a value of KN/m. Fig.2 Loading condition, free body, shear and moment diagrams The dimensions of the beam may depend upon requirement or the possible case of beam design. The above elements help to figure out the shear forces and bending moment with the help of loads. The loads could be of various kinds as UDL, VDL, and Point Load & Mixed load. 1.1 About MATLAB MATLAB (Matrix Laboratory) is an interactive system for matrix-based computation, designed for scientific and engineering use. MATLAB is a high performance language for technical computing. It integrates computation, visualization, and programming in an easy-to-use environment where problems and solutions are expressed in familiar mathematical notations. Typically uses include: Math and computation Algorithm development modeling, simulation, and prototyping Data analyzing, exploration and
- 2. IJRET: International Journal of Research in Engineering and Technology eISSN: 2319-1163 | pISSN: 2321-7308 _______________________________________________________________________________________ Volume: 04 Issue: 04 | Apr-2015, Available @ http://www.ijret.org 677 visualization Scientific and engineering graphics Application development including graphical user interface building MATLAB is a software package for high- performance numerical computation and visualization. 1.2 What is GUI? A graphical user interface (GUI) is a graphical display in one or more windows containing controls, called components that enable a user to perform interactive tasks. The user of the GUI does not have to create a script or type commands at the command line to accomplish the tasks. Unlike coding programs to accomplish tasks, the user of a GUI need not understand the details of how the tasks are performed. GUI components can include menus, toolbars, push buttons, radio buttons, list boxes, and sliders—just to name a few. GUIs created using MATLAB® tools can also perform any type of computation, read and write data files, communicate with other GUIs, and display data as tables or as plots. The following figure illustrates a simple GUI that you can easily build yourself. Fig.3 Sample of GUI 1.3 GUI may Contains An axes component A pop-up menu listing three data sets that correspond to MATLAB functions: peaks, membrane, and sync A static text component to label the pop-up menu Three buttons that provide different kinds of plots: surface, mesh, and contour when you click a push button, the axes component displays the selected data set using the specified type of 3-D plot. 2. FLOWCHART OF PROGRAM Fig.4 Flowchart of Program 3. RESULT AND DISCUSSION The current Graphical User Interface (GUI) is developed to analyses the simple supported beam is subjected to only point load or only UDL or mix load (both point load & UDL). This software (GUI) gives the output values such as Reaction at starting support and end support. It also gives the Shear force and bending moment diagram of the beam and with SF & BM values at every 0.01m length of beam Fig.5 Main window No No Start Input: Span of Beam Select type of load Case 1: Point load Case 2: UDL Case 3: Point load & UDL Input: Distance from left support Input: Intensity Input: Distance from left support & Intensity Distance from left support should be smaller than span of Beam End Calculate: R1, R2, Max & Min SF, Max & Min BM Plot: SF & BM Diagram along its values Reset: To enter new values
- 3. IJRET: International Journal of Research in Engineering and Technology eISSN: 2319-1163 | pISSN: 2321-7308 _______________________________________________________________________________________ Volume: 04 Issue: 04 | Apr-2015, Available @ http://www.ijret.org 678 3.1 GUI Output Window The GUI in MATLAB program we designed takes the input values as shown in the below figures and the logic that we have; Case: 1- Analysis for simply supported Beam with only Point load. (Ref. fig.6) Input:- 1. Span of Beam in m. 2. Position of Point load at distance from left support in m. 3. Intensity of Point load in KN Fig.6 Output Window NOTE: - Value of Distance of Point load from left support should less than span of Beam. Output:- 1. Values of R1 (Reaction at left support), R2 (Reaction at end support). 2. Values of Max. & Min. SF. 3. Values of Max. & Min. BM. 4. SF diagram & BM diagram. 5. SF and BM values at every 0.01m span of Beam (in the form of table). Case: 2- Analysis for simply supported Beam with only UDL. (Refer. fig.7) Input:- 1. Span of Beam in m. 2. Intensity of UDL in KN/m. Fig.7 Output Window In this case select UDL option & enter only value of Intensity in KN/m. Output:- 1. Values of R1 (Reaction at left support), R2 (Reaction at end support). 2. Values of Max. & Min. SF. 3. Values of Max. & Min. BM. 4. SF diagram & BM diagram. 5. SF and BM values at every 0.01m span of Beam (in the form of table). Case: 3- Analysis for simply supported Beam with both Point load & UDL (Ref. fig.8) Input:- 1. Span of Beam in m. 2. Position of Point load at distance from left support in m. 3. Intensity of Point load in KN & UDL in KN/m. Fig.8 Output Window In this case we can analyze Beam when both Point load & UDL is applied on it. Output:- 1. Values of R1 (Reaction at left support), R2 (Reaction at end support). 2. Values of Max. & Min. SF. 3. Values of Max. & Min. BM. 4. SF diagram & BM diagram. 5. SF and BM values at every 0.01m span of Beam (in the form of table). To calculate SFD and BMD for new values of beam then press “RESET” button to reset all. If any problem occurs while using software press “HELP” to know How to use software in detail. From above analysis we get points of maximum & minimum bending moment as well as shear force. By finding it we can determine that the maximum stresses developed in section is sustained safely or not and we can make necessary arrangement for the maximum SF & BM at the time of providing reinforcement and/or we can change the cross-section dimensions.
- 4. IJRET: International Journal of Research in Engineering and Technology eISSN: 2319-1163 | pISSN: 2321-7308 _______________________________________________________________________________________ Volume: 04 Issue: 04 | Apr-2015, Available @ http://www.ijret.org 679 4. CONCLUSION Project Conclusion A quick and efficient way of analyzing the Simple supported Beam is developed through GUI in MATLAB code. The GUI can be used to calculate Reaction at both ends of Beam as well as Shear force and Bending moment diagram. As well as it gives values of SF and BM at every 0.01m of span of simple supported Beam. The GUI is faster and errorless, which can be helpful for all Civil engineer students and staffs. Similarly, it is very useful for beginners in Civil engineer field. We can use this software (GUI) without MATLAB. Future Aim Future aim is to develop a GUI in MATLAB code which can be used to analyzing Beams with Fixed and Simple support having „n‟ number of spans with various loads such as Point load, Distributed load, Couple load, and Patch load present on it at various distances. Output of such analysis consist Reactions, values of SF, BM and Deflection with their graph etc. If possible, to increase use of this GUI software, we are trying to develop an Android Application which can be used on Smartphone also. REFERENCES [1] Matlab Software releases R2009a [2] Rajput, R.K. Strength of Materials (2007), S Chand & Co Ltd, Page No. 310-312 [3] Gulab Pamnani, Beam Analysis in Matlab, ISSN (Print) : 2349-1094, ISSN (Online) : 2349-1108, Vol_1, Issue_2 of Advance Physics Letter, 2014 [4] Design of Steel Structures, N. Subramanian, Oxford, 2008 [5] Limit State Design of Steel Structures, S. K Duggal. BIOGRAPHIES Prof. Vivek Meghraj Bhogade, Assistant Professor, Department of Civil Engineering, A. G. Patil Institute of Technology, Solapur. Life member of Indian society of Technical Education Mr. Venkatesh Balraj Bolli, Student of 3rd year Civil Engineering, A. G. Patil Institute of Technology, Solapur