SlideShare a Scribd company logo
1 of 11
Download to read offline
“APPENDIX D”

Page 1 of 11

2013 KCPE EXAMINATION ESSENTIAL STATISTICS
1.0

TABLE 1: KCPE EXAMINATION CANDIDATURE TRENDS FOR THE LAST 10 YEARS
Total Candidature
Total No.
Increase/
Sat
Decrease
(%)

Year

Male Candidates
No. Sat
Increase/
(%)
Decrease
(%)

Female Candidates
No. Sat
Increase/
(%)
Decrease
(%)

2013

839,759

27,829
(3.43%)

426,369
(50.77%)

10,749
(2.59%)

413,396
(49.23%)

17,080
(4.31%)

2012

811,930

2011

776,214

2010

746,080

2009

727,054

2008

695,777

2007

704, 918

2006

666,451

2005

671,550

2004

657,747

35,716
(4.60%)
30,134
(4.04%)
19,026
(2.62%)
31,277
(4.50%)
-9,141
(-1.30%)
38,467
(5.77%)
-5,099
(-0.76%)
13,803
(2.10%)
69,786
(11.87%)

415,620
(51.19%)
400,814
(51.64%)
388,221
(52.03%)
381,600
(52.49%)
367,125
(52.76%)
372,265
(52.81%)
352,782
(52.93%)
352,826
(52.54%)
342,979
(52.14%)

14,806
(3.69%)
12,593
(3.24%)
6,621
(1.74%)
14,475
(3.94%)
-5,140
(-1.38%)
19,483
(5.52%)
-44
(-0.01%)
9,847
(2.87%)
39,072
(12.86%)

396,310
(48.81%)
375,400
(48.36%)
357,859
(47.97%)
345,454
(47.51%)
328,652
(47.24%)
332,653
(47.19%)
313,669
(47.07%)
318,724
(47.46%)
314,768
(47.86%)

20,910
(5.57%)
17,541
(4.90%)
12,405
(3.59%)
16,802
(5.11%)
-4,001
(-1.20%)
18,984
(6.05%)
-5,055
(-1.59%)
3,956
(1.26%)
30,714
(10.81%)

2.0

TABLE 2: 2013 & 2012 KCPE EXAMINATION CANDIDATURE BY COUNTY

County
Code &
Name
01
Taita Taveta
02
Kwale
03
Mombasa
04
Kilifi
05
Tana River
06
Lamu
07
Nyandarua
08
Nyeri

2013
Total
(%)

Male
(%)

2012
Female
(%)

AB
(%)

Total
(%)

Male
(%)

Female
(%)

AB
(%)

8,243
(0.98%)

4,227
(51.28%)

4,016
(48.72%)

37
(0.77%)

8,428
(1.04%)

4,140
(49.12%)

4,288
(50.88%)

72
(0.97%)

14,664
(1.75%)

7,837
(53.44%)

6,827
(46.56%)

39
(0.81%)

14,091
(1.74%)

7,628
(54.13%)

6,463
(45.86%)

49
(0.66%)

15,569
(1.85%)

7,820
(50.23%)

7,749
(9.77%)

126
(2.62%)

15,923
(1.96%)

8,042
(50.51%)

7,881
(49.49%)

148
(1.99%)

26,909
(3.20%)

14,148
(52.58%)

12,761
(47.42%)

165
(3.43%)

25,806
(3.18%)

13,928
(53.97%)

11,878
(46.02%)

203
(2.74%)

3,567
(0.42%)

2,027
(56.83%)

1,540
(43.17%)

11
(0.23%)

3,315
(0.41%)

1,980
59.73%)

1,335
(40.27%)

22
(0.30%)

2,361
(0.28%)

1,257
(53.24%)

1,104
(46.76%)

10
(0.21%)

2,237
(0.28%)

1,194
(53.38%)

1,043
(46.62%)

16
(0.22%)

18,194
(2.17%)

8,846
(48.62%)

9,348
(51.38%)

209
(4.35%)

17,467
(2.15%)

8,647
(49.10%)

8,820
(50.50%)

254
(3.42%)

19,047
(2.27%)

9,513
(49.94%)

9,534
(50.06%)

83
(1.73%)

19,013
(2.34%)

9,361
(49.23%)

9,653
(50.77%)

93
(1.25%)

Release of the year 2013 KCPE Examination Results by the Cabinet Secretary, Ministry of Education, Science & Technology, Prof. Jacob
Kaimenyi, PhD, FICD, EBS on Tuesday, 31st December 2013
Page 2 of 11

County
Code &
Name
09
Kirinyaga
10
Murang’a
11
Kiambu
12
Machakos
13
Kitui
14
Embu
15
Meru
16
Marsabit
17
Isiolo
18
Makueni
19
Tharaka Nithi
20
Nairobi
21
Turkana
22
Samburu
23
Trans Nzoia
24
West Pokot
25
Bomet
26
Uasin Gishu
27
Nakuru
28
Kericho
29
Nandi
30
Laikipia
31
Kajiado
32
Narok
33
Baringo
34
Elgeyo
Marakwet

2013
Total
(%)

Male
(%)

2012
Female
(%)

AB
(%)

Total
(%)

Male
(%)

Female
(%)

AB
(%)

11,897
(1.42%)

5,932
(49.86%)

5,965
(50.14%)

114
(2.37%)

12,002
(1.48%)

5,928
(49.39%)

6,074
(50.61%)

170
(2.29%)

25,113
(2.99%)

12,586
(50.12%)

12,527
(49.88%)

156
(3.24%)

25,421
(3.13%)

12,678
(49.87%)

12,743
(50.13%)

180
(2.43%)

37,721
(4.49%)

18,708
(49.60%)

19,013
(50.40%)

180
(3.74%)

37,129
(4.57%)

18,337
(49.39%)

18,729
(50.61%)

291
(3.92%)

30,311
(3.61%)

14,961
(49.36%)

15,350
(50.64%)

87
(1.81%)

29,000
(3.57%)

14,441
(49.80%)

14,559
(50.20%)

163
(2.20%)

31,893
(3.80%)

15,859
(49.73%)

16,034
(50.27%)

107
(2.22%)

29,815
(3.67%)

14,906
(50.00%)

14,909
(50.00%)

203
(2.74%)

13,022
(1.55%)

6,109
(46.91%)

6,913
(53.09%)

40
(0.83%)

12,828
(1.58%)

6,191
(48.26%)

6,637
(51.74%)

106
(1.43%)

26,976
(3.21%)

12,438
(46.11%)

14,538
(53.89%)

225
(4.68%)

24,881
(3.06%)

11,549
(46.42%)

13,332
(53.58%)

383
(5.16%)

3,535
(0.42%)

1,994
(56.41%)

1,541
(43.59%)

29
(0.60%)

3,650
(0.45%)

2,110
(57.81%)

1,540
(42.19%)

35
(0.47%)

2,649
(0.32%)

1,459
(55.08%)

1,190
(44.92%)

16
(0.33%)

2,443
(0.30%)

1,349
(55.22%)

1,094
(44.78%)

23
(0.31%)

27,618
(3.29%)

13,479
(48.81%)

14,139
(51.19%)

81
(1.68%)

26,748
(3.29%)

13,254
(49.55%)

13,494
(50.45%)

99
(1.33%)

8,668
(1.03%)

4,213
(48.60%)

4,455
(51.40%)

32
(0.67%)

8,130
(1.00%)

4,069
(50.05%)

4,061
(49.95%)

59
(0.79%)

46,131
(5.49%)

22,282
(48.30%)

23,849
(51.70%)

102
(2.12%)

45,402
(5.59%)

22,278
(49.07%)

23,124
(50.93%)

630
(8.49%)

6,304
(0.75%)

3,949
(62.64%)

2,355
(37.36%)

181
(3.76%)

6,068
(0.75%)

3,898
(64.24%)

2,170
(35.76%)

134
(1.81%)

3,144
(0.37%)

1,911
(60.78%)

1,233
(39.22%)

40
(0.83%)

3,114
(0.38%)

1,868
(59.99%)

1,246
(40.01%)

21
(0.28%)

18,897
(2.25%)

9,375
(49.61%)

9,522
(50.39%)

140
(2.91%)

17,926
(2.21%)

8,917
(49.74%)

9,009
(50.26%)

222
(2.99%)

9,068
(1.08%)

4,998
(55.12%)

4,070
(44.88%)

74
(1.54%)

8,430
(1.04%)

4,608
(54.66%)

3,822
(45.34%)

108
(1.46%)

20,208
(2.41%)

10,266
(50.80%)

9,942
(49.20%)

52
(1.08%)

20,453
(2.52%)

10,529
(51.48%)

9,924
(48.52%)

83
(1.12%)

20,360
(2.42%)

10,008
(49.16%)

10,352
(50.84%)

86
(1.79%)

19,275
(2.37%)

9,485
(49.21%)

9,790
(50.79%)

165
(2.22%)

42,650
(5.08%)

21,359
(50.08%)

21,291
(49.92%)

240
(4.99%)

40,944
(5.04%)

20,565
(50.23%)

20,379
(49.77%)

473
(6.37%)

20,829
(2.48%)

10,374
(49.81%)

10,455
(50.19%)

67
(1.39%)

20,261
(2.50%)

10,343
(51.05%)

9,918
(48.95%)

100
(1.35%)

18,113
(2.16%)

8,919
(49.24%)

9,194
(50.76%)

99
(2.06%)

17,071
(2.10%)

8,371
(49.04%)

8,700
(50.96%)

137
(1.85%)

10,349
(1.23%)

5,219
(50.43%)

5,130
(49.57%)

56
(1.16%)

10,211
(1.26%)

5,297
(51.88%)

4,914
(48.12%)

87
(1.17%)

13,283
(1.58%)

7,071
(53.23%)

6,212
(46.77%)

90
(1.87%)

12,293
(1.51%)

6,685
(54.39%)

5,608
(45.62%)

143
(1.93%)

15,001
(1.79%)

8,329
(55.52%)

6,672
(44.48%)

79
(1.64%)

13,938
(1.72%)

7,993
(57.35%)

5,945
(42.65%)

89
(1.20%)

13,954
(1.66%)

7,130
(51.10%)

6,824
(48.90%)

31
(0.64%)

13,693
(1.69%)

7,026
(51.31%)

6,667
(48.69%)

53
(0.71%)

11,313
(1.35%)

5,679
(50.20%)

5,634
(49.80%)

43
(0.89%)

11,225
(1.38%)

5,561
(49.54%)

5,664
(50.46%)

59
(0.79%)

Release of the year 2013 KCPE Examination Results by the Cabinet Secretary, Ministry of Education, Science & Technology, Prof. Jacob
Kaimenyi, PhD, FICD, EBS on Tuesday, 31st December 2013
Page 3 of 11

2013

County
Code &
Name

Total
(%)

35
Busia
36
Bungoma
37
Kakamega
38
Vihiga
39
Kisumu
40
Kisii
41
Homa Bay
42
Siaya
43
Nyamira
44
Migori
45
Garissa
46
Wajir
47
Mandera
48
Kauda
(Sudan)

Male
(%)

Female
(%)

Total
(%)

Male
(%)

AB
(%)

Female
(%)

16,187
(1.93%)

8,362
(51.66%)

7,825
(48.34%)

127
(2.64%)

14,972
(1.84%)

7,950
(53.10%)

7,022
(46.90%)

123
(1.66%)

35,014
(4.17%)

17,205
(49.14%)

17,809
(50.86%)

156
(3.24%)

33,449
(4.12%)

16,513
(49.37%)

16,936
(50.63%)

274
(3.69%)

37,428
(4.46%)

18,146
(48.48%)

19,282
(51.52%)

189
(3.93%)

36,267
(4.47%)

17,691
(48.78%)

18,575
(51.22%)

320
(4.31%)

14,148
(1.68%)

6,602
(46.66%)

7,546
(53.34%)

67
(1.39%)

13,569
(1.67%)

6,387
(47.07%)

7,182
(52.93%)

84
(1.13%)

21,045
(1.68%)

10,598
(50.36%)

10,447
(49.64%)

154
(3.20%)

20,668
(2.55%)

10,695
(51.75%)

9,973
(48.25%)

229
(3.09%)

26,471
(3.15%)

13,534
(51.13%)

12,937
(48.87%)

126
(2.62%)

24,677
(3.04%)

12,568
(50.93%)

12,109
(49.07%)

174
(2.34%)

22,486
(2.68%)

12,323
(54.80%)

10,163
(45.20%)

240
(4.99%)

22,378
(2.76)

12,569
(56.17)

9,809
(43.83)

291
(3.92%)

19,990
(2.38%)

10,272
(51.39%)

9,718
(48.61%)

154
(3.20%)

19,329
(2.38%)

9,910
(51.27%)

9,419
(48.73%)

198
(2.67%)

12,952
(1.54%)

6,633
(51.21%)

6,319
(48.79%)

73
(1.52%)

13,428
(1.65%)

6,748
(50.25%)

6,680
(49.75%)

60
(0.81%)

19,443
(2.32%)

10,791
(55.50%)

8,652
(44.50%)

170
(3.53%)

19,034
(2.34%)

10,831
(56.90%)

8,203
(43.10%)

224
(3.02%)

7,632
(0.91%)

5,231
(68.54%)

2,401
(31.46%)

178
(3.70%)

6,815
(0.84%)

4,748
(69.67%)

2,067
(30.33%)

03
(0.04%)

3,710
(0.44%)

2,478
(66.79%)

1,232
(33.21%)

13
(0.27%)

3,220
(0.40%)

2,158
(67.02%)

1,063
(32.98%)

11
(0.15%)

4,788
(0.57%)

3,351
(69.99%)

1,437
(30.01%)

36
(0.75%)

4,610
(0.57%)

3,121
(67.70%)

1,489
(32.30%)

46
(0.62%)

904
(0.11%)

561
(62.06%)

343
(37.94%)

-

883
(0.11%)

576
(65.23%)

307
(34.77%)

114
(1.54%)

839,759
(100.00%)

TOTAL

3.0

2012
AB
(%)

426,369
(50.77%)

811,930
(100.0%)

415,620
(51.19%)

396,310
(48.81%)

413,390
(49.23%)

4,810
(100%)

7,422
(100%)

TABLE 3: 2013 KCPE EXAMINATION AGE DISTRIBUTION BY COUNTY

County Code &
Name

Candidates’ Age Group
12 and
below

13

14

15 and16 17 and 18

19 and
above

Total

01

Taita Taveta

56
(0.01%)

774
(0.09%)

2,054
(0.24%)

3,636
(0.43%)

1,471
(0.17%)

289
(0.03%)

8,280
(0.98%)

02

Kwale

37
(0.01%)

361
(0.04%)

1,668
(0.20%)

5,919
(0.70%)

5182
(0.61%)

1,536
(0.18%)

14,703
(1.74%)

03

Mombasa

180
(0.02%)

1,773
(0.21%)

4,979
(0.59%)

6,215
(0.74%)

2,109
(0.25%)

439
(0.05%)

15,695
(1.86%)

04

Kilifi

62
(0.01%)

708
(0.08%)

3,061
(0.36%)

11,199
(1.33%)

9,397
(1.11%)

2,647
(0.31%)

27,074
(3.21%)

05

Tana River

68
(0.01%)

319
(0.04%)

867
(0.10%)

1,540
(0.18%)

646
(0.08%)

138
(0.02%)

3,578
(0.42%)

06

Lamu

18
(0.004%)

124
(0.01%)

403
(0.05%)

1,014
(0.12%)

659
(0.08%)

154
(0.02%)

2,372
(0.28%)

07

Nyandarua

296
(0.04%)

2473
(0.29%)

5,275
(0.62%)

8,368
(0.99%)

1,841
(0.22%)

150
(0.02%)

18,403
(2.18%)

Release of the year 2013 KCPE Examination Results by the Cabinet Secretary, Ministry of Education, Science & Technology, Prof. Jacob
Kaimenyi, PhD, FICD, EBS on Tuesday, 31st December 2013
Page 4 of 11

County Code &
Name

Candidates’ Age Group
12 and
below

13

14

15 and16 17 and 18

19 and
above

Total

08

Nyeri

175
(0.02%)

3,082
(0.36%)

6,422
(0.76%)

7,963
(0.94%)

1,355
(0.16%)

134
(0.12%)

19,130
(2.27%)

09

Kirinyaga

307
(0.04%)

2,324
(0.28%)

3,364
(0.40%)

4,279
(0.51%)

1,485
(0.18%)

252
(0.03%)

12,011
(1.42%)

10

Murang'a

505
(0.06%)

4,489
(0.53%)

7,661
(0.91%)

10,102
(1.20%)

2,260
(0.27%)

253
(0.03%)

25,270
(2.99%)

11

Kiambu

509
(0.06%)

8,423
(1.00%)

14,326
(1.70%)

12,298
(1.46%)

2,046
(0.24%)

298
(0.04%)

37,901
(4.49%)

12

Machakos

327
(0.04%)

2,943
(0.35%)

6,874
(0. 81%)

13,478
(1.60%)

6,080
(0.72%)

696
(0.08%)

30,398
(3.60%)

13

Kitui

405
(0.05%)

2,085
(0.25%)

6,153
(0.73%)

14,975
(1.77%)

7,434
(0.88%)

948
(0.11%)

32,000
(3.79%)

14

Embu

183
(0.02%)

1,803
(0.21%)

3,330
(0.39%)

4,875
(0.58%)

2,375
(0.28%)

497
(0.06%)

13,062
(1.55%)

15

Meru

356
(0.04%)

2,737
(0.32%)

6,781
(0.80%)

12,536
(1.48%)

4,187
(0.50%)

601
(0.07%)

27,201
(3.22%)

16

Marsabit

63
(0.01%)

316
(0.04%)

1,370
(0.16%)

1,450
(0.17%)

315
(0.04%)

50
(0.01%)

3,564
(0.42%)

17

Isiolo

51
(0.01%)

323
(0.04%)

739
(0.09%)

1,126
(0.13%)

356
(0.04%)

70
(0.01%)

2,665
(0.32%)

18

Makueni

485
(0.06%)

2,810
(0.33%)

6,123
(0.72%)

12,199
(1.44%)

5357
(0.63%)

725
(0.09%)

27,699
(3.28%)

19

Tharaka Nithi

151
(0.02%)

1,091
(0.13%)

2,304
(0.27%)

3,394
(0.40%)

1,472
(0.17%)

288
(0.03%)

8,700
(1.03%)

20

Nairobi

775
(0.09%)

9,031
(1.07%)

18,255
(2.16%)

14,408
(1.71%)

3,010
(0.36%)

754
(0.09%)

46,233
(5.47%)

21

Turkana

49
(0.01%)

232
(0.03%)

878
(0.10%)

2,592
(0.31%)

1,833
(0.22%)

901
(0.11%)

6,485
(0.77%)

22

Samburu

40
(0.004%)

262
(0.03%)

846
(0.10%)

1,466
(0.17%)

484
(0.06%)

86
(0.01%)

3,184
(0.38%)

23

Trans Nzoia

388
(0.05%)

2,188
(0.26%)

4,313
(0.51%)

8,026
(0.95%)

3,523
(0.42%)

599
(0.07%)

19,037
(2.25%)

24

West Pokot

144
(0.02%)

813
(0.10%)

2,217
(0.26%)

4,154
(0.49%)

1,468
(0.17%)

346
(0.04%)

9,142
(1.08%)

25

Bomet

1,564
(0.19%)

5,192
(0.61%)

6,388
(0.76%)

5,756
(0.68%)

1,190
(0.14%)

170
(0.02%)

20,260
(2.40%)

26

Uasin Gishu

406
(0.05%)

2,811
(0.33%)

5,652
(0.67%)

8,459
(1.00%)

2,722
(0.32%)

396
(0.05%)

20,446
(2.42%)

27

Nakuru

675
(0.08%)

6,284
(0.74%)

13,142
(1.56%)

17,601
(2.08%)

4,575
(0.54%)

612
(0.07%)

42,890
(5.08%)

28

Kericho

1,262
(0.15%)

4,527
(0.54%)

6,085
(0.72%)

6,871
(0.81%)

1792
(0.21%)

358
(0.04%)

20,896
(2.47%)

29

Nandi

265
(0.03%)

1,797
(0.21%)

3,717
(0.44%)

7,731
(0.92%)

3,792
(0.45%)

910
(0.11%)

18,212
(2.16%)

30

Laikipia

103
(0.01%)

1,177
(0.14%)

2,730
(0.32%)

4,770
(0.56%)

1,403
(0.17%)

222
(0.03%)

10,405
(1.23%)

Release of the year 2013 KCPE Examination Results by the Cabinet Secretary, Ministry of Education, Science & Technology, Prof. Jacob
Kaimenyi, PhD, FICD, EBS on Tuesday, 31st December 2013
Page 5 of 11

County Code &
Name

Candidates’ Age Group
12 and
below

13

14

15 and16 17 and 18

19 and
above

Total

31

Kajiado

309
(0.04%)

1,982
(0.23%)

3,498
(0.41%)

5,240
(0.62%)

1,852
(0.22%)

491
(0.06%)

13,373
(1.58%)

32

Narok

622
(0.07%)

2,715
(0.32%)

4,396
(0.52%)

5,497
(0.65%)

1,538
(0.18%)

310
(0.04%)

15,080
(1.79%)

33

Baringo

669
(0.08%)

3,285
(0.39%)

5,043
(0.60%)

3,997
(0.47%)

883
(0.10%)

108
(0.01%)

13,985
(1.66%)

34

Elgeyo
Marakwet

188
(0.02%)

1,451
(0.17%)

4,035
(0.48%)

4,462
(0.53%)

1,053
(0.12%)

167
(0.02%)

11,356
(1.34%)

35

Busia

261
(0.03%)

1,104
(0.13%)

2,496
(0. 30%)

6,611
(0.78%)

4,511
(0.53%)

1,335
(0.16%)

16,314
(1.93%)

36

Bungoma

1,285
(0.15%)

4,772
(0.57%)

7,740
(0.92%)

13,900
(1.65%)

6,324
(0.75%)

1,149
(0.14%)

35,170
(4.16%)

37

Kakamega

610
(0.07%)

3,227
(0.38%)

7,196
(0.85%)

15,871
(1.88%)

8,924
(1.06%)

1,790
(0.21%)

37,617
(4.45%)

38

Vihiga

96
(0.01%)

1,057
(0.13%)

2,853
(0.34%)

6,269
(0.74%)

3,249
(0.38%)

691
(0.08%)

14,215
(1.68%)

39

Kisumu

344
(0.04%)

1,864
(0.22%)

5,079
(0.60%)

9,625
(1.14%)

3,624
(0.43%)

662
(0.08%)

21,199
(2.51%)

40

Kisii

1791
(0.21%)

6,600
(0.78%)

7,645
(0.91%)

7,953
(0.94%)

2,204
(0.26%)

404
(0.05%)

26,597
(3.15%)

41

Homa Bay

777
(0.09%)

2,987
(0.35%)

5,602
(0.66%)

9,376
(1.11%)

3,360
(0.40%)

623
(0.07%)

22,726
(2.69%)

42

Siaya

201
(0.02%)

1,234
(0.15%)

3,657
(0.43%)

9,415
(1.11%)

4,648
(0.55%)

990
(0.12%)

20,144
(2.39%)

43

Nyamira

976
(0.12%)

3,111
(0.37%)

3,978
(0.47%)

3,929
(0.47%)

890
(0.11%)

141
(0.02%)

13,025
(1.54%)

44

Migori

662
(0.08%)

2,769
(0.33%)

5,106
(0.60%)

7,595
(0.90%)

2,871
(0.34%)

609
(0.07%)

19,613
(2.32%)

45

Garissa

66
(0.01%)

296
(0.04%)

1,244
(0.15%)

2,572
(0.30%)

1,828
(0.22%)

1,804
(0.21%)

7,810
(0.92%)

46

Wajir

96
(0.01%)

342
(0.04%)

1,144
(0.14%)

1,632
(0.19%)

391
(0.05%)

118
(0.01%)

3,723
(0.44%)

47

Mandera

76
(0.01%)

314
(0.04%)

1,153
(0.14%)

2,075
(0.25%)

938
(0.11%)

269
(0.03%)

4,824
(0.57%)

48

Kauda
(Sudan)

-

-

10
(0.003%)

62
(0.01%)

213
(0.03%)

619
(0.07%)

904
(0.11%)

Total

18,934
(2.24%)

112,382
219,852
334,481
131,120 27,799 844,569
(13.31%) (26.03%) (39.60%) (15.53%) (3.29%) (100.00%)

Release of the year 2013 KCPE Examination Results by the Cabinet Secretary, Ministry of Education, Science & Technology, Prof. Jacob
Kaimenyi, PhD, FICD, EBS on Tuesday, 31st December 2013
Page 6 of 11

4.0

TABLE 4: 2013 AND 2012 KCPE EXAMINATION CENTRES BY COUNTY

County Code and Name
1.
2.
3.
4.
5.
6.
7.
8.
9.
10.
11.
12.
13.
14.
15.
16.
17.
18.
19.
20.
21.
22.
23.
24.
25.
26.

01
Taita Taveta
02
Kwale
03
Mombasa
04
Kilifi
05
Tana River
06
Lamu
07
Nyandarua
08
Nyeri
09
Kirinyaga
10
Murang’a
11
Kiambu
12
Machakos
13
Kitui
14
Embu
15
Meru
16
Marsabit
17
Isiolo
18
Makueni
19
Tharaka Nithi
20
Nairobi
21
Turkana
22
Samburu
23
Trans Nzoia
24
West Pokot
25
Bomet
26
Uasin Gishu

All

Number of Examination Centres
2013
2012
Public
Private
All
Public

200
(0.86%)

183
(0.78%)

17
(0.07%)

327
(1.40%)

289
(1.24%)

38
(0.16%)

331
(1.42%)

91
(0.39%)

240
(1.03%)

463
(1.98%)

358
(1.53%)

105
(0.45%)

110
(0.47%)

104
(0.45%)

6
(0.03%)

71
(0.30%)

67
(0.29%)

4
(0.02%)

454
(1.94%)

321
(1.37%)

133
(0.57%)

519
(2.22%)

380
(1.63%)

139
(0.59%)

317
(1.36%)

191
(0.82%)

126
(0.54%)

595
(2.55%)

463
(1.98%)

132
(0.57%)

847
(3.63%)

470
(2.01%)

377
(1.61%)

916
(3.92%)

802
(3.43%)

114
(0.49%)

1,036
(4.43%)

959
(4.10%)

77
(0.33%)

451
(1.93%)

356
(1.52%)

95
(0.41%)

855
(3.66%)

671
(2.87%)

184
(0.79%)

108
(0.46%)

92
(0.39%)

16
(0.07%)

86
(0.37%)

67
(0.29%)

19
(0.08%)

889
(3.81%)

846
(3.62%)

43
(0.18%)

417
(1.78%)

375
(1.61%)

42
(0.18%)

842
(3.60%)

212
(0.91%)

630
(2.70%)

179
(0.77%)

164
(0.70%)

15
(0.06%)

101
(0.43%)

91
(0.39%)

10
(0.04%)

438
(1.87%)

301
(1.29%)

137
(0.59%)

300
(1.28%)

278
(1.19%)

22
(0.09%)

610
(2.61%)

414
(1.77%)

196
(0.84%)

585
(2.50%)

398
(1.70%)

187
(0.80%)

199
(0.87%)
320
(1.40%)
316
(1.39%)
447
(1.96%)
120
(0.53%)
71
(0.31%)
447
(1.96%)
518
(2.27%)
303
(1.33%)
589
(2.58%)
834
(3.66%)
890
(3.91%)
1,027
(4.51%)
445
(1.95%)
832
(3.65%)
98
(0.43%)
78
(0.34%)
885
(3.88%)
406
(1.78%)
801
(3.51%)
170
(0.75%)
96
(0.42%)
426
(1.89%)
291
(1.28%)
587
(2.58%)
566
(2.48%)

182
(0.80%)
292
(1.28%)
91
(0.40%)
353
(1.55%)
113
(0.50%)
66
(0.29%)
318
(1.40%)
380
(1.67%)
184
(0.81%)
462
(2.03%)
468
(2.05%)
798
(3.50%)
942
(4.13%)
342
(1.50%)
670
(2.94%)
88
(0.39%)
59
(0.26%)
847
(3.72%)
365
(1.60%)
512
(2.25%)
157
(0.69%)
88
(0.39%)
300
(1.32%)
272
(1.19%)
396
(1.74%)
386
(1.69%)

Private
17
(0.07%)
28
(0.12%)
225
(0.99%)
94
(0.41%)
7
(0.03%)
5
(0.02%)
129
(0.57%)
138
(0.61%)
119
0.52%)
127
(0.56%))
366
(1.61%)
92
(0.40%)
85
(0.37%)
103
(0.45%)
162
(0.71%)
10
(0.04%)
19
(0.08%)
38
(0.17%)
41
(0.18%)
289
(1.27%)
13
(0.06%)
8
(0.04%)
126
(0.55%)
19
(0.08%)
191
(0.84%)
180
(0.79%)

Release of the year 2013 KCPE Examination Results by the Cabinet Secretary, Ministry of Education, Science & Technology, Prof. Jacob
Kaimenyi, PhD, FICD, EBS on Tuesday, 31st December 2013
Page 7 of 11

County Code and Name
27.
28.
29.
30.
31.
32.
33.
34.
35.
36.
37.
38.
39.
40.
41.
42.
43.
44.
45.
46.
47.
48.

27
Nakuru
28
Kericho
29
Nandi
30
Laikipia
31
Kajiado
32
Narok
33
Baringo
34
Elgeyo Marakwet
35
Busia
36
Bungoma
37
Kakamega
38
Vihiga
39
Kisumu
40
Kisii
41
Homa Bay
42
Siaya
43
Nyamira
44
Migori
45
Garissa
46
Wajir
47
Mandera
48
Kauda (Sudan)

Totals

All

Number of Examination Centres
2013
2012
Public
Private
All
Public

855
(3.66%)

602
(2.58%)

253
(1.08%)

560
(2.40%)

419
(1.79%)

141
(0.60%)

670
(2.87%)

585
(2.50%)

85
(0.36%)

308
(1.32%)

234
(1.00%)

74
(0.32%)

428
(1.83%)

270
(1.16)

158
(0.68%)

528
(2.26%)

456
(1.95%)

72
(0.31%)

536
(2.29%)

501
(2.14%)

35
(0.15%)

364
(1.56%)

335
(1.43%)

29
(0.12%)

388
(1.66%)

351
(1.50%)

37
(0.16%)

770
(3.30%)

616
(2.64%)

154
(0.66%)

866
(3.71%)

755
(0.23%)

111
(0.48%)

377
(1.61%)

352
(1.51%)

25
(0.11%)

679
(2.91%)

593
(2.54%)

86
(0.37%)

914
(3.91%)

671
(2.87%)

243
(1.04%)

918
(3.93%)

814
(3.48%)

104
(0.45%)

644
(2.76%)

622
(2.66%)

22
(0.09%)

504
(2.16%)

399
(1.71%)

105
(0.45%)

682
(2.92%)

555
(2.38%)

127
(0.54%)

115
(0.49%)

66
(0.28%)

49
(0.21%)

108
(0.46%)

89
(0.38%)

19
(0.08%)

99
(0.42%)

82
(0.35%)

17
(0.07%)

2
(0.09%)

00
(00.00%)

2
(0.01%)

23,362
(100.00%)

18,310
(78.38%)

5,052
(21.62%)

814
(3.72%)
538
(2.36%)
664
(2.91%)
306
(1.34%)
411
(1.80%)
503
(2.21%)
526
(2.31%)
357
(1.57%)
383
(1.68%)
727
(3.19%)
838
(3.68%)
374
(1.64%)
671
(2.94%)
908
(3.98%)
910
(4.10%)
636
(2.79%)
508
(2.23%)
672
(2.95%)
105
(0.46%)
88
(0.39%)
83
(0.36%)
2
(0.009%)
22,786
(100.0%)

594
(2.61%)
416
(1.83%)
571
(2.51%)
223
(0.98%)
250
(1.10%)
407
(1.79%)
502
(2.20%)
332
(1.46%)
349
(1.53%)
587
(2.58%)
740
(3.25%)
350
(1.54%)
592
(2.60%)
669
(2.94%)
784
(3.44%)
620
(2.72%)
394
(1.73%)
554
(2.45%)
59
(0.26%)
66
(0.29%)
69
(0.30%)
00
(0.00%)
18,195
(79.85%)

Private
220
(0.97%)
122
(0.54%)
93
(0.40%)
73
(0.32%)
161
(0.71%)
96
(0.42%)
24
(0.11%)
25
(0.11%)
34
(0.15%)
140
(0.61%)
98
(0.43%)
24
(0.11%)
79
(0.35%)
239
(1.05%)
90
(0.39%)
16
(0.07%)
114
(0.50%)
118
(0.52%)
46
(0.20%)
22
(0.10%)
14
(0.06%)
2
(0.01%)
4,473
(19.63%)

Release of the year 2013 KCPE Examination Results by the Cabinet Secretary, Ministry of Education, Science & Technology, Prof. Jacob
Kaimenyi, PhD, FICD, EBS on Tuesday, 31st December 2013
Page 8 of 11

5.0

TABLE 5:

KCPE EXAMINATION CANDIDATES’ PERFORMANCE
STATISTICS BY RANGE OF MARKS (2012 AND 2013)
YEAR AND CANDIDATES OBTAINING THE
RANGE OF MARKS

CATEGORY

2013
422,276
(50.29%)
417,483
(49.71%)
839,759
(100%)
4,810
(0.57%)
844,569
(100%)

Below Mean (001 – 250)
Above Mean (251 – 500)
Total Number who sat for Examination
Candidates Absent
Total Candidates Registered

6.0 TABLE 6:

2012
395,030
(48.65%)
416,900
(51.35%)
811,930
(100%)
7,422
(0.91%)
819,353
(100%)

KCPE EXAMINATION CANDIDATES WHO SAT FOR THE
EXAMINATION UNDER SPECIAL CIRCUMSTANCES BY
COUNTY (2012 AND 2013)

No. of
Cands. Who
took exam
in prison

No. of
Cands. Who
took exam
in hospital

2013

2012

2013

2012

2013

2012

2013

2012

2013

2012

2013

2012

2013

2012

17

19

00

00

00

00

01

08

03

03

01

03

22

33

2.

Taita
Taveta
Kwale

00

00

00

00

00

00

16

17

04

05

28

07

48

29

3.

Mombasa

40

29

00

00

07

9

16

18

27

19

09

17

99

92

4.

Kilifi

00

01

01

00

00

02

12

08

10

03

29

28

52

42

5.

Tana River

00

00

00

03

00

00

02

03

00

01

03

03

05

10

6.

Lamu

00

00

01

00

00

00

03

09

00

00

00

00

04

09

7.

Nyandarua

00

01

00

00

00

00

04

06

14

19

11

15

29

41

8.

Nyeri

17

15

00

01

00

00

07

10

10

04

06

15

42

45

9.

Kirinyaga

00

00

00

01

00

00

01

05

03

01

11

10

15

17

10. Murang’a

00

00

02

01

00

00

01

04

08

3

19

17

30

25

11. Kiambu

00

00

00

03

21

19

13

24

31

29

23

05

88

80

12. Machakos

00

00

02

00

03

01

07

14

30

29

19

21

61

65

13. Kitui

00

00

00

01

03

06

05

12

16

06

21

13

45

38

14. Embu

00

00

00

01

00

00

01

5

14

10

09

01

24

17

15. Meru

00

00

03

02

03

02

13

17

14

05

20

24

53

50

16. Marsabit

00

00

00

00

00

00

01

01

01

00

00

00

02

01

17. Isiolo

00

00

00

00

00

03

00

03

00

01

09

07

09

14

18. Makueni

00

00

02

00

00

00

13

11

17

10

10

06

42

27

19. Tharaka
Nithi
20. Nairobi

00

00

00

00

00

00

03

02

03

02

00

00

06

04

29

40

01

00

04

02

22

17

32

23

11

12

99

94

21. Turkana

00

02

01

02

02

01

14

08

04

01

11

10

32

24

County Code
and Name

1.

Blind

Low vision

Physically/
Mentally
challenged

Hearing
impaired

Total

Release of the year 2013 KCPE Examination Results by the Cabinet Secretary, Ministry of Education, Science & Technology, Prof. Jacob
Kaimenyi, PhD, FICD, EBS on Tuesday, 31st December 2013
Page 9 of 11

County Code
and Name

No. of
Cands. Who
took exam
in prison

No. of
Cands. Who
took exam
in hospital

Blind

Low vision

Physically/
Mentally
challenged

Hearing
impaired

Total

2013

2012

2013

2012

2013

2012

2013

2012

2013

2012

2013

2012

2013

2012

22. Samburu

00

00

00

00

01

01

22

27

02

00

06

11

31

39

23. Trans
Nzoia
24. West
Pokot
25. Bomet

00

00

02

00

01

01

34

64

17

11

00

03

54

79

00

00

00

01

05

07

05

13

03

00

00

00

13

21

01

02

00

01

03

03

05

09

20

09

00

00

28

24

26. Uasin
Gishu
27. Nakuru

00

00

00

02

00

00

10

11

10

09

08

02

28

24

00

67

01

00

02

00

06

16

17

04

18

12

123

99

28. Kericho

00

01

01

00

01

02

06

14

14

08

32

31

54

56

29. Nandi

01

00

03

03

00

00

07

07

06

11

11

14

27

34

30. Laikipia

00

00

00

00

00

00

04

05

04

05

00

08

08

18

31. Kajiado

00

00

01

00

00

00

13

08

55

02

07

04

76

14

32. Narok

00

00

00

00

00

00

09

02

04

00

00

00

13

02

33. Baringo

00

00

01

00

01

00

08

12

09

14

11

08

30

34

34. Elgeyo
Marakwet
35. Busia

00

00

03

02

02

00

12

05

14

01

09

07

40

15

00

00

01

01

00

00

10

07

09

06

09

04

29

18

36. Bungoma

00

00

01

02

00

00

38

34

90

26

20

05

149

67

37. Kakamega

00

01

02

03

03

00

32

78

40

21

48

54

125

157

38. Vihiga

00

00

02

02

00

00

07

06

02

03

24

24

35

35

39. Kisumu

00

111

03

02

04

06

38

28

28

19

20

30

219

196

40. Kisii

13

00

03

02

01

01

05

04

08

03

21

18

38

28

41. Homa Bay

00

00

01

01

00

00

28

38

26

21

28

21

83

81

42. Siaya

00

01

03

03

08

11

37

53

10

12

24

17

82

97

43. Nyamira

00

00

00

02

00

00

07

10

22

03

00

01

29

16

44. Migori

00

02

02

01

00

01

05

28

13

10

44

45

64

87

45. Garissa

02

02

00

01

02

04

50

55

19

16

08

11

79

89

46. Wajir

00

00

02

02

00

00

01

04

04

03

11

11

18

20

47. Mandera

00

08

00

00

00

00

03

19

02

03

00

00

05

30

307

302

45

46

77

82

557

759

690

394

609

556

2,287

2,137

Totals

7.0

TABLE 7:

County Code and Name

1.
2.
3.
4.

01
Taita Taveta
02
Kwale
03
Mombasa
04

2013 KCPE EXAMINATION FREQUENCY OF CANDIDATES &
EXAMINATION
CENTRES
INVOLVED
IN
EXAMINATION
IRREGULARITIES BY COUNTY AND DISTRICT

Districts
involved in
Examination
Irregularities

2013
Candidates
involved in
Examination
Irregularities

Centres
involved in
Examination
Irregularities

Districts
involved in
Examination
Irregularities

2012
Candidates
involved in
Examination
Irregularities

Centres
involved in
Examination
Irregularities

-

-

-

-

-

-

01

09

01

01

22

01

01

24

01

01

109

4

-

-

-

01

01

01

Release of the year 2013 KCPE Examination Results by the Cabinet Secretary, Ministry of Education, Science & Technology, Prof. Jacob
Kaimenyi, PhD, FICD, EBS on Tuesday, 31st December 2013
Page 10 of 11

County Code and Name

5.
6.
7.
8.
9.
10.
11.
12.
13.
14.
15.
16.
17.
18.
19.
20.
21.
22.
23.
24.
25.
26.
27.
28.
29.
30.
31.
32.
33.
34.

Kilifi
05
Tana River
06
Lamu
07
Nyandarua
08
Nyeri
09
Kirinyaga
10
Murang’a
11
Kiambu
12
Machakos
13
Kitui
14
Embu
15
Meru
16
Marsabit
17
Isiolo
18
Makueni
19
Tharaka Nithi
20
Nairobi
21
Turkana
22
Samburu
23
Trans Nzoia
24
West Pokot
25
Bomet
26
Uasin Gishu
27
Nakuru
28
Kericho
29
Nandi
30
Laikipia
31
Kajiado
32
Narok
33
Baringo
34
Elgeyo Marakwet

Districts
involved in
Examination
Irregularities

2013
Candidates
involved in
Examination
Irregularities

Centres
involved in
Examination
Irregularities

Districts
involved in
Examination
Irregularities

2012
Candidates
involved in
Examination
Irregularities

Centres
involved in
Examination
Irregularities

-

-

-

-

-

-

-

-

-

-

-

-

-

-

-

-

-

-

01

25

01

-

-

-

01

07

01

01

01

01

-

-

-

-

-

-

-

-

-

01

18

01

02

105

05

-

-

-

03

88

05

01

06

01

01

11

01

-

-

-

04

182

08

03

51

03

-

-

-

-

-

-

-

-

-

-

-

-

03

127

03

-

-

-

-

-

-

-

-

-

03

235

11

03

76

04

01

21

01

01

-

-

-

-

-

01

19

01

-

-

-

01

13

01

02

68

05

03

49

04

-

-

-

01

05

03

01

21

01

01

02

01

01

12

01

-

-

-

01

60

01

01

28

03

-

-

-

-

-

-

01

07

01

-

-

-

01

25

02

03

45

03

-

-

-

01

06

01

01

16

02

-

-

-

01

22

01

01

14

01

Release of the year 2013 KCPE Examination Results by the Cabinet Secretary, Ministry of Education, Science & Technology, Prof. Jacob
Kaimenyi, PhD, FICD, EBS on Tuesday, 31st December 2013
Page 11 of 11

35.

35
Busia
36
Bungoma
37
Kakamega
38
Vihiga
39
Kisumu
40
Kisii
41
Homa Bay
42
Siaya
43
Nyamira
44
Migori
45
Garissa
46
Wajir
47
Mandera
48
Kauda
(Sudan)

36.
37.
38.
39.
40.
41.
42.
43.
44.
45.
46.
47.
48.

Totals
8.0

TABLE 8:

Year

2013
Candidates
involved in
Examination
Irregularities

Centres
involved in
Examination
Irregularities

Districts
involved in
Examination
Irregularities

2012
Candidates
involved in
Examination
Irregularities

Centres
involved in
Examination
Irregularities

01

33

01

-

-

-

02

82

05

-

-

-

-

-

-

01

15

01

-

-

-

01

18

01

02

24

02

01

17

01

03

67

05

03

41

03

05

173

10

01

02

02

-

-

-

01

01

01

01

20

01

01

01

01

04

56

04

02

19

02

02

12

02

03

30

03

01

11

02

01

25

01

02

33

02

03

76

03

-

-

-

-

-

-

50

County Code and Name

Districts
involved in
Examination
Irregularities

1,576

86

45

732

54

EXAMINATION IRREGULARITY TRENDS FOR THE LAST FIVE
(5) YEARS BY EXAMINATION CENTRE AND CANDIDATURE

Total No. of
Exam. Centres in
the Country

Centres in which
candidates were
involved in
examination
irregularities

Total No. of
Candidates

Number and % of
Candidates Involved in
examination irregularities

1.

2013

23,362

86
(0.37%)

839,759

1,576
(0.19%)

2.

2012

22,786

811,930

3.

2011

22,154

4.

2010

21,506

5.

2009

20,873

54
(0.24%)
334
(1.51%)
68
(0.29%)
80
(0.38%)

732
(0.09%)
7,974
(1.03%)
1,103
(0.15%)
1,904
(0.26%)

776,214
746,080
727,054

Release of the year 2013 KCPE Examination Results by the Cabinet Secretary, Ministry of Education, Science & Technology, Prof. Jacob
Kaimenyi, PhD, FICD, EBS on Tuesday, 31st December 2013

More Related Content

Similar to 2013 KCPE Examination Essential Statistics - Kenya

Foundation admissions 2017_eng(2)
Foundation admissions 2017_eng(2)Foundation admissions 2017_eng(2)
Foundation admissions 2017_eng(2)Indira Tolendiyeva
 
Foundation admissions 2017_eng
Foundation admissions 2017_engFoundation admissions 2017_eng
Foundation admissions 2017_engIndira Tolendiyeva
 
MassBay Fast Facts PowerPoint v2
MassBay Fast Facts PowerPoint v2MassBay Fast Facts PowerPoint v2
MassBay Fast Facts PowerPoint v2massbayresearch
 
BOS-BOF MONTHLY REPORT -MARCH 2016
BOS-BOF MONTHLY REPORT -MARCH 2016BOS-BOF MONTHLY REPORT -MARCH 2016
BOS-BOF MONTHLY REPORT -MARCH 2016Bill Leverence
 
By narantsetseg purev beneficiary view 2
By narantsetseg purev beneficiary view 2By narantsetseg purev beneficiary view 2
By narantsetseg purev beneficiary view 2Purev Narantsetseg
 
The Israeli Robotics Association - Zvi Shalgo
The Israeli Robotics Association - Zvi ShalgoThe Israeli Robotics Association - Zvi Shalgo
The Israeli Robotics Association - Zvi ShalgoPTL Group
 
Statistics
StatisticsStatistics
StatisticsEBAI
 
Does medical travel pay? Measuring return on investment
Does medical travel pay? Measuring return on investmentDoes medical travel pay? Measuring return on investment
Does medical travel pay? Measuring return on investmentKi Nam Jin
 

Similar to 2013 KCPE Examination Essential Statistics - Kenya (8)

Foundation admissions 2017_eng(2)
Foundation admissions 2017_eng(2)Foundation admissions 2017_eng(2)
Foundation admissions 2017_eng(2)
 
Foundation admissions 2017_eng
Foundation admissions 2017_engFoundation admissions 2017_eng
Foundation admissions 2017_eng
 
MassBay Fast Facts PowerPoint v2
MassBay Fast Facts PowerPoint v2MassBay Fast Facts PowerPoint v2
MassBay Fast Facts PowerPoint v2
 
BOS-BOF MONTHLY REPORT -MARCH 2016
BOS-BOF MONTHLY REPORT -MARCH 2016BOS-BOF MONTHLY REPORT -MARCH 2016
BOS-BOF MONTHLY REPORT -MARCH 2016
 
By narantsetseg purev beneficiary view 2
By narantsetseg purev beneficiary view 2By narantsetseg purev beneficiary view 2
By narantsetseg purev beneficiary view 2
 
The Israeli Robotics Association - Zvi Shalgo
The Israeli Robotics Association - Zvi ShalgoThe Israeli Robotics Association - Zvi Shalgo
The Israeli Robotics Association - Zvi Shalgo
 
Statistics
StatisticsStatistics
Statistics
 
Does medical travel pay? Measuring return on investment
Does medical travel pay? Measuring return on investmentDoes medical travel pay? Measuring return on investment
Does medical travel pay? Measuring return on investment
 

More from KenyaSchoolReport.com

The Deloitte Consumer Survey Consumer Review. Africa: A 21st century review
The Deloitte Consumer Survey Consumer Review. Africa: A 21st century reviewThe Deloitte Consumer Survey Consumer Review. Africa: A 21st century review
The Deloitte Consumer Survey Consumer Review. Africa: A 21st century reviewKenyaSchoolReport.com
 
You can't study if you're hungry Tanzania
You can't study if you're hungry  TanzaniaYou can't study if you're hungry  Tanzania
You can't study if you're hungry TanzaniaKenyaSchoolReport.com
 
A Prospectus for an East Africa Early Learning Challenge
A Prospectus for an East Africa Early Learning ChallengeA Prospectus for an East Africa Early Learning Challenge
A Prospectus for an East Africa Early Learning ChallengeKenyaSchoolReport.com
 
What challenges exist for early childhood care and education
What challenges exist for early childhood care and educationWhat challenges exist for early childhood care and education
What challenges exist for early childhood care and educationKenyaSchoolReport.com
 
Exclusion from-education-final-report
Exclusion from-education-final-reportExclusion from-education-final-report
Exclusion from-education-final-reportKenyaSchoolReport.com
 
Girls education in east africa cssepa
Girls education in east africa   cssepaGirls education in east africa   cssepa
Girls education in east africa cssepaKenyaSchoolReport.com
 
Exploring use of technology to promote teacher development for secondary educ...
Exploring use of technology to promote teacher development for secondary educ...Exploring use of technology to promote teacher development for secondary educ...
Exploring use of technology to promote teacher development for secondary educ...KenyaSchoolReport.com
 
Entrepreneurship vocational training and life skills in east africa cssepa
Entrepreneurship vocational training and life skills in east africa   cssepaEntrepreneurship vocational training and life skills in east africa   cssepa
Entrepreneurship vocational training and life skills in east africa cssepaKenyaSchoolReport.com
 
Are our children learning? Literacy and Numeracy Across East Africa - 2013 r...
Are our children learning? Literacy and Numeracy Across East Africa -  2013 r...Are our children learning? Literacy and Numeracy Across East Africa -  2013 r...
Are our children learning? Literacy and Numeracy Across East Africa - 2013 r...KenyaSchoolReport.com
 
Youth and skills putting education to work
Youth and skills   putting education to workYouth and skills   putting education to work
Youth and skills putting education to workKenyaSchoolReport.com
 
Teaching and learning achieving quality for all
Teaching and learning   achieving quality for allTeaching and learning   achieving quality for all
Teaching and learning achieving quality for allKenyaSchoolReport.com
 
Kenya school report card 2012 pilot report
Kenya school report card 2012   pilot reportKenya school report card 2012   pilot report
Kenya school report card 2012 pilot reportKenyaSchoolReport.com
 
Reading in the mobile era - A study of mobile reading in developing countries
Reading in the mobile era - A study of mobile reading in developing countriesReading in the mobile era - A study of mobile reading in developing countries
Reading in the mobile era - A study of mobile reading in developing countriesKenyaSchoolReport.com
 
TASK FORCE ON THE RE-ALIGNMENT OF THE EDUCATION SECTOR TO THE CONSTITUTION O...
TASK FORCE ON THE RE-ALIGNMENT OF THE EDUCATION  SECTOR TO THE CONSTITUTION O...TASK FORCE ON THE RE-ALIGNMENT OF THE EDUCATION  SECTOR TO THE CONSTITUTION O...
TASK FORCE ON THE RE-ALIGNMENT OF THE EDUCATION SECTOR TO THE CONSTITUTION O...KenyaSchoolReport.com
 

More from KenyaSchoolReport.com (20)

The Deloitte Consumer Survey Consumer Review. Africa: A 21st century review
The Deloitte Consumer Survey Consumer Review. Africa: A 21st century reviewThe Deloitte Consumer Survey Consumer Review. Africa: A 21st century review
The Deloitte Consumer Survey Consumer Review. Africa: A 21st century review
 
Honest accounts?
Honest accounts?Honest accounts?
Honest accounts?
 
You can't study if you're hungry Tanzania
You can't study if you're hungry  TanzaniaYou can't study if you're hungry  Tanzania
You can't study if you're hungry Tanzania
 
A Prospectus for an East Africa Early Learning Challenge
A Prospectus for an East Africa Early Learning ChallengeA Prospectus for an East Africa Early Learning Challenge
A Prospectus for an East Africa Early Learning Challenge
 
What challenges exist for early childhood care and education
What challenges exist for early childhood care and educationWhat challenges exist for early childhood care and education
What challenges exist for early childhood care and education
 
Exclusion from-education-final-report
Exclusion from-education-final-reportExclusion from-education-final-report
Exclusion from-education-final-report
 
Girls education in east africa cssepa
Girls education in east africa   cssepaGirls education in east africa   cssepa
Girls education in east africa cssepa
 
Exploring use of technology to promote teacher development for secondary educ...
Exploring use of technology to promote teacher development for secondary educ...Exploring use of technology to promote teacher development for secondary educ...
Exploring use of technology to promote teacher development for secondary educ...
 
Entrepreneurship vocational training and life skills in east africa cssepa
Entrepreneurship vocational training and life skills in east africa   cssepaEntrepreneurship vocational training and life skills in east africa   cssepa
Entrepreneurship vocational training and life skills in east africa cssepa
 
School report card 2013 Kenya
School report card  2013  KenyaSchool report card  2013  Kenya
School report card 2013 Kenya
 
Are our children learning? Literacy and Numeracy Across East Africa - 2013 r...
Are our children learning? Literacy and Numeracy Across East Africa -  2013 r...Are our children learning? Literacy and Numeracy Across East Africa -  2013 r...
Are our children learning? Literacy and Numeracy Across East Africa - 2013 r...
 
Youth and skills putting education to work
Youth and skills   putting education to workYouth and skills   putting education to work
Youth and skills putting education to work
 
Teaching and learning achieving quality for all
Teaching and learning   achieving quality for allTeaching and learning   achieving quality for all
Teaching and learning achieving quality for all
 
Education in kenya_a_fact_sheet
Education in kenya_a_fact_sheetEducation in kenya_a_fact_sheet
Education in kenya_a_fact_sheet
 
Kenya school report card 2012 pilot report
Kenya school report card 2012   pilot reportKenya school report card 2012   pilot report
Kenya school report card 2012 pilot report
 
Reading in the mobile era - A study of mobile reading in developing countries
Reading in the mobile era - A study of mobile reading in developing countriesReading in the mobile era - A study of mobile reading in developing countries
Reading in the mobile era - A study of mobile reading in developing countries
 
Test and study tips
Test and study tipsTest and study tips
Test and study tips
 
About KSR 2014
About KSR 2014About KSR 2014
About KSR 2014
 
TASK FORCE ON THE RE-ALIGNMENT OF THE EDUCATION SECTOR TO THE CONSTITUTION O...
TASK FORCE ON THE RE-ALIGNMENT OF THE EDUCATION  SECTOR TO THE CONSTITUTION O...TASK FORCE ON THE RE-ALIGNMENT OF THE EDUCATION  SECTOR TO THE CONSTITUTION O...
TASK FORCE ON THE RE-ALIGNMENT OF THE EDUCATION SECTOR TO THE CONSTITUTION O...
 
Top+candidates
Top+candidatesTop+candidates
Top+candidates
 

Recently uploaded

On National Teacher Day, meet the 2024-25 Kenan Fellows
On National Teacher Day, meet the 2024-25 Kenan FellowsOn National Teacher Day, meet the 2024-25 Kenan Fellows
On National Teacher Day, meet the 2024-25 Kenan FellowsMebane Rash
 
Unit-IV- Pharma. Marketing Channels.pptx
Unit-IV- Pharma. Marketing Channels.pptxUnit-IV- Pharma. Marketing Channels.pptx
Unit-IV- Pharma. Marketing Channels.pptxVishalSingh1417
 
Web & Social Media Analytics Previous Year Question Paper.pdf
Web & Social Media Analytics Previous Year Question Paper.pdfWeb & Social Media Analytics Previous Year Question Paper.pdf
Web & Social Media Analytics Previous Year Question Paper.pdfJayanti Pande
 
Making and Justifying Mathematical Decisions.pdf
Making and Justifying Mathematical Decisions.pdfMaking and Justifying Mathematical Decisions.pdf
Making and Justifying Mathematical Decisions.pdfChris Hunter
 
2024-NATIONAL-LEARNING-CAMP-AND-OTHER.pptx
2024-NATIONAL-LEARNING-CAMP-AND-OTHER.pptx2024-NATIONAL-LEARNING-CAMP-AND-OTHER.pptx
2024-NATIONAL-LEARNING-CAMP-AND-OTHER.pptxMaritesTamaniVerdade
 
Activity 01 - Artificial Culture (1).pdf
Activity 01 - Artificial Culture (1).pdfActivity 01 - Artificial Culture (1).pdf
Activity 01 - Artificial Culture (1).pdfciinovamais
 
microwave assisted reaction. General introduction
microwave assisted reaction. General introductionmicrowave assisted reaction. General introduction
microwave assisted reaction. General introductionMaksud Ahmed
 
This PowerPoint helps students to consider the concept of infinity.
This PowerPoint helps students to consider the concept of infinity.This PowerPoint helps students to consider the concept of infinity.
This PowerPoint helps students to consider the concept of infinity.christianmathematics
 
Measures of Central Tendency: Mean, Median and Mode
Measures of Central Tendency: Mean, Median and ModeMeasures of Central Tendency: Mean, Median and Mode
Measures of Central Tendency: Mean, Median and ModeThiyagu K
 
Class 11th Physics NEET formula sheet pdf
Class 11th Physics NEET formula sheet pdfClass 11th Physics NEET formula sheet pdf
Class 11th Physics NEET formula sheet pdfAyushMahapatra5
 
Ecological Succession. ( ECOSYSTEM, B. Pharmacy, 1st Year, Sem-II, Environmen...
Ecological Succession. ( ECOSYSTEM, B. Pharmacy, 1st Year, Sem-II, Environmen...Ecological Succession. ( ECOSYSTEM, B. Pharmacy, 1st Year, Sem-II, Environmen...
Ecological Succession. ( ECOSYSTEM, B. Pharmacy, 1st Year, Sem-II, Environmen...Shubhangi Sonawane
 
ICT Role in 21st Century Education & its Challenges.pptx
ICT Role in 21st Century Education & its Challenges.pptxICT Role in 21st Century Education & its Challenges.pptx
ICT Role in 21st Century Education & its Challenges.pptxAreebaZafar22
 
Z Score,T Score, Percential Rank and Box Plot Graph
Z Score,T Score, Percential Rank and Box Plot GraphZ Score,T Score, Percential Rank and Box Plot Graph
Z Score,T Score, Percential Rank and Box Plot GraphThiyagu K
 
psychiatric nursing HISTORY COLLECTION .docx
psychiatric  nursing HISTORY  COLLECTION  .docxpsychiatric  nursing HISTORY  COLLECTION  .docx
psychiatric nursing HISTORY COLLECTION .docxPoojaSen20
 
Advanced Views - Calendar View in Odoo 17
Advanced Views - Calendar View in Odoo 17Advanced Views - Calendar View in Odoo 17
Advanced Views - Calendar View in Odoo 17Celine George
 
Python Notes for mca i year students osmania university.docx
Python Notes for mca i year students osmania university.docxPython Notes for mca i year students osmania university.docx
Python Notes for mca i year students osmania university.docxRamakrishna Reddy Bijjam
 
Basic Civil Engineering first year Notes- Chapter 4 Building.pptx
Basic Civil Engineering first year Notes- Chapter 4 Building.pptxBasic Civil Engineering first year Notes- Chapter 4 Building.pptx
Basic Civil Engineering first year Notes- Chapter 4 Building.pptxDenish Jangid
 
Grant Readiness 101 TechSoup and Remy Consulting
Grant Readiness 101 TechSoup and Remy ConsultingGrant Readiness 101 TechSoup and Remy Consulting
Grant Readiness 101 TechSoup and Remy ConsultingTechSoup
 

Recently uploaded (20)

On National Teacher Day, meet the 2024-25 Kenan Fellows
On National Teacher Day, meet the 2024-25 Kenan FellowsOn National Teacher Day, meet the 2024-25 Kenan Fellows
On National Teacher Day, meet the 2024-25 Kenan Fellows
 
Mehran University Newsletter Vol-X, Issue-I, 2024
Mehran University Newsletter Vol-X, Issue-I, 2024Mehran University Newsletter Vol-X, Issue-I, 2024
Mehran University Newsletter Vol-X, Issue-I, 2024
 
Unit-IV- Pharma. Marketing Channels.pptx
Unit-IV- Pharma. Marketing Channels.pptxUnit-IV- Pharma. Marketing Channels.pptx
Unit-IV- Pharma. Marketing Channels.pptx
 
Web & Social Media Analytics Previous Year Question Paper.pdf
Web & Social Media Analytics Previous Year Question Paper.pdfWeb & Social Media Analytics Previous Year Question Paper.pdf
Web & Social Media Analytics Previous Year Question Paper.pdf
 
Making and Justifying Mathematical Decisions.pdf
Making and Justifying Mathematical Decisions.pdfMaking and Justifying Mathematical Decisions.pdf
Making and Justifying Mathematical Decisions.pdf
 
INDIA QUIZ 2024 RLAC DELHI UNIVERSITY.pptx
INDIA QUIZ 2024 RLAC DELHI UNIVERSITY.pptxINDIA QUIZ 2024 RLAC DELHI UNIVERSITY.pptx
INDIA QUIZ 2024 RLAC DELHI UNIVERSITY.pptx
 
2024-NATIONAL-LEARNING-CAMP-AND-OTHER.pptx
2024-NATIONAL-LEARNING-CAMP-AND-OTHER.pptx2024-NATIONAL-LEARNING-CAMP-AND-OTHER.pptx
2024-NATIONAL-LEARNING-CAMP-AND-OTHER.pptx
 
Activity 01 - Artificial Culture (1).pdf
Activity 01 - Artificial Culture (1).pdfActivity 01 - Artificial Culture (1).pdf
Activity 01 - Artificial Culture (1).pdf
 
microwave assisted reaction. General introduction
microwave assisted reaction. General introductionmicrowave assisted reaction. General introduction
microwave assisted reaction. General introduction
 
This PowerPoint helps students to consider the concept of infinity.
This PowerPoint helps students to consider the concept of infinity.This PowerPoint helps students to consider the concept of infinity.
This PowerPoint helps students to consider the concept of infinity.
 
Measures of Central Tendency: Mean, Median and Mode
Measures of Central Tendency: Mean, Median and ModeMeasures of Central Tendency: Mean, Median and Mode
Measures of Central Tendency: Mean, Median and Mode
 
Class 11th Physics NEET formula sheet pdf
Class 11th Physics NEET formula sheet pdfClass 11th Physics NEET formula sheet pdf
Class 11th Physics NEET formula sheet pdf
 
Ecological Succession. ( ECOSYSTEM, B. Pharmacy, 1st Year, Sem-II, Environmen...
Ecological Succession. ( ECOSYSTEM, B. Pharmacy, 1st Year, Sem-II, Environmen...Ecological Succession. ( ECOSYSTEM, B. Pharmacy, 1st Year, Sem-II, Environmen...
Ecological Succession. ( ECOSYSTEM, B. Pharmacy, 1st Year, Sem-II, Environmen...
 
ICT Role in 21st Century Education & its Challenges.pptx
ICT Role in 21st Century Education & its Challenges.pptxICT Role in 21st Century Education & its Challenges.pptx
ICT Role in 21st Century Education & its Challenges.pptx
 
Z Score,T Score, Percential Rank and Box Plot Graph
Z Score,T Score, Percential Rank and Box Plot GraphZ Score,T Score, Percential Rank and Box Plot Graph
Z Score,T Score, Percential Rank and Box Plot Graph
 
psychiatric nursing HISTORY COLLECTION .docx
psychiatric  nursing HISTORY  COLLECTION  .docxpsychiatric  nursing HISTORY  COLLECTION  .docx
psychiatric nursing HISTORY COLLECTION .docx
 
Advanced Views - Calendar View in Odoo 17
Advanced Views - Calendar View in Odoo 17Advanced Views - Calendar View in Odoo 17
Advanced Views - Calendar View in Odoo 17
 
Python Notes for mca i year students osmania university.docx
Python Notes for mca i year students osmania university.docxPython Notes for mca i year students osmania university.docx
Python Notes for mca i year students osmania university.docx
 
Basic Civil Engineering first year Notes- Chapter 4 Building.pptx
Basic Civil Engineering first year Notes- Chapter 4 Building.pptxBasic Civil Engineering first year Notes- Chapter 4 Building.pptx
Basic Civil Engineering first year Notes- Chapter 4 Building.pptx
 
Grant Readiness 101 TechSoup and Remy Consulting
Grant Readiness 101 TechSoup and Remy ConsultingGrant Readiness 101 TechSoup and Remy Consulting
Grant Readiness 101 TechSoup and Remy Consulting
 

2013 KCPE Examination Essential Statistics - Kenya

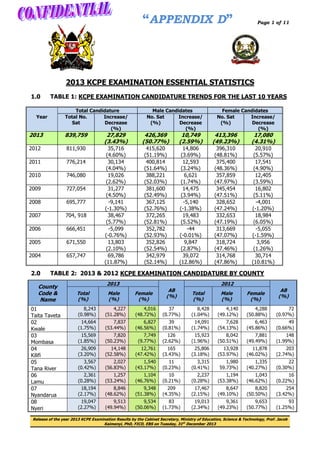
  • 1. “APPENDIX D” Page 1 of 11 2013 KCPE EXAMINATION ESSENTIAL STATISTICS 1.0 TABLE 1: KCPE EXAMINATION CANDIDATURE TRENDS FOR THE LAST 10 YEARS Total Candidature Total No. Increase/ Sat Decrease (%) Year Male Candidates No. Sat Increase/ (%) Decrease (%) Female Candidates No. Sat Increase/ (%) Decrease (%) 2013 839,759 27,829 (3.43%) 426,369 (50.77%) 10,749 (2.59%) 413,396 (49.23%) 17,080 (4.31%) 2012 811,930 2011 776,214 2010 746,080 2009 727,054 2008 695,777 2007 704, 918 2006 666,451 2005 671,550 2004 657,747 35,716 (4.60%) 30,134 (4.04%) 19,026 (2.62%) 31,277 (4.50%) -9,141 (-1.30%) 38,467 (5.77%) -5,099 (-0.76%) 13,803 (2.10%) 69,786 (11.87%) 415,620 (51.19%) 400,814 (51.64%) 388,221 (52.03%) 381,600 (52.49%) 367,125 (52.76%) 372,265 (52.81%) 352,782 (52.93%) 352,826 (52.54%) 342,979 (52.14%) 14,806 (3.69%) 12,593 (3.24%) 6,621 (1.74%) 14,475 (3.94%) -5,140 (-1.38%) 19,483 (5.52%) -44 (-0.01%) 9,847 (2.87%) 39,072 (12.86%) 396,310 (48.81%) 375,400 (48.36%) 357,859 (47.97%) 345,454 (47.51%) 328,652 (47.24%) 332,653 (47.19%) 313,669 (47.07%) 318,724 (47.46%) 314,768 (47.86%) 20,910 (5.57%) 17,541 (4.90%) 12,405 (3.59%) 16,802 (5.11%) -4,001 (-1.20%) 18,984 (6.05%) -5,055 (-1.59%) 3,956 (1.26%) 30,714 (10.81%) 2.0 TABLE 2: 2013 & 2012 KCPE EXAMINATION CANDIDATURE BY COUNTY County Code & Name 01 Taita Taveta 02 Kwale 03 Mombasa 04 Kilifi 05 Tana River 06 Lamu 07 Nyandarua 08 Nyeri 2013 Total (%) Male (%) 2012 Female (%) AB (%) Total (%) Male (%) Female (%) AB (%) 8,243 (0.98%) 4,227 (51.28%) 4,016 (48.72%) 37 (0.77%) 8,428 (1.04%) 4,140 (49.12%) 4,288 (50.88%) 72 (0.97%) 14,664 (1.75%) 7,837 (53.44%) 6,827 (46.56%) 39 (0.81%) 14,091 (1.74%) 7,628 (54.13%) 6,463 (45.86%) 49 (0.66%) 15,569 (1.85%) 7,820 (50.23%) 7,749 (9.77%) 126 (2.62%) 15,923 (1.96%) 8,042 (50.51%) 7,881 (49.49%) 148 (1.99%) 26,909 (3.20%) 14,148 (52.58%) 12,761 (47.42%) 165 (3.43%) 25,806 (3.18%) 13,928 (53.97%) 11,878 (46.02%) 203 (2.74%) 3,567 (0.42%) 2,027 (56.83%) 1,540 (43.17%) 11 (0.23%) 3,315 (0.41%) 1,980 59.73%) 1,335 (40.27%) 22 (0.30%) 2,361 (0.28%) 1,257 (53.24%) 1,104 (46.76%) 10 (0.21%) 2,237 (0.28%) 1,194 (53.38%) 1,043 (46.62%) 16 (0.22%) 18,194 (2.17%) 8,846 (48.62%) 9,348 (51.38%) 209 (4.35%) 17,467 (2.15%) 8,647 (49.10%) 8,820 (50.50%) 254 (3.42%) 19,047 (2.27%) 9,513 (49.94%) 9,534 (50.06%) 83 (1.73%) 19,013 (2.34%) 9,361 (49.23%) 9,653 (50.77%) 93 (1.25%) Release of the year 2013 KCPE Examination Results by the Cabinet Secretary, Ministry of Education, Science & Technology, Prof. Jacob Kaimenyi, PhD, FICD, EBS on Tuesday, 31st December 2013
  • 2. Page 2 of 11 County Code & Name 09 Kirinyaga 10 Murang’a 11 Kiambu 12 Machakos 13 Kitui 14 Embu 15 Meru 16 Marsabit 17 Isiolo 18 Makueni 19 Tharaka Nithi 20 Nairobi 21 Turkana 22 Samburu 23 Trans Nzoia 24 West Pokot 25 Bomet 26 Uasin Gishu 27 Nakuru 28 Kericho 29 Nandi 30 Laikipia 31 Kajiado 32 Narok 33 Baringo 34 Elgeyo Marakwet 2013 Total (%) Male (%) 2012 Female (%) AB (%) Total (%) Male (%) Female (%) AB (%) 11,897 (1.42%) 5,932 (49.86%) 5,965 (50.14%) 114 (2.37%) 12,002 (1.48%) 5,928 (49.39%) 6,074 (50.61%) 170 (2.29%) 25,113 (2.99%) 12,586 (50.12%) 12,527 (49.88%) 156 (3.24%) 25,421 (3.13%) 12,678 (49.87%) 12,743 (50.13%) 180 (2.43%) 37,721 (4.49%) 18,708 (49.60%) 19,013 (50.40%) 180 (3.74%) 37,129 (4.57%) 18,337 (49.39%) 18,729 (50.61%) 291 (3.92%) 30,311 (3.61%) 14,961 (49.36%) 15,350 (50.64%) 87 (1.81%) 29,000 (3.57%) 14,441 (49.80%) 14,559 (50.20%) 163 (2.20%) 31,893 (3.80%) 15,859 (49.73%) 16,034 (50.27%) 107 (2.22%) 29,815 (3.67%) 14,906 (50.00%) 14,909 (50.00%) 203 (2.74%) 13,022 (1.55%) 6,109 (46.91%) 6,913 (53.09%) 40 (0.83%) 12,828 (1.58%) 6,191 (48.26%) 6,637 (51.74%) 106 (1.43%) 26,976 (3.21%) 12,438 (46.11%) 14,538 (53.89%) 225 (4.68%) 24,881 (3.06%) 11,549 (46.42%) 13,332 (53.58%) 383 (5.16%) 3,535 (0.42%) 1,994 (56.41%) 1,541 (43.59%) 29 (0.60%) 3,650 (0.45%) 2,110 (57.81%) 1,540 (42.19%) 35 (0.47%) 2,649 (0.32%) 1,459 (55.08%) 1,190 (44.92%) 16 (0.33%) 2,443 (0.30%) 1,349 (55.22%) 1,094 (44.78%) 23 (0.31%) 27,618 (3.29%) 13,479 (48.81%) 14,139 (51.19%) 81 (1.68%) 26,748 (3.29%) 13,254 (49.55%) 13,494 (50.45%) 99 (1.33%) 8,668 (1.03%) 4,213 (48.60%) 4,455 (51.40%) 32 (0.67%) 8,130 (1.00%) 4,069 (50.05%) 4,061 (49.95%) 59 (0.79%) 46,131 (5.49%) 22,282 (48.30%) 23,849 (51.70%) 102 (2.12%) 45,402 (5.59%) 22,278 (49.07%) 23,124 (50.93%) 630 (8.49%) 6,304 (0.75%) 3,949 (62.64%) 2,355 (37.36%) 181 (3.76%) 6,068 (0.75%) 3,898 (64.24%) 2,170 (35.76%) 134 (1.81%) 3,144 (0.37%) 1,911 (60.78%) 1,233 (39.22%) 40 (0.83%) 3,114 (0.38%) 1,868 (59.99%) 1,246 (40.01%) 21 (0.28%) 18,897 (2.25%) 9,375 (49.61%) 9,522 (50.39%) 140 (2.91%) 17,926 (2.21%) 8,917 (49.74%) 9,009 (50.26%) 222 (2.99%) 9,068 (1.08%) 4,998 (55.12%) 4,070 (44.88%) 74 (1.54%) 8,430 (1.04%) 4,608 (54.66%) 3,822 (45.34%) 108 (1.46%) 20,208 (2.41%) 10,266 (50.80%) 9,942 (49.20%) 52 (1.08%) 20,453 (2.52%) 10,529 (51.48%) 9,924 (48.52%) 83 (1.12%) 20,360 (2.42%) 10,008 (49.16%) 10,352 (50.84%) 86 (1.79%) 19,275 (2.37%) 9,485 (49.21%) 9,790 (50.79%) 165 (2.22%) 42,650 (5.08%) 21,359 (50.08%) 21,291 (49.92%) 240 (4.99%) 40,944 (5.04%) 20,565 (50.23%) 20,379 (49.77%) 473 (6.37%) 20,829 (2.48%) 10,374 (49.81%) 10,455 (50.19%) 67 (1.39%) 20,261 (2.50%) 10,343 (51.05%) 9,918 (48.95%) 100 (1.35%) 18,113 (2.16%) 8,919 (49.24%) 9,194 (50.76%) 99 (2.06%) 17,071 (2.10%) 8,371 (49.04%) 8,700 (50.96%) 137 (1.85%) 10,349 (1.23%) 5,219 (50.43%) 5,130 (49.57%) 56 (1.16%) 10,211 (1.26%) 5,297 (51.88%) 4,914 (48.12%) 87 (1.17%) 13,283 (1.58%) 7,071 (53.23%) 6,212 (46.77%) 90 (1.87%) 12,293 (1.51%) 6,685 (54.39%) 5,608 (45.62%) 143 (1.93%) 15,001 (1.79%) 8,329 (55.52%) 6,672 (44.48%) 79 (1.64%) 13,938 (1.72%) 7,993 (57.35%) 5,945 (42.65%) 89 (1.20%) 13,954 (1.66%) 7,130 (51.10%) 6,824 (48.90%) 31 (0.64%) 13,693 (1.69%) 7,026 (51.31%) 6,667 (48.69%) 53 (0.71%) 11,313 (1.35%) 5,679 (50.20%) 5,634 (49.80%) 43 (0.89%) 11,225 (1.38%) 5,561 (49.54%) 5,664 (50.46%) 59 (0.79%) Release of the year 2013 KCPE Examination Results by the Cabinet Secretary, Ministry of Education, Science & Technology, Prof. Jacob Kaimenyi, PhD, FICD, EBS on Tuesday, 31st December 2013
  • 3. Page 3 of 11 2013 County Code & Name Total (%) 35 Busia 36 Bungoma 37 Kakamega 38 Vihiga 39 Kisumu 40 Kisii 41 Homa Bay 42 Siaya 43 Nyamira 44 Migori 45 Garissa 46 Wajir 47 Mandera 48 Kauda (Sudan) Male (%) Female (%) Total (%) Male (%) AB (%) Female (%) 16,187 (1.93%) 8,362 (51.66%) 7,825 (48.34%) 127 (2.64%) 14,972 (1.84%) 7,950 (53.10%) 7,022 (46.90%) 123 (1.66%) 35,014 (4.17%) 17,205 (49.14%) 17,809 (50.86%) 156 (3.24%) 33,449 (4.12%) 16,513 (49.37%) 16,936 (50.63%) 274 (3.69%) 37,428 (4.46%) 18,146 (48.48%) 19,282 (51.52%) 189 (3.93%) 36,267 (4.47%) 17,691 (48.78%) 18,575 (51.22%) 320 (4.31%) 14,148 (1.68%) 6,602 (46.66%) 7,546 (53.34%) 67 (1.39%) 13,569 (1.67%) 6,387 (47.07%) 7,182 (52.93%) 84 (1.13%) 21,045 (1.68%) 10,598 (50.36%) 10,447 (49.64%) 154 (3.20%) 20,668 (2.55%) 10,695 (51.75%) 9,973 (48.25%) 229 (3.09%) 26,471 (3.15%) 13,534 (51.13%) 12,937 (48.87%) 126 (2.62%) 24,677 (3.04%) 12,568 (50.93%) 12,109 (49.07%) 174 (2.34%) 22,486 (2.68%) 12,323 (54.80%) 10,163 (45.20%) 240 (4.99%) 22,378 (2.76) 12,569 (56.17) 9,809 (43.83) 291 (3.92%) 19,990 (2.38%) 10,272 (51.39%) 9,718 (48.61%) 154 (3.20%) 19,329 (2.38%) 9,910 (51.27%) 9,419 (48.73%) 198 (2.67%) 12,952 (1.54%) 6,633 (51.21%) 6,319 (48.79%) 73 (1.52%) 13,428 (1.65%) 6,748 (50.25%) 6,680 (49.75%) 60 (0.81%) 19,443 (2.32%) 10,791 (55.50%) 8,652 (44.50%) 170 (3.53%) 19,034 (2.34%) 10,831 (56.90%) 8,203 (43.10%) 224 (3.02%) 7,632 (0.91%) 5,231 (68.54%) 2,401 (31.46%) 178 (3.70%) 6,815 (0.84%) 4,748 (69.67%) 2,067 (30.33%) 03 (0.04%) 3,710 (0.44%) 2,478 (66.79%) 1,232 (33.21%) 13 (0.27%) 3,220 (0.40%) 2,158 (67.02%) 1,063 (32.98%) 11 (0.15%) 4,788 (0.57%) 3,351 (69.99%) 1,437 (30.01%) 36 (0.75%) 4,610 (0.57%) 3,121 (67.70%) 1,489 (32.30%) 46 (0.62%) 904 (0.11%) 561 (62.06%) 343 (37.94%) - 883 (0.11%) 576 (65.23%) 307 (34.77%) 114 (1.54%) 839,759 (100.00%) TOTAL 3.0 2012 AB (%) 426,369 (50.77%) 811,930 (100.0%) 415,620 (51.19%) 396,310 (48.81%) 413,390 (49.23%) 4,810 (100%) 7,422 (100%) TABLE 3: 2013 KCPE EXAMINATION AGE DISTRIBUTION BY COUNTY County Code & Name Candidates’ Age Group 12 and below 13 14 15 and16 17 and 18 19 and above Total 01 Taita Taveta 56 (0.01%) 774 (0.09%) 2,054 (0.24%) 3,636 (0.43%) 1,471 (0.17%) 289 (0.03%) 8,280 (0.98%) 02 Kwale 37 (0.01%) 361 (0.04%) 1,668 (0.20%) 5,919 (0.70%) 5182 (0.61%) 1,536 (0.18%) 14,703 (1.74%) 03 Mombasa 180 (0.02%) 1,773 (0.21%) 4,979 (0.59%) 6,215 (0.74%) 2,109 (0.25%) 439 (0.05%) 15,695 (1.86%) 04 Kilifi 62 (0.01%) 708 (0.08%) 3,061 (0.36%) 11,199 (1.33%) 9,397 (1.11%) 2,647 (0.31%) 27,074 (3.21%) 05 Tana River 68 (0.01%) 319 (0.04%) 867 (0.10%) 1,540 (0.18%) 646 (0.08%) 138 (0.02%) 3,578 (0.42%) 06 Lamu 18 (0.004%) 124 (0.01%) 403 (0.05%) 1,014 (0.12%) 659 (0.08%) 154 (0.02%) 2,372 (0.28%) 07 Nyandarua 296 (0.04%) 2473 (0.29%) 5,275 (0.62%) 8,368 (0.99%) 1,841 (0.22%) 150 (0.02%) 18,403 (2.18%) Release of the year 2013 KCPE Examination Results by the Cabinet Secretary, Ministry of Education, Science & Technology, Prof. Jacob Kaimenyi, PhD, FICD, EBS on Tuesday, 31st December 2013
  • 4. Page 4 of 11 County Code & Name Candidates’ Age Group 12 and below 13 14 15 and16 17 and 18 19 and above Total 08 Nyeri 175 (0.02%) 3,082 (0.36%) 6,422 (0.76%) 7,963 (0.94%) 1,355 (0.16%) 134 (0.12%) 19,130 (2.27%) 09 Kirinyaga 307 (0.04%) 2,324 (0.28%) 3,364 (0.40%) 4,279 (0.51%) 1,485 (0.18%) 252 (0.03%) 12,011 (1.42%) 10 Murang'a 505 (0.06%) 4,489 (0.53%) 7,661 (0.91%) 10,102 (1.20%) 2,260 (0.27%) 253 (0.03%) 25,270 (2.99%) 11 Kiambu 509 (0.06%) 8,423 (1.00%) 14,326 (1.70%) 12,298 (1.46%) 2,046 (0.24%) 298 (0.04%) 37,901 (4.49%) 12 Machakos 327 (0.04%) 2,943 (0.35%) 6,874 (0. 81%) 13,478 (1.60%) 6,080 (0.72%) 696 (0.08%) 30,398 (3.60%) 13 Kitui 405 (0.05%) 2,085 (0.25%) 6,153 (0.73%) 14,975 (1.77%) 7,434 (0.88%) 948 (0.11%) 32,000 (3.79%) 14 Embu 183 (0.02%) 1,803 (0.21%) 3,330 (0.39%) 4,875 (0.58%) 2,375 (0.28%) 497 (0.06%) 13,062 (1.55%) 15 Meru 356 (0.04%) 2,737 (0.32%) 6,781 (0.80%) 12,536 (1.48%) 4,187 (0.50%) 601 (0.07%) 27,201 (3.22%) 16 Marsabit 63 (0.01%) 316 (0.04%) 1,370 (0.16%) 1,450 (0.17%) 315 (0.04%) 50 (0.01%) 3,564 (0.42%) 17 Isiolo 51 (0.01%) 323 (0.04%) 739 (0.09%) 1,126 (0.13%) 356 (0.04%) 70 (0.01%) 2,665 (0.32%) 18 Makueni 485 (0.06%) 2,810 (0.33%) 6,123 (0.72%) 12,199 (1.44%) 5357 (0.63%) 725 (0.09%) 27,699 (3.28%) 19 Tharaka Nithi 151 (0.02%) 1,091 (0.13%) 2,304 (0.27%) 3,394 (0.40%) 1,472 (0.17%) 288 (0.03%) 8,700 (1.03%) 20 Nairobi 775 (0.09%) 9,031 (1.07%) 18,255 (2.16%) 14,408 (1.71%) 3,010 (0.36%) 754 (0.09%) 46,233 (5.47%) 21 Turkana 49 (0.01%) 232 (0.03%) 878 (0.10%) 2,592 (0.31%) 1,833 (0.22%) 901 (0.11%) 6,485 (0.77%) 22 Samburu 40 (0.004%) 262 (0.03%) 846 (0.10%) 1,466 (0.17%) 484 (0.06%) 86 (0.01%) 3,184 (0.38%) 23 Trans Nzoia 388 (0.05%) 2,188 (0.26%) 4,313 (0.51%) 8,026 (0.95%) 3,523 (0.42%) 599 (0.07%) 19,037 (2.25%) 24 West Pokot 144 (0.02%) 813 (0.10%) 2,217 (0.26%) 4,154 (0.49%) 1,468 (0.17%) 346 (0.04%) 9,142 (1.08%) 25 Bomet 1,564 (0.19%) 5,192 (0.61%) 6,388 (0.76%) 5,756 (0.68%) 1,190 (0.14%) 170 (0.02%) 20,260 (2.40%) 26 Uasin Gishu 406 (0.05%) 2,811 (0.33%) 5,652 (0.67%) 8,459 (1.00%) 2,722 (0.32%) 396 (0.05%) 20,446 (2.42%) 27 Nakuru 675 (0.08%) 6,284 (0.74%) 13,142 (1.56%) 17,601 (2.08%) 4,575 (0.54%) 612 (0.07%) 42,890 (5.08%) 28 Kericho 1,262 (0.15%) 4,527 (0.54%) 6,085 (0.72%) 6,871 (0.81%) 1792 (0.21%) 358 (0.04%) 20,896 (2.47%) 29 Nandi 265 (0.03%) 1,797 (0.21%) 3,717 (0.44%) 7,731 (0.92%) 3,792 (0.45%) 910 (0.11%) 18,212 (2.16%) 30 Laikipia 103 (0.01%) 1,177 (0.14%) 2,730 (0.32%) 4,770 (0.56%) 1,403 (0.17%) 222 (0.03%) 10,405 (1.23%) Release of the year 2013 KCPE Examination Results by the Cabinet Secretary, Ministry of Education, Science & Technology, Prof. Jacob Kaimenyi, PhD, FICD, EBS on Tuesday, 31st December 2013
  • 5. Page 5 of 11 County Code & Name Candidates’ Age Group 12 and below 13 14 15 and16 17 and 18 19 and above Total 31 Kajiado 309 (0.04%) 1,982 (0.23%) 3,498 (0.41%) 5,240 (0.62%) 1,852 (0.22%) 491 (0.06%) 13,373 (1.58%) 32 Narok 622 (0.07%) 2,715 (0.32%) 4,396 (0.52%) 5,497 (0.65%) 1,538 (0.18%) 310 (0.04%) 15,080 (1.79%) 33 Baringo 669 (0.08%) 3,285 (0.39%) 5,043 (0.60%) 3,997 (0.47%) 883 (0.10%) 108 (0.01%) 13,985 (1.66%) 34 Elgeyo Marakwet 188 (0.02%) 1,451 (0.17%) 4,035 (0.48%) 4,462 (0.53%) 1,053 (0.12%) 167 (0.02%) 11,356 (1.34%) 35 Busia 261 (0.03%) 1,104 (0.13%) 2,496 (0. 30%) 6,611 (0.78%) 4,511 (0.53%) 1,335 (0.16%) 16,314 (1.93%) 36 Bungoma 1,285 (0.15%) 4,772 (0.57%) 7,740 (0.92%) 13,900 (1.65%) 6,324 (0.75%) 1,149 (0.14%) 35,170 (4.16%) 37 Kakamega 610 (0.07%) 3,227 (0.38%) 7,196 (0.85%) 15,871 (1.88%) 8,924 (1.06%) 1,790 (0.21%) 37,617 (4.45%) 38 Vihiga 96 (0.01%) 1,057 (0.13%) 2,853 (0.34%) 6,269 (0.74%) 3,249 (0.38%) 691 (0.08%) 14,215 (1.68%) 39 Kisumu 344 (0.04%) 1,864 (0.22%) 5,079 (0.60%) 9,625 (1.14%) 3,624 (0.43%) 662 (0.08%) 21,199 (2.51%) 40 Kisii 1791 (0.21%) 6,600 (0.78%) 7,645 (0.91%) 7,953 (0.94%) 2,204 (0.26%) 404 (0.05%) 26,597 (3.15%) 41 Homa Bay 777 (0.09%) 2,987 (0.35%) 5,602 (0.66%) 9,376 (1.11%) 3,360 (0.40%) 623 (0.07%) 22,726 (2.69%) 42 Siaya 201 (0.02%) 1,234 (0.15%) 3,657 (0.43%) 9,415 (1.11%) 4,648 (0.55%) 990 (0.12%) 20,144 (2.39%) 43 Nyamira 976 (0.12%) 3,111 (0.37%) 3,978 (0.47%) 3,929 (0.47%) 890 (0.11%) 141 (0.02%) 13,025 (1.54%) 44 Migori 662 (0.08%) 2,769 (0.33%) 5,106 (0.60%) 7,595 (0.90%) 2,871 (0.34%) 609 (0.07%) 19,613 (2.32%) 45 Garissa 66 (0.01%) 296 (0.04%) 1,244 (0.15%) 2,572 (0.30%) 1,828 (0.22%) 1,804 (0.21%) 7,810 (0.92%) 46 Wajir 96 (0.01%) 342 (0.04%) 1,144 (0.14%) 1,632 (0.19%) 391 (0.05%) 118 (0.01%) 3,723 (0.44%) 47 Mandera 76 (0.01%) 314 (0.04%) 1,153 (0.14%) 2,075 (0.25%) 938 (0.11%) 269 (0.03%) 4,824 (0.57%) 48 Kauda (Sudan) - - 10 (0.003%) 62 (0.01%) 213 (0.03%) 619 (0.07%) 904 (0.11%) Total 18,934 (2.24%) 112,382 219,852 334,481 131,120 27,799 844,569 (13.31%) (26.03%) (39.60%) (15.53%) (3.29%) (100.00%) Release of the year 2013 KCPE Examination Results by the Cabinet Secretary, Ministry of Education, Science & Technology, Prof. Jacob Kaimenyi, PhD, FICD, EBS on Tuesday, 31st December 2013
  • 6. Page 6 of 11 4.0 TABLE 4: 2013 AND 2012 KCPE EXAMINATION CENTRES BY COUNTY County Code and Name 1. 2. 3. 4. 5. 6. 7. 8. 9. 10. 11. 12. 13. 14. 15. 16. 17. 18. 19. 20. 21. 22. 23. 24. 25. 26. 01 Taita Taveta 02 Kwale 03 Mombasa 04 Kilifi 05 Tana River 06 Lamu 07 Nyandarua 08 Nyeri 09 Kirinyaga 10 Murang’a 11 Kiambu 12 Machakos 13 Kitui 14 Embu 15 Meru 16 Marsabit 17 Isiolo 18 Makueni 19 Tharaka Nithi 20 Nairobi 21 Turkana 22 Samburu 23 Trans Nzoia 24 West Pokot 25 Bomet 26 Uasin Gishu All Number of Examination Centres 2013 2012 Public Private All Public 200 (0.86%) 183 (0.78%) 17 (0.07%) 327 (1.40%) 289 (1.24%) 38 (0.16%) 331 (1.42%) 91 (0.39%) 240 (1.03%) 463 (1.98%) 358 (1.53%) 105 (0.45%) 110 (0.47%) 104 (0.45%) 6 (0.03%) 71 (0.30%) 67 (0.29%) 4 (0.02%) 454 (1.94%) 321 (1.37%) 133 (0.57%) 519 (2.22%) 380 (1.63%) 139 (0.59%) 317 (1.36%) 191 (0.82%) 126 (0.54%) 595 (2.55%) 463 (1.98%) 132 (0.57%) 847 (3.63%) 470 (2.01%) 377 (1.61%) 916 (3.92%) 802 (3.43%) 114 (0.49%) 1,036 (4.43%) 959 (4.10%) 77 (0.33%) 451 (1.93%) 356 (1.52%) 95 (0.41%) 855 (3.66%) 671 (2.87%) 184 (0.79%) 108 (0.46%) 92 (0.39%) 16 (0.07%) 86 (0.37%) 67 (0.29%) 19 (0.08%) 889 (3.81%) 846 (3.62%) 43 (0.18%) 417 (1.78%) 375 (1.61%) 42 (0.18%) 842 (3.60%) 212 (0.91%) 630 (2.70%) 179 (0.77%) 164 (0.70%) 15 (0.06%) 101 (0.43%) 91 (0.39%) 10 (0.04%) 438 (1.87%) 301 (1.29%) 137 (0.59%) 300 (1.28%) 278 (1.19%) 22 (0.09%) 610 (2.61%) 414 (1.77%) 196 (0.84%) 585 (2.50%) 398 (1.70%) 187 (0.80%) 199 (0.87%) 320 (1.40%) 316 (1.39%) 447 (1.96%) 120 (0.53%) 71 (0.31%) 447 (1.96%) 518 (2.27%) 303 (1.33%) 589 (2.58%) 834 (3.66%) 890 (3.91%) 1,027 (4.51%) 445 (1.95%) 832 (3.65%) 98 (0.43%) 78 (0.34%) 885 (3.88%) 406 (1.78%) 801 (3.51%) 170 (0.75%) 96 (0.42%) 426 (1.89%) 291 (1.28%) 587 (2.58%) 566 (2.48%) 182 (0.80%) 292 (1.28%) 91 (0.40%) 353 (1.55%) 113 (0.50%) 66 (0.29%) 318 (1.40%) 380 (1.67%) 184 (0.81%) 462 (2.03%) 468 (2.05%) 798 (3.50%) 942 (4.13%) 342 (1.50%) 670 (2.94%) 88 (0.39%) 59 (0.26%) 847 (3.72%) 365 (1.60%) 512 (2.25%) 157 (0.69%) 88 (0.39%) 300 (1.32%) 272 (1.19%) 396 (1.74%) 386 (1.69%) Private 17 (0.07%) 28 (0.12%) 225 (0.99%) 94 (0.41%) 7 (0.03%) 5 (0.02%) 129 (0.57%) 138 (0.61%) 119 0.52%) 127 (0.56%)) 366 (1.61%) 92 (0.40%) 85 (0.37%) 103 (0.45%) 162 (0.71%) 10 (0.04%) 19 (0.08%) 38 (0.17%) 41 (0.18%) 289 (1.27%) 13 (0.06%) 8 (0.04%) 126 (0.55%) 19 (0.08%) 191 (0.84%) 180 (0.79%) Release of the year 2013 KCPE Examination Results by the Cabinet Secretary, Ministry of Education, Science & Technology, Prof. Jacob Kaimenyi, PhD, FICD, EBS on Tuesday, 31st December 2013
  • 7. Page 7 of 11 County Code and Name 27. 28. 29. 30. 31. 32. 33. 34. 35. 36. 37. 38. 39. 40. 41. 42. 43. 44. 45. 46. 47. 48. 27 Nakuru 28 Kericho 29 Nandi 30 Laikipia 31 Kajiado 32 Narok 33 Baringo 34 Elgeyo Marakwet 35 Busia 36 Bungoma 37 Kakamega 38 Vihiga 39 Kisumu 40 Kisii 41 Homa Bay 42 Siaya 43 Nyamira 44 Migori 45 Garissa 46 Wajir 47 Mandera 48 Kauda (Sudan) Totals All Number of Examination Centres 2013 2012 Public Private All Public 855 (3.66%) 602 (2.58%) 253 (1.08%) 560 (2.40%) 419 (1.79%) 141 (0.60%) 670 (2.87%) 585 (2.50%) 85 (0.36%) 308 (1.32%) 234 (1.00%) 74 (0.32%) 428 (1.83%) 270 (1.16) 158 (0.68%) 528 (2.26%) 456 (1.95%) 72 (0.31%) 536 (2.29%) 501 (2.14%) 35 (0.15%) 364 (1.56%) 335 (1.43%) 29 (0.12%) 388 (1.66%) 351 (1.50%) 37 (0.16%) 770 (3.30%) 616 (2.64%) 154 (0.66%) 866 (3.71%) 755 (0.23%) 111 (0.48%) 377 (1.61%) 352 (1.51%) 25 (0.11%) 679 (2.91%) 593 (2.54%) 86 (0.37%) 914 (3.91%) 671 (2.87%) 243 (1.04%) 918 (3.93%) 814 (3.48%) 104 (0.45%) 644 (2.76%) 622 (2.66%) 22 (0.09%) 504 (2.16%) 399 (1.71%) 105 (0.45%) 682 (2.92%) 555 (2.38%) 127 (0.54%) 115 (0.49%) 66 (0.28%) 49 (0.21%) 108 (0.46%) 89 (0.38%) 19 (0.08%) 99 (0.42%) 82 (0.35%) 17 (0.07%) 2 (0.09%) 00 (00.00%) 2 (0.01%) 23,362 (100.00%) 18,310 (78.38%) 5,052 (21.62%) 814 (3.72%) 538 (2.36%) 664 (2.91%) 306 (1.34%) 411 (1.80%) 503 (2.21%) 526 (2.31%) 357 (1.57%) 383 (1.68%) 727 (3.19%) 838 (3.68%) 374 (1.64%) 671 (2.94%) 908 (3.98%) 910 (4.10%) 636 (2.79%) 508 (2.23%) 672 (2.95%) 105 (0.46%) 88 (0.39%) 83 (0.36%) 2 (0.009%) 22,786 (100.0%) 594 (2.61%) 416 (1.83%) 571 (2.51%) 223 (0.98%) 250 (1.10%) 407 (1.79%) 502 (2.20%) 332 (1.46%) 349 (1.53%) 587 (2.58%) 740 (3.25%) 350 (1.54%) 592 (2.60%) 669 (2.94%) 784 (3.44%) 620 (2.72%) 394 (1.73%) 554 (2.45%) 59 (0.26%) 66 (0.29%) 69 (0.30%) 00 (0.00%) 18,195 (79.85%) Private 220 (0.97%) 122 (0.54%) 93 (0.40%) 73 (0.32%) 161 (0.71%) 96 (0.42%) 24 (0.11%) 25 (0.11%) 34 (0.15%) 140 (0.61%) 98 (0.43%) 24 (0.11%) 79 (0.35%) 239 (1.05%) 90 (0.39%) 16 (0.07%) 114 (0.50%) 118 (0.52%) 46 (0.20%) 22 (0.10%) 14 (0.06%) 2 (0.01%) 4,473 (19.63%) Release of the year 2013 KCPE Examination Results by the Cabinet Secretary, Ministry of Education, Science & Technology, Prof. Jacob Kaimenyi, PhD, FICD, EBS on Tuesday, 31st December 2013
  • 8. Page 8 of 11 5.0 TABLE 5: KCPE EXAMINATION CANDIDATES’ PERFORMANCE STATISTICS BY RANGE OF MARKS (2012 AND 2013) YEAR AND CANDIDATES OBTAINING THE RANGE OF MARKS CATEGORY 2013 422,276 (50.29%) 417,483 (49.71%) 839,759 (100%) 4,810 (0.57%) 844,569 (100%) Below Mean (001 – 250) Above Mean (251 – 500) Total Number who sat for Examination Candidates Absent Total Candidates Registered 6.0 TABLE 6: 2012 395,030 (48.65%) 416,900 (51.35%) 811,930 (100%) 7,422 (0.91%) 819,353 (100%) KCPE EXAMINATION CANDIDATES WHO SAT FOR THE EXAMINATION UNDER SPECIAL CIRCUMSTANCES BY COUNTY (2012 AND 2013) No. of Cands. Who took exam in prison No. of Cands. Who took exam in hospital 2013 2012 2013 2012 2013 2012 2013 2012 2013 2012 2013 2012 2013 2012 17 19 00 00 00 00 01 08 03 03 01 03 22 33 2. Taita Taveta Kwale 00 00 00 00 00 00 16 17 04 05 28 07 48 29 3. Mombasa 40 29 00 00 07 9 16 18 27 19 09 17 99 92 4. Kilifi 00 01 01 00 00 02 12 08 10 03 29 28 52 42 5. Tana River 00 00 00 03 00 00 02 03 00 01 03 03 05 10 6. Lamu 00 00 01 00 00 00 03 09 00 00 00 00 04 09 7. Nyandarua 00 01 00 00 00 00 04 06 14 19 11 15 29 41 8. Nyeri 17 15 00 01 00 00 07 10 10 04 06 15 42 45 9. Kirinyaga 00 00 00 01 00 00 01 05 03 01 11 10 15 17 10. Murang’a 00 00 02 01 00 00 01 04 08 3 19 17 30 25 11. Kiambu 00 00 00 03 21 19 13 24 31 29 23 05 88 80 12. Machakos 00 00 02 00 03 01 07 14 30 29 19 21 61 65 13. Kitui 00 00 00 01 03 06 05 12 16 06 21 13 45 38 14. Embu 00 00 00 01 00 00 01 5 14 10 09 01 24 17 15. Meru 00 00 03 02 03 02 13 17 14 05 20 24 53 50 16. Marsabit 00 00 00 00 00 00 01 01 01 00 00 00 02 01 17. Isiolo 00 00 00 00 00 03 00 03 00 01 09 07 09 14 18. Makueni 00 00 02 00 00 00 13 11 17 10 10 06 42 27 19. Tharaka Nithi 20. Nairobi 00 00 00 00 00 00 03 02 03 02 00 00 06 04 29 40 01 00 04 02 22 17 32 23 11 12 99 94 21. Turkana 00 02 01 02 02 01 14 08 04 01 11 10 32 24 County Code and Name 1. Blind Low vision Physically/ Mentally challenged Hearing impaired Total Release of the year 2013 KCPE Examination Results by the Cabinet Secretary, Ministry of Education, Science & Technology, Prof. Jacob Kaimenyi, PhD, FICD, EBS on Tuesday, 31st December 2013
  • 9. Page 9 of 11 County Code and Name No. of Cands. Who took exam in prison No. of Cands. Who took exam in hospital Blind Low vision Physically/ Mentally challenged Hearing impaired Total 2013 2012 2013 2012 2013 2012 2013 2012 2013 2012 2013 2012 2013 2012 22. Samburu 00 00 00 00 01 01 22 27 02 00 06 11 31 39 23. Trans Nzoia 24. West Pokot 25. Bomet 00 00 02 00 01 01 34 64 17 11 00 03 54 79 00 00 00 01 05 07 05 13 03 00 00 00 13 21 01 02 00 01 03 03 05 09 20 09 00 00 28 24 26. Uasin Gishu 27. Nakuru 00 00 00 02 00 00 10 11 10 09 08 02 28 24 00 67 01 00 02 00 06 16 17 04 18 12 123 99 28. Kericho 00 01 01 00 01 02 06 14 14 08 32 31 54 56 29. Nandi 01 00 03 03 00 00 07 07 06 11 11 14 27 34 30. Laikipia 00 00 00 00 00 00 04 05 04 05 00 08 08 18 31. Kajiado 00 00 01 00 00 00 13 08 55 02 07 04 76 14 32. Narok 00 00 00 00 00 00 09 02 04 00 00 00 13 02 33. Baringo 00 00 01 00 01 00 08 12 09 14 11 08 30 34 34. Elgeyo Marakwet 35. Busia 00 00 03 02 02 00 12 05 14 01 09 07 40 15 00 00 01 01 00 00 10 07 09 06 09 04 29 18 36. Bungoma 00 00 01 02 00 00 38 34 90 26 20 05 149 67 37. Kakamega 00 01 02 03 03 00 32 78 40 21 48 54 125 157 38. Vihiga 00 00 02 02 00 00 07 06 02 03 24 24 35 35 39. Kisumu 00 111 03 02 04 06 38 28 28 19 20 30 219 196 40. Kisii 13 00 03 02 01 01 05 04 08 03 21 18 38 28 41. Homa Bay 00 00 01 01 00 00 28 38 26 21 28 21 83 81 42. Siaya 00 01 03 03 08 11 37 53 10 12 24 17 82 97 43. Nyamira 00 00 00 02 00 00 07 10 22 03 00 01 29 16 44. Migori 00 02 02 01 00 01 05 28 13 10 44 45 64 87 45. Garissa 02 02 00 01 02 04 50 55 19 16 08 11 79 89 46. Wajir 00 00 02 02 00 00 01 04 04 03 11 11 18 20 47. Mandera 00 08 00 00 00 00 03 19 02 03 00 00 05 30 307 302 45 46 77 82 557 759 690 394 609 556 2,287 2,137 Totals 7.0 TABLE 7: County Code and Name 1. 2. 3. 4. 01 Taita Taveta 02 Kwale 03 Mombasa 04 2013 KCPE EXAMINATION FREQUENCY OF CANDIDATES & EXAMINATION CENTRES INVOLVED IN EXAMINATION IRREGULARITIES BY COUNTY AND DISTRICT Districts involved in Examination Irregularities 2013 Candidates involved in Examination Irregularities Centres involved in Examination Irregularities Districts involved in Examination Irregularities 2012 Candidates involved in Examination Irregularities Centres involved in Examination Irregularities - - - - - - 01 09 01 01 22 01 01 24 01 01 109 4 - - - 01 01 01 Release of the year 2013 KCPE Examination Results by the Cabinet Secretary, Ministry of Education, Science & Technology, Prof. Jacob Kaimenyi, PhD, FICD, EBS on Tuesday, 31st December 2013
  • 10. Page 10 of 11 County Code and Name 5. 6. 7. 8. 9. 10. 11. 12. 13. 14. 15. 16. 17. 18. 19. 20. 21. 22. 23. 24. 25. 26. 27. 28. 29. 30. 31. 32. 33. 34. Kilifi 05 Tana River 06 Lamu 07 Nyandarua 08 Nyeri 09 Kirinyaga 10 Murang’a 11 Kiambu 12 Machakos 13 Kitui 14 Embu 15 Meru 16 Marsabit 17 Isiolo 18 Makueni 19 Tharaka Nithi 20 Nairobi 21 Turkana 22 Samburu 23 Trans Nzoia 24 West Pokot 25 Bomet 26 Uasin Gishu 27 Nakuru 28 Kericho 29 Nandi 30 Laikipia 31 Kajiado 32 Narok 33 Baringo 34 Elgeyo Marakwet Districts involved in Examination Irregularities 2013 Candidates involved in Examination Irregularities Centres involved in Examination Irregularities Districts involved in Examination Irregularities 2012 Candidates involved in Examination Irregularities Centres involved in Examination Irregularities - - - - - - - - - - - - - - - - - - 01 25 01 - - - 01 07 01 01 01 01 - - - - - - - - - 01 18 01 02 105 05 - - - 03 88 05 01 06 01 01 11 01 - - - 04 182 08 03 51 03 - - - - - - - - - - - - 03 127 03 - - - - - - - - - 03 235 11 03 76 04 01 21 01 01 - - - - - 01 19 01 - - - 01 13 01 02 68 05 03 49 04 - - - 01 05 03 01 21 01 01 02 01 01 12 01 - - - 01 60 01 01 28 03 - - - - - - 01 07 01 - - - 01 25 02 03 45 03 - - - 01 06 01 01 16 02 - - - 01 22 01 01 14 01 Release of the year 2013 KCPE Examination Results by the Cabinet Secretary, Ministry of Education, Science & Technology, Prof. Jacob Kaimenyi, PhD, FICD, EBS on Tuesday, 31st December 2013
  • 11. Page 11 of 11 35. 35 Busia 36 Bungoma 37 Kakamega 38 Vihiga 39 Kisumu 40 Kisii 41 Homa Bay 42 Siaya 43 Nyamira 44 Migori 45 Garissa 46 Wajir 47 Mandera 48 Kauda (Sudan) 36. 37. 38. 39. 40. 41. 42. 43. 44. 45. 46. 47. 48. Totals 8.0 TABLE 8: Year 2013 Candidates involved in Examination Irregularities Centres involved in Examination Irregularities Districts involved in Examination Irregularities 2012 Candidates involved in Examination Irregularities Centres involved in Examination Irregularities 01 33 01 - - - 02 82 05 - - - - - - 01 15 01 - - - 01 18 01 02 24 02 01 17 01 03 67 05 03 41 03 05 173 10 01 02 02 - - - 01 01 01 01 20 01 01 01 01 04 56 04 02 19 02 02 12 02 03 30 03 01 11 02 01 25 01 02 33 02 03 76 03 - - - - - - 50 County Code and Name Districts involved in Examination Irregularities 1,576 86 45 732 54 EXAMINATION IRREGULARITY TRENDS FOR THE LAST FIVE (5) YEARS BY EXAMINATION CENTRE AND CANDIDATURE Total No. of Exam. Centres in the Country Centres in which candidates were involved in examination irregularities Total No. of Candidates Number and % of Candidates Involved in examination irregularities 1. 2013 23,362 86 (0.37%) 839,759 1,576 (0.19%) 2. 2012 22,786 811,930 3. 2011 22,154 4. 2010 21,506 5. 2009 20,873 54 (0.24%) 334 (1.51%) 68 (0.29%) 80 (0.38%) 732 (0.09%) 7,974 (1.03%) 1,103 (0.15%) 1,904 (0.26%) 776,214 746,080 727,054 Release of the year 2013 KCPE Examination Results by the Cabinet Secretary, Ministry of Education, Science & Technology, Prof. Jacob Kaimenyi, PhD, FICD, EBS on Tuesday, 31st December 2013