SCS12-006 ppt
•
0 likes•138 views

Powerpoint presented in the 5th ATRANS Symposium last August 24, 2012

Recommended
More Related Content
Similar to SCS12-006 ppt
Similar to SCS12-006 ppt (20)
SCS12-006 ppt
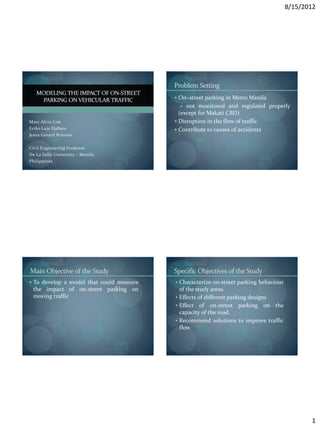
- 1. 8/15/2012 Problem Setting MODELING THE IMPACT OF ON-STREET PARKING ON VEHICULAR TRAFFIC On–street parking in Metro Manila – not monitored and regulated properly (except for Makati CBD) Marc Alvin Lim Disruption in the flow of traffic Eriko Luis Hallare Contribute to causes of accidents Jesus Gerard Briones Civil Engineering Students De La Salle University – Manila Philippines Main Objective of the Study Specific Objectives of the Study To develop a model that could measure Characterize on-street parking behaviour the impact of on-street parking on of the study areas. moving traffic Effects of different parking designs Effect of on-street parking on the capacity of the road. Recommend solutions to improve traffic flow 1
- 2. 8/15/2012 Scope of the Study Significance of the Study Metro Manila Area Improved means of transportation – Roxas Boulevard, San Juan and Makati Benefit a lot of people Parallel, perpendicular and angled – Better vehicular flow One side or two sided – Less accidents with regards to on-street Private and public vehicles parking Road capacity estimation Background literatures for future researchers Theoretical Framework Research Methodology Analytical survey and experimental methods Site selection - Secured and safe location for videotaping - Elevated (provide sufficient view) - on-street parking Designate trap length - travel time - time delay 2
- 3. 8/15/2012 Research Methodology Presentation of the Results of the Study Record videos Site Locations Analysis of Videos Correlation Multiple regression - dummy variables, 1s and 0s - t-stat - coefficients Statistical Analysis Generate Model Figure 5.1 General Map Overview for All Locations Presentation of the Results of the Study Presentation of the Results of the Study Site A: Annapolis Street Video Length: 8 hours Site B: Aguirre Street Video Length: 10 hours Parking Design Flow Direction No. of Lanes for Moving Vehicles Total Vehicles Average Vehicles per 15 minute Cars In Cars Out Parking Design Flow Direction No. of Lanes for Moving Vehicles Total Vehicles Average Vehicles per 15 minute Cars In Cars Out 60 Degree Angled 1 (WB) 136 (EB) Two-way 7649 31 30 1 (WB) 6 (EB) to the Curb 2 (EB) 129 (WB) Parallel to the Curb Two-way 939 124 145 1 (EB) 19 (WB) Westbound Eastbound Westbound Eastbound Figure 5.2 Trap Length for Annapolis Street Figure 5.7 Trap Length for Aguirre Street 3
- 4. 8/15/2012 Presentation of the Results of the Study Presentation of the Results of the Study Site C: Chino Roces Avenue Video Length: 6 hours Site D: Roxas Boulevard Video Length: 8 hours Parking Design Flow Direction No. of Lanes for Moving Vehicles Total Vehicles Average Vehicles per 15 minute Cars In Cars Out Parking Design Flow Direction No. of Lanes for Moving Vehicles Total Vehicles Average Vehicles per 15 minute Cars In Cars Out Perpendicular 1 (WB) 78 (WB) Parallel to the Curb One-way 4 (WB) 7218 375 (WB) 58 50 Two-way 3974 28 28 to the Curb 1 (EB) 47 (EB) Westbound Eastbound Eastbound Westbound Figure 5.12 Trap Length for Chino Roces Avenue Figure 5.17 Trap Length for Roxas Boulevard Presentation of the Results of the Study Presentation of the Results of the Study Freeflow Time Site A: Annapolis Street Freeflow Time Table 5.2 Average Freeflow Time and No. of Samples Site C: Chino Roces Avenue No. of Average Freeflow 95% Level of 120 109 113 100.00% Table 5.18 Average Freeflow Time and No. of Samples Samples Time (secs) Confidence 100 80.00% Westbound 113 9.38 9.04 < µ < 9.72 80 100.00% 68 No. of Average Freeflow 95% Level of Eastbound 198 9.46 9.22 < µ < 9.70 Frequency 80 51 80.00% Samples Time (secs) Confidence Frequency 60.00% Both Dir. 311 9.43 9.23 < µ < 9.63 60 60 39 60.00% Westbound 188 10.93 10.62 < µ < 11.24 41 45 Table 5.3 Average Freeflow Speed 40 40.00% 24 40.00% 40 No. of Average Freeflow 95% Level of 20 6 20.00% Table 5.19 Average Freeflow Speed 20 20.00% Samples Time (m/s) Confidence 3 0 0.00% No. of Average Freeflow 95% Level of Westbound 113 6.78 6.51 < µ < 7.05 0 0.00% 8 10 12 14 More Samples Time (m/s) Confidence 5 7 9 11 More Eastbound 198 6.70 6.50 < µ < 6.90 Both Dir 311 6.72 6.56 < µ < 6.88 Westbound 188 5.93 5.73 < µ < 6.13 Intervals (seconds) Intervals (seconds) Figure 5.3 Histogram for Freeflow Time Figure 5.13 Histogram for Freeflow Time Site D: Roxas Boulevard Site B: Aguirre Street Table 5.26 Average Freeflow Time and No. of Samples Table 5.10 Average Freeflow Time and No. of Samples No. of Average Freeflow 95% Level of No. of Average Freeflow 95% Level of 500 100.00% Samples Time (secs) Confidence 60 50 100.00% Samples Time (secs) Confidence 409 400 80.00% Westbound 540 5.44 5.32 < µ < 5.56 50 Frequency 80.00% Westbound 70 9.43 9.11 < µ < 9.75 Frequency Eastbound 191 5.20 5.04 < µ < 5.36 40 300 246 60.00% 27 60.00% Eastbound 31 9.61 9.21 < µ < 10.01 Both Dir 731 5.38 5.28 < µ < 5.48 30 24 200 40.00% 40.00% Both Dir 101 9.49 9.24 < µ < 9.74 20 Table 5.27 Average Freeflow Speed Table 5.11 Average Freeflow Speed 100 29 42 20.00% 10 20.00% 5 No. of Average Freeflow 95% Level of No. of Average Freeflow 95% Level of 0 0.00% 0 0.00% Samples Time (m/s) Confidence Samples Time (m/s) Confidence 3 5 7 9 More 8 10 More Westbound 70 7.69 7.41 < µ < 7.97 Intervals (seconds) Westbound 540 7.82 7.65 < µ < 7.99 Intervals (seconds) Figure 5.8 Histogram for Freeflow Time Eastbound 31 7.48 7.15 < µ < 7.81 Figure 5.18 Histogram for Freeflow Time Eastbound 191 8.05 7.80 < µ < 8.30 Both Dir 101 7.63 7.41 < µ < 7.85 Both Dir 731 7.88 7.74 < µ < 8.02 4
- 5. 8/15/2012 Presentation of the Results of the Study Presentation of the Results of the Study Vehicles Maneuvering In and Out Vehicles Maneuvering In and Out Site A: Annapolis Street Site C: Chino Roces Avenue Table 5.4 F-Test Two-Sample for Variances Table 5.20 F-Test Two-Sample for Variances 12 35 33 10 M. In M. Out M. In M. In M. Out M. Out 30 10 Mean 21.94 24.37 Mean 11.79 13.48 8 8 M. In M. Out 25 Frequency 1.90188 Frequency 8 F 20 F 0.36609 6 1.85429 20 6 F Critical one-tail F Critical one-tail 0.63032 4 4 4 4 15 11 12 4 3 3 3 10 7 8 2 Table 5.5 t-Test: Two-Sample Assuming Unequal Variances 4 3 Table 5.21 t-Test: Two-Sample Assuming Equal Variances 2 1 1 M. Out M. In 5 2 1 2 1 M. Out M. In 0 Mean 24.37 21.94 0 6 13 20 27 34 More Mean 13.48 11.79 9 14 19 24 29 34 More t Stat 0.67810 Intervals (seconds) t Stat 0.99520 Intervals (seconds) t Critical one-tail 1.67303 t Critical one-tail 1.65992 Figure 5.5 Histogram for Vehicles Maneuvering In and Out Figure 5.15 Histogram for Vehicles Maneuvering In and Out Site B: Aguirre Street Table 5.12 F-Test Two-Sample for Variances Site D: Roxas Boulevard 80 71 16 15 70 M. In M. In M. Out 14 M. In Table 5.28 F-Test Two-Sample for Variances 60 53 M. Out Mean 20.27 10.61 12 M. In M. Out M. Out Frequency Frequency 50 F 4.03845 10 Mean 25.2 18.04 40 34 8 7 F Critical one-tail 1.33231 6 F 2.44254 30 26 24 5 5 5 6 4 1.92994 14 16 3 F Critical one-tail 20 10 10 4 Table 5.13 t-Test: Two-Sample Assuming Unequal Variances 2 10 3 3 1 2 1 Table 5.29 t-Test: Two-Sample Assuming Unequal Variances 0 M. In M. Out 0 M. In M. Out 5 13 21 29 37 More Mean 20.27 10.61 9 17 25 33 More Mean 25.2 18.04 Intervals (seconds) t Stat 3.10543 Intervals (seconds) t Stat 2.28641 t Critical one-tail 1.65381 Figure 5.10 Histogram for Vehicles Maneuvering In and Out Figure 5.20 Histogram for Vehicles Maneuvering In and Out t Critical one-tail 1.68385 Presentation of the Results of the Study Presentation of the Results of the Study Time Delay Time Delay Site A: Annapolis Street Site C: Chino Roces Avenue 20 100.00% 17 Data Analysis: Descriptive Analysis 10 100.00% Data Analysis: Descriptive Analysis 15 80.00% 8 15 8 80.00% Time Delay (secs) Frequency Time Delay (secs) 6 Frequency 60.00% Mean 20.05 10 6 60.00% 7 Mean 35.13 40.00% 4 Median 18.5 4 Median 32.5 4 40.00% 5 3 2 Mode 16 20.00% Mode 32 2 20.00% Minimum 12 Minimum 14 0 0.00% Maximum 38 Maximum 72 0 0.00% 15 30 45 60 More Count 20 12 18 24 More Intervals (seconds) Count 46 Intervals (seconds) Confidence Level(95.0%) 3.35 Confidence Level(95.0%) 4.57 Figure 5.6 Histogram for Time Delay Figure 5.16 Histogram for Time Delay Site B: Aguirre Street Site D: Roxas Boulevard 10 9 8 100.00% Data Analysis: Descriptive Analysis 10 8 100.00% Data Analysis: Descriptive Analysis 8 7 80.00% 8 7 80.00% Time Delay (secs) Frequency Time Delay (secs) Frequency 6 6 60.00% Mean 20.5 6 60.00% Mean 14.78 4 40.00% Median 19 4 3 3 40.00% Median 15 2 2 20.00% Mode 12 2 20.00% Mode 15 0 0.00% Minimum 12 Minimum 4 0 0.00% 14 20 26 More Maximum 34 Maximum 34 6 12 18 24 More Intervals (seconds) Count 30 Count 23 Intervals (seconds) Figure 5.11 Histogram for Time Delay Confidence Level(95.0%) 2.63 Confidence Level(95.0%) 3.19 Figure 5.21 Histogram for Time Delay 5
- 6. 8/15/2012 Presentation of the Results of the Study Presentation of the Results of the Study Average Time Delay vs. Average Freeflow Time Average Time Delay vs. Average Freeflow Time Site A: Annapolis Street Site B: Aguirre Street Site C: Chino Roces Avenue Site D: Roxas Boulevard 25.000 40.00 25 16.000 15.200 14.947 35.57 34.31 14.000 35.00 20.500 20.500 20.000 20.05 20 30.00 12.000 25.00 10.000 15.000 15 Seconds Seconds Seconds 20.00 8.000 9.61 10.93 10.000 9.43 15.00 10 6.000 5.44 5.20 9.46 9.38 4.000 10.00 5.000 5 2.000 5.00 0.000 0.00 0.000 Average Average Average Average Average Average Average Average Average Average Average Average 0 Time Time Freeflow Freeflow Time Delay Time Delay Freeflow Freeflow Time Delay Time Delay Freeflow Freeflow Average Average Time Delay WB Delay EB time WB Time EB WB EB Time EB Time WB EB WB Time EB Time WB Freeflow time Delay Figure 5.3 Average Time Delay vs. Average Freeflow Time Figure 5.8 Average Time Delay vs. Average Freeflow Time Figure 5.13 Average Time Delay vs. Average Freeflow Time Figure 5.18 Average Time Delay vs. Average Freeflow Time Presentation of the Results of the Study Presentation of the Results of the Study y = Travel Time (seconds) x6 = 1, Sample Vehicle x13 = Site Considering Generated Equation Model: x1 = Actual Number of Slowing Down due to a Tight Perpendicular Parking Vehicles Maneuvering In Space along the Road = if both x14 and x15 has a Site A: x2 = Actual Number of = 0, Absence of a Sample value of 0, it automatically y = 9.5302 + 14.8674X6 + 13.6167X9 Vehicles Maneuvering Out Vehicle being Slowed Down means that the study area x7 = Actual Number of considers perpendicular x3 = 1, Two-way parking Pedestrians Crossing = 0, One-way Site B: x8 = Number of Sides of the x14 = 1, Site has Parallel x4 = 1, Vehicle Obstruction Parking Present Road that has Parked y = 9.4880 + 2.5346X2 + 3.7178X4 + 5.2468X6 + 13.6167X9 Vehicles = 0, Site has No Parallel = 0, No Vehicle x9 = Total Maneuvering Parking Obstruction Present (Maneuvering In + Out) x15 = 1, Site has Angled Site C: x5 = 1, Vehicle Maneuvering x10 = Actual Width of the Parking In or Out with Attendant Road (meters) = 0, Site has No Angled y = 10.9505 + 5.3942X2 + 8.8538X4 = 0, No Attendant x11 = Number of Lanes for Parking Moving Vehicles, Westbound x16 = Width of Road Used for x12 = Number of Lanes for Moving Vehicles (meters) Site D: Moving Vehicles, Eastbound y = 5.3762 + 8.2483X4 + 4.6181X5 + 2.0783X6 + 3.80X9 6
- 7. 8/15/2012 Presentation of the Results of the Study Conclusions Generated Equation Model: Presence of an attendant Considering All Sites Presence of a slow moving vehicle due to tight spacing along the road y = 7.3967 + 9.3359X5 + 10.1611X6 + 7.4999X9 Total maneuvering Where: Actual and lessened width of the road y = Travel Time(seconds) Parking designs x5 = Presence of an Attendant when Vehicles are Maneuvering In or Maneuvering Out Presence of an on-street parking x6 = Presence of a Vehicle Slowing Down due to a Tight Space - hindering the flow of traffic along the Road x9 = Total Number of Vehicles Maneuvering - prolongs travel time (Maneuvering In + Out) Recommendations Thank you . . . Longer time More locations - provide more different types of parking designs - two of each parking design Other variables that were not thought of or considered Owning of a digital camera - immediate transfer of data - longer video length capacity End. 7