Download to read offline


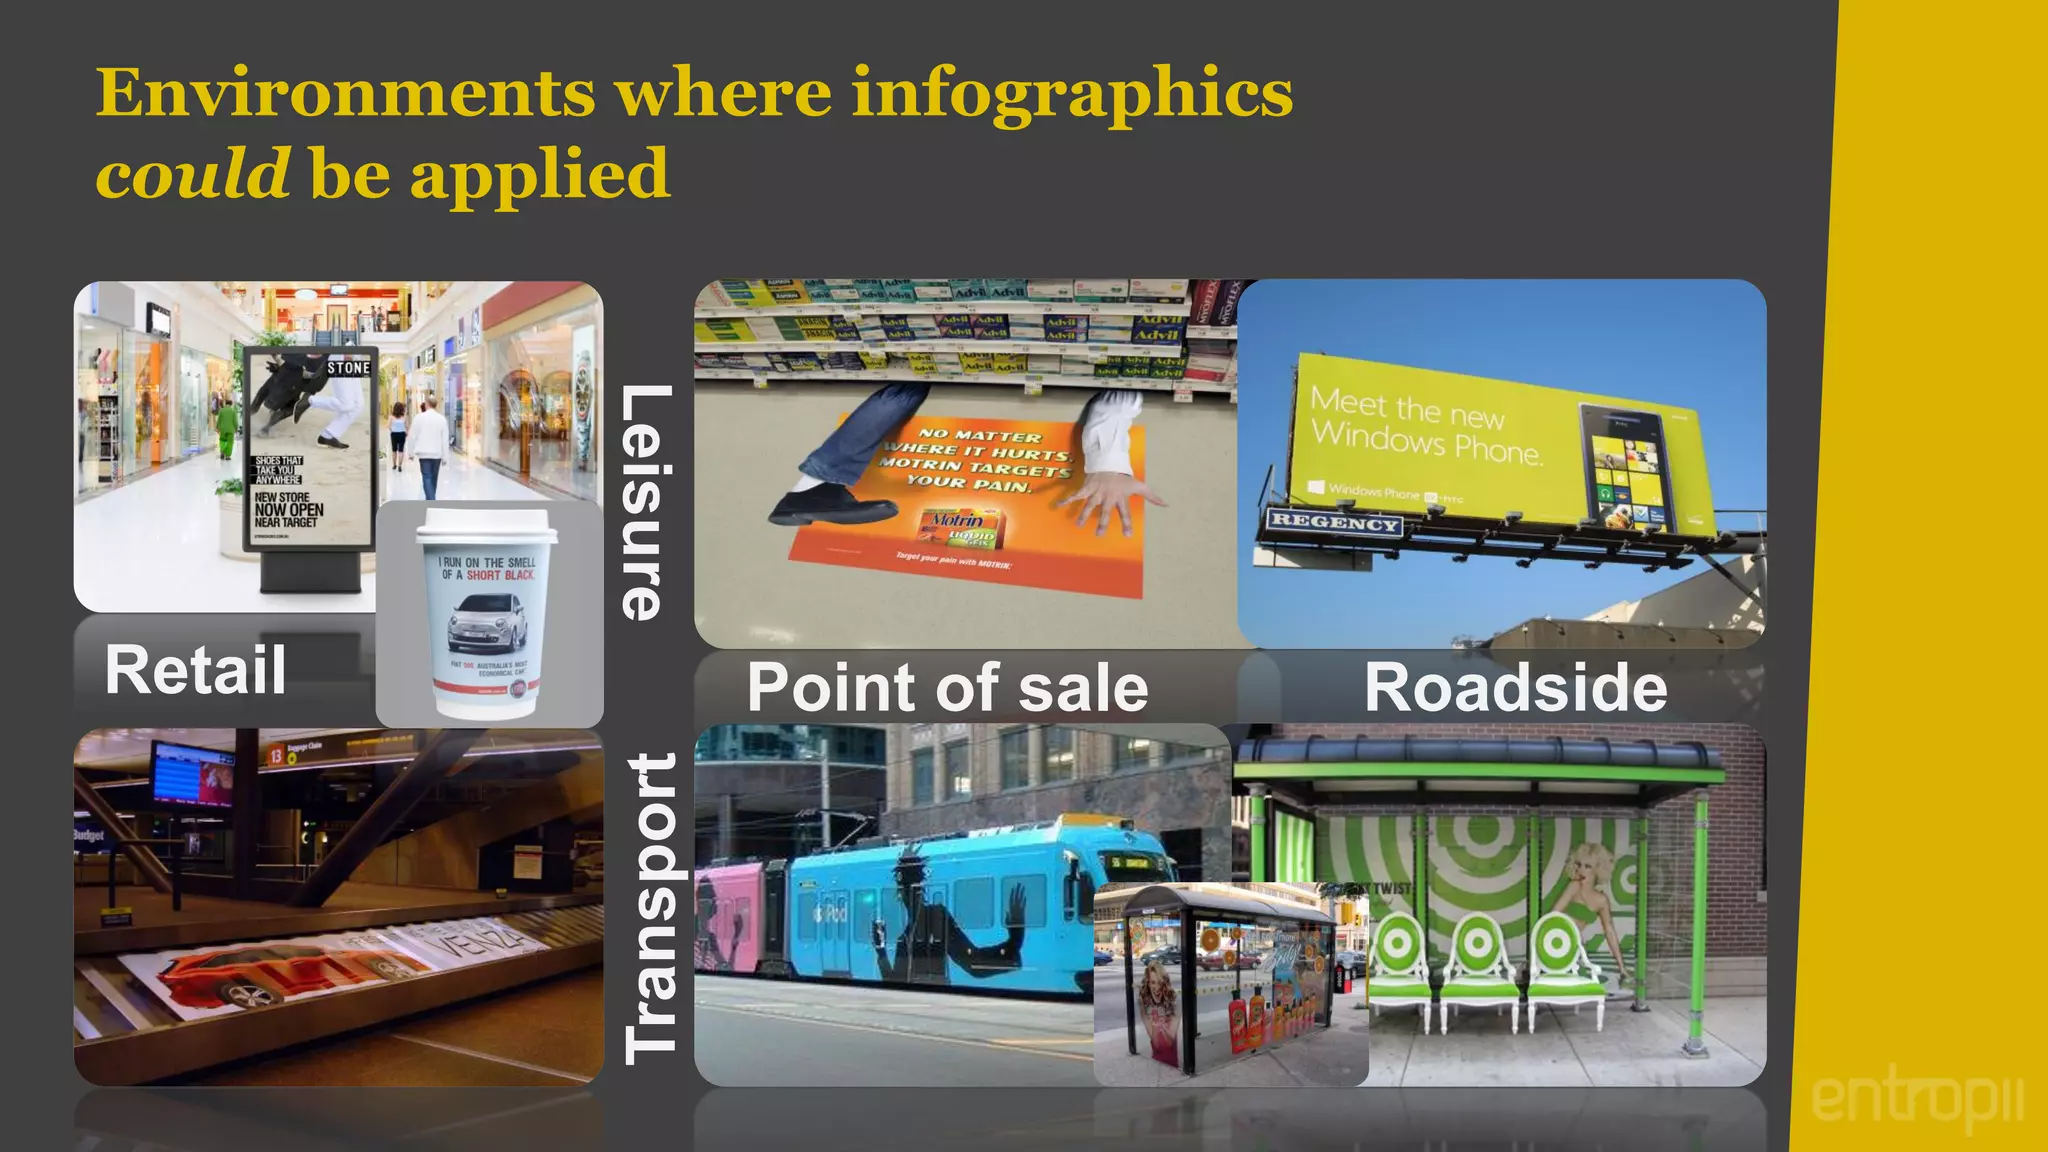


This document discusses how infographics can be used in outdoor advertising. It provides examples of how infographics could be applied on the London transportation network, including on platforms and trains to capture passengers' attention during wait times. Digital display boards and mobile infographics are also discussed as effective outdoor methods. While outdoor infographics allow reaching large audiences, challenges include ensuring the graphic is engaging enough to be noticed and measuring effectiveness.


