Raspberry Pi 5: Challenges and Solutions in Bringing up an OpenGL/Vulkan Driv...
Pope Respiratory Utah
1. Respiratory Disease Associated with Community Air Pollution
and a Steel Mill, Utah Valley
C. ARDEN POPE 1II, PHD
Abstract: This study assessed the association between hospital were nearly double the levels experienced during the winter months
admissions and fine particulate pollution (PM10) in Utah Valley when the mill was closed. This occurred even though relatively
during the period April 1985-February 1988. This time period stagnant air was experienced during the winter the mill was closed.
included the closure and reopening of the local steel mill, the primary Children's admissions were two to three times higher during the
source of PMIo. An association between elevated PMIo levels and winters when the mill was open compared to when it was closed.
hospital admissions for pneumonia, pleurisy, bronchitis, and asthma Regression analysis also revealed that PMIo levels were strongly
was observed. During months when 24-hour PM10 levels exceeded correlated with hospital admissions. They were more strongly
150 ,ug/m3, average admissions for children nearly tripled; in adults, correlated with children's admissions than with adult admissions and
the increase in admissions was 44 per cent. During months with mean were more strongly correlated with admissions for bronchitis and
PM1o levels greater than or equal to 50 ,ug/m3 average admissions for asthma than with admissions for pneumonia and pleurisy. (Am J
children and adults increased by 89 and 47 per cent, respectively. Public Health 1989; 79:623-628.)
During the winter months when the steel mill was open, PMIo levels
Introduction Methods
On March 20, 1984, the US Environmental Protection Study Area
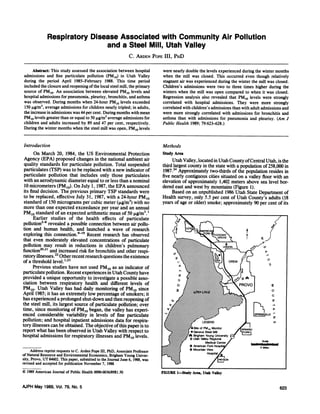
Agency (EPA) proposed changes in the national ambient air Utah Valley, located in Utah County ofCentral Utah, is the
quality standards for particulate pollution. Total suspended third largest county in the state with a population of 258,000 in
particulates (TSP) was to be replaced with a new indicator of 1987.24 Approximately two-thirds of the population resides in
particulate pollution that includes only those particulates five nearly contiguous cities situated on a valley floor with an
with an aerodynamic diameter equal to or less than a nominal elevation of approximately 1,402 meters above sea level bor-
10 micrometers (PM10). On July 1, 1987, the EPA announced dered east and west by mountains (Figure 1).
its final decision. The previous primary TSP standards were Based on an unpublished 1986 Utah State Department of
to be replaced, effective July 31, 1987, with a 24-hour PM,0 Health survey, only 5.5 per cent of Utah County's adults (18
standard of 150 micrograms per cubic meter (,ug/m3) with no years of age or older) smoke; approximately 90 per cent of its
more than one expected exceedance per year and an annual
PM,0 standard of an expected arithmetic mean of 50 ,ug/m3.'
Earlier studies of the health effects of particulate
pollution2' revealed a possible connection between air pollu-
tion and human health, and launched a wave of research
exploring this connection.919 Recent research has observed
that even moderately elevated concentrations of particulate
pollution may result in reductions in children's pulmonary
function20'2' and increased risk for bronchitis and other respi-
ratory illnesses.22 Other recent research questions the existence
of a threshold level.quot; 23
Previous studies have not used PM1O as an indicator of
particulate pollution. Recent experiences in Utah County have
provided a unique opportunity to investigate a possible asso-
ciation between respiratory health and different levels of
PM10. Utah Valley has had daily monitoring of PM10 since
April 1985; it has an extremely low percentage of smokers; it
has experienced a prolonged shut-down and then reopening of
the steel mill, its largest source of particulate pollution; over
time, since monitoring of PM,0 began, the valley has experi-
enced considerable variability in levels of fine particulate
pollution; and hospital inpatient admissions data for respira-
tory illnesses can be obtained. The objective ofthis paper is to
report what has been observed in Utah Valley with respect to
hospital admissions for respiratory illnesses and PM10 levels.
Address reprint requests to C. Arden Pope III, PhD, Associate Professor
of Natural Resource and Environmental Economics, Brigham Young Univer-
sity, Provo, UT 84602. This paper, submitted to the Journal June 6, 1988, was
revised and accepted for publication November 7, 1988
o 1989 American Journal of Public Health 0090-0036/89$1.50 FIGURE 1-Study Area, Utah Valley
AJPH May 1989, Vol. 79, No. 5 623
2. POPE
residents are members of the Church of Jesus Christ of 24-hour
Latter-Day Saints (Mormon)25'26 which has strong church high
teachings against smoking. Monthly
400' mean
Monitoring of particulate pollution began in 1964 and for
carbon monoxide in 1971. On March 3, 1978, the EPA 6
designated the county as a non-attainment area in accordance Steel Mill Closed _
350
with provisions of Section 107 of the Clean Air Act. EPA
ambient air quality standards for TSP and carbon monoxide
were often exceeded at monitoring sites at Provo, Lindon, and 300
Pleasant Grove during winter months when temperature in-
versions trapped emissions in stagnant air near the valley floor.
Generally, the county experienced improvements with 250
respect to carbon monoxide pollution in the 1980s. At one E
monitoring site, the number of exceedances of the maximum
eight-hour primary health standard for carbon monoxide fell C6
from a high of 52 exceedances in 1982 to 10 exceedances in -J
1985. In order to continue to reduce levels ofcarbon monoxide 0
0
:f
pollution in the county, an automobile inspection/maintenance
150+-
and anti-tampering program was implemented in 1986.
Particulate pollution levels in the county remained about
the same from 1979-85. The 24-hour TSP standard of 260 ,ug/m3
was exceeded as many as 10-18 times per year. The average 100-
n
annual geometric mean from 1979-85 for TSP at the Lindon
monitor equalled 65 ,ug/m3. This mean level of TSP exceeded
EPA's annual secondary standard of 60 ,ug/m3 but not the 50-
annual primary health standard of 75 tLg/m3. Monitoring of
sulfur dioxides (SO2) was conducted in the county in the 1970s
but was discontinued because SO2 levels were substantially
JUly Uct.
Jan. Apr. JUly Uct. Jan. Apr. July OCI. Jan.
Apr.
below the annual primary health standard of .03 ppm, the 1985 1986 1987 1988
24-hour primary health standard of .14 ppm and the secondary FIGURE 2-Monthly Mean and 24-Hour High PMIo (fine particulate pollution)
3-hour standard of .5 ppm. Levels, Utah Valley, April 1985-January 1988
The primary industrial source of fine particulate pollution
as measured by PM10 in Utah County is the Geneva steel mill,
1987/88, following the closure and subsequent reopening of the
commonly referred to as Geneva, located near Orem (Figure steel mill, there was much local discussion about the contrast in
1). When in operation, the mill emits approximately 82 per cent air quality. The frequency and severity of respiratory illnesses
of all industrial sources of PMIo including power generation.27
were commonly perceived to have dropped when the mill was
When all sources are accounted for, Geneva's contribution to
shut down, and then dramatically increased when it reopened.
PM1O equals 47 to 80 per cent of total emissions.27 Other Newspaper articles, letters to the editor, and testimonials in
sources of PM10 include wood burning (approximately 16 per
public meetings often reflected this perception by many in the
cent), road dust (approximately 11 per cent), diesel fuel and oil
community.
combustion (approximately 7 per cent). Also, Geneva's con-
tribution to the county's industrial emissions of sulfur oxides, Health Data
nitrogen oxides, hydrocarbons, and carbon monoxides are
approximately 95, 98, 86, and 82 per cent, respectively.27 Hospital admissions data for respiratory-related ill-
Geneva was built for the US Government in the early 1940s nesses were collected from April 1985 through February
as part of the World War II effort. It was sold to US Steel Corp 1988. There were only four hospitals in the county. Data were
in 1946. On August 1, 1986, the Geneva steel mill shut down as collected from three of them that together had 579 beds. The
a result ofa labor dispute with USX Corporation (previously US other hospital in the County had only 20 beds, no pediatrics
Steel Corp.) The plant reopened on September 1, 1987 under a unit, no pulmonologist on its staff, and rarely provided
new owner, Basic Manufacturing and Technologies of Utah, inpatient care for respiratory illnesses.
Inc. In April 1985, the Bureau of Air Quality began to daily A preliminary study of diagnosis-related groups (DRGs)29
monitor PM10 at a site in Lindon (Figure 1) using a Sierra at Utah Valley Regional Medical Center indicated that DRGs
Anderson high volume sampler. During the winter season of 79, 80, and 81 (Respiratory Infections and Inflammations),
1985/86, Geneva was still open and 24-hour PM10 levels ex- DRGs 85 and 86 (Pleural Effusion), DRG 87 (Pulmonary
ceeded 150 ,ug/m3 on 13 occasions. The highest single day Edema and Respiratory Failure), DRG 88 (Chronic Obstruc-
concentration was 365 ,ug/m3. During the winter of 1986/87 tive Pulmonary Disease), DRGs 92 and 93 (Interstitial Lung
while Geneva was shut down, 24-hour PM10 levels never Disease), and DRGs 99 and 100 (Respiratory Signs and
exceeded 150 ,ug/m3. During the winter of 1987/88, following the Symptoms) accounted for only 4.9, 0.6, 1.6, 3.3, 0.8, and 5.8
reopening of Geneva, 24-hour PM10 levels exceeded 150 ,ug/m3 per cent of the collected cases, respectively. Initial compar-
on 10 occasions with a single day high at 223 (Figure 2). ative statistical analysis and regression analysis did not reveal
During the winter of 1985/86, a random sample of county any association between the closing and subsequent reopening
residents indicated that most residents thought that air quality of Geneva or PM10 levels and hospital admissions for any of
was a serious problem and 29 per cent indicated that they had these DRGs individually or collectively.
one or more members of their family who had health problems The bulk ofthe respiratory illness (83 per cent) were for the
that were aggravated by air pollution.28 During the winter of six DRGs that included 89, 90, and 91 (Simple Pneumonia and
624 AJPH May 1989, Vol. 79, No. 5
3. RESPIRATORY DISEASE AND COMMUNITY AIR POLLUTION
During those months when exceedances of the 24-hour PMIo
Pleurisy) and 96, 97, and 98 (Bronchitis and Asthma) with 42 and
41 per cent of the cases, respectively. As a result, this analysis standard of 150 Rg/m3 occurred, the number of admissions for
focuses on hospital admissions where the principal diagnosis children, 0-17 years of age, was nearly triple the number of
was classified within one of these six DRGs. admissions for months with no exceedances (Table 1). In
Monthly admissions data for these six DRGs were com- adults, admissions were approximately 44 per cent higher
piled for each of the three hospitals. Records for outpatient and during the months when exceedances occurred.
emergency admissions were not complete or consistent for the During months when the arithmetic mean PMIo levels
full time period. Therefore, only inpatient data were used in this were equal to or greater than 50 ,ug/m3, children admissions
analysis. Accurate records for Mountain View Hospital were were nearly double than when the average PMIo levels were
available for the time periods April 1985 through September less than 50 ,ug/m3. Adult admissions were increased by
1986 and January 1987 through February 1988. Accurate inpa- approximately 47 per cent.
tient records for the other two hospitals were available from The above comparisons were complicated by the fact that
April 1985-February 1988. the months with especially high levels of particulate pollution
were during the winter, and the reason for the high incidence
Analysis Conducted
ofrespiratory illness may be at least partly attributed to winter
Utah Valley Regional Medical Center's admissions were weather. The intermittent operation of the steel mill provided
sorted into in-county and out-of-county admissions. Both Utah
the opportunity to compare different winter seasons with
Valley Regional Medical Center and American Fork Hospital
marked differences in PM10 levels. Figure 2 demonstrates that
are located within the central urban area ofthe county, near the
when the steel mill was closed, PM1o levels were relatively
major sources of pollution. The primary analysis used the
low. One concern about making observations pertaining to
combined Utah Valley Community Hospital in-county admis-
these time periods is that the winter when the Geneva steel mill
sions and American Fork Hospital admissions as an indicator of
was closed may have had relatively good weather conditions
the level ofrelatively severe respiratory illness in the urban area
and limited conditions of stagnant air. Weather data indicated
of the county.
that temperatures fell below zero on only two occasions
Three other sets of hospital admissions data were used as
throughout the study period, both in January of 1988 when
control variables: quot;all-otherquot; admissions from Utah Valley
they fell as low as -1° and -7°. Snowfall during this time
Regional Medical Center and American Fork Hospital, exclud-
period for 1985/86, 1986/87, and 1987/88 totaled only 45.5, 33.5
ing in-county admissions for pneumonia, pleurisy, bronchitis
and 27.5 inches, respectively.30
and asthma; out-of-county admissions to Utah Valley Regional
The National Weather Service computes an air stagna-
Medical Center for pneumonia, pleurisy, bronchitis, and
tion or clearing index for valleys in Western Utah, including
asthma; and admissions to Mountain View Hospital in Payson
for the same illnesses. Utah Valley.31 The index ranges from 0-1000 with lower
Hospital admission levels were compared across months values indicating more stagnant air. When the index is less
with different levels of particulate pollution as measured by than 200 pollution dispersal is quot;very poorquot; and weather
PM10. Admission levels were also compared across comparable conditions are such that air pollution potential is high. The
periods of time when the steel mill was open, closed, and then month with the lowest average clearing index occurred during
reopened. Finally, monthly hospital emissions were regressed the winter the mill was closed. The average clearing index for
on PM10 levels and weather variables obtained at Brigham the winter period of December-February for 1985/86, 1986/
Young University.30 87, and 1987/88 was 388, 345, and 367, respectively, and the
number of days when the index was below 200 for the same
time periods equalled 47, 54, and 47, respectively.32 Based on
Results
this index the air was relatively more stagnant and had higher
Comparative Analysis air pollution potential during the winter when the mill was
As can be seen in Figure 2, there was considerable shut down than the previous or following winters.
variability in PM10 levels in the county over the study period. Table 2 presents comparisons of hospital admissions be-
TABLE 1-Comparisons of Monthly Average Number of Hospital Inpatient Admissions for Utah Valley Regional Medical Center and American Fork Hospital
across Months with Different Levels of PM1O
Mean
PM10 Mean High Simple Simple
Bronchitis Bronchitis
Number Level for PM10 Level Pneumonia Pneumonia
of Months Months for Months and Asthma and Asthma and Pleurisy and Pleurisy Subtotal Subtotal
Months Included Included Included Included Ages 0-17 Age 18+ Ages 0-17b
Age 0-17 Age 18+ Age 18+b TOTALb
All months 35 45.8 94.7 12.5 17.5 12.0 22.7 24.5 40.2 64.7
(4-3) (11.9) (1.6) (1.0) (1.5) (1.6) (2.8) (2.3) (4.5)
Months when 24-hour 31 37.5 72.3 10.5 16.9 9.9 21.4 20.4 38.3 58.6
PM10 < 150 ,ug/m3 (1.0)
(1.6) (4.4) (1.2) (1.1) (1-3) (1.9) (2.0) (3-5)
Months when 24-hour 4 110.3 268.5 27.8 22.3 28.3 33.0 56.0 55.3 111.3
PM1o > 150 ,ug/m3 (35.0) (4.6) (8.1)
(5.5) (6.7) (2.9) (11.1) (10.0) (14.0)
Months when mean 27 35.1 68.7 10.1 16.5 10.2 19.8 20.3 36.3 56.7
PM10 < 50 Pgm3 (1.3) (4.6) (1.3) (1.1) (3.9)
(1.2) (1.2) (2.1) (2.0)
Months when mean 8 82.0 182.5 20.4 20.8 18.0 32.5 38.4 53.3 91.6
PM10 _ 50 pgm/3 (5.1)
(11.0) (36.4) (4.4) (1.8) (4.5) (3.9) (8.5) (10.0)
aStandard errors at the means are presented in parentheses.
bTotal may not sum up exactly due to rounding error.
AMPH May 1989, Vol. 79, No. 5 625
4. POPE
tween fall and winter periods when the steel mill was open, ity complicates the analysis and makes specific best point
closed, and reopened. During the winter months from Decem- estimators of the correlation coefficients difficult to estimate.
ber to February, hospital admissions for children were approx- However, Model 2 was reestimated using a nonlinear quasi-
imately three times as high when the steel mill was open than Newton iterative procedure which gave identical regression
when it was closed. Even during the Fall months (September- coefficients with somewhat smaller standard-errors.
November) when no exceedances for the 24-hour primary Numerous other regression models were estimated that
health standard occurred, children admissions for bronchitis included snowfall, rainfall, evaporation, monthly mean tem-
and asthma were approximately twice as high when the steel peratures, and mean high temperatures. The weather variable
mill was open. Adult hospital admissions were not as obviously that was consistently most highly correlated with admissions
associated with the reductions of PM,o that accompanied the was the mean low temperature. Regressions that used PM1O
closure ofthe steel mill. There was, however, a notable increase levels lagged for two months, and dummy variables that
in adult admissions following the reopening of the mill. indicated the opening and closing of the steel mill and
inversion seasons were also tried. Even with the inclusion of
Regression Analysis these other variables, strong, positive, correlations between
The results of some of the regression models are pre- hospital admissions and PM1o levels remained. Regression
sented in Table 3. Model 1 regresses total monthly hospital models were also estimated with monthly 24-hour high PM1O
admissions for pneumonia, pleurisy, bronchitis, and asthma levels used as independent variables. The results were similar
on current and lagged PM10 levels. All lagged variables to those in Models 1-14 as presented in Table 3, but 24-hour
simply refer to the previous month's value. The results high PM1O levels were generally not as strongly correlated
demonstrate a strong correlation between admissions and with admissions as were the mean PM10 values.*
PMIo. In fact, 59 per cent of the variance in monthly
Analysis with Control Variables
admissions for these respiratory illnesses is explained by
current and lagged monthly mean PM10 levels alone. Neither comparative analysis nor regression analysis
In Model 2, current and lagged mean low temperature revealed any associations between the control variables and
variables were also included. This relatively simple linear model PM1O levels or the closing and reopening of the steel mill.
with only PM1o and temperature variables explains 83 per cent quot;All-otherquot; admissions that excluded in-county admissions
of the variance in total hospital admissions for these respiratory for pneumonia, pleurisy, bronchitis, and asthma averaged
illnesses. The correlation between mean PM10 levels, mean low 1,562 per month and appeared to be declining slightly over the
temperatures and hospital admissions is particularly striking study period. No seasonal variability nor any association
when actual admissions and estimated admissions based on with PMlo levels or the closing and reopening of the mill was
Model 2 are plotted together over time (Figure 3). Models 3-14 observed. Monthly quot;all-otherquot; admissions regressed on
repeat the analysis done in Models 1 and 2 for total adult PM10 levels and temperature variables (Models 15 and 16 in
admissions, total children admissions, adult admissions for Table 3) showed no significant correlation with PM1O levels.
pneumonia and pleurisy, children admissions for pneumonia Out-of-county hospital admissions to Utah Valley Re-
and pleurisy, adult admissions for bronchitis and asthma, and gional Medical Center and admissions to Mountain View
children admissions for bronchitis and asthma. Hospital in Payson were regressed on PM10 levels and
Autocorrelated errors exist with some of the models, temperature variables. Models 17 and 18 in Table 3 present
particularly those with only PM1o levels as independent the results of the regressions for total out-of-county admis-
variables. This autocorrelation, however, is largely elimi- sions for pneumonia, pleurisy, bronchitis, and asthma. The
nated when weather variables are included. For example, the same regressions were also run on out-of-county and Moun-
Durbin-Watson D statistic is 1.0 for Model 1 and 1.6 for tain View Hospital with admissions broken down by adults,
Model 2. It is 1.3 for Model 3 and 2.0 for Model 4. There is children, and respiratory illnesses, as done in Models 1-14.
also collinearity between PM10 levels and temperature. The
correlation coefficient between the mean low temperature
and monthly mean PM1o levels equals -0.32. This collinear- *Data available upon request to author.
TABLE 2-Comparisons of Hospital InpaUent Admissions for Utah Valley Regional Medical Center and American Fork Hospital across Time Periods with
Geneva Steei Miil Open and Closed
Mean
PM10 Mean High Simple Simple
Steel Level for PM10 Level Bronchitis Bronchitis Pneumonia Pneumonia
for Months
Mill Months and Asthma and Asthma and Pleurisy and Pleurisy Subtotal Subtotal
Included
Open?
Year Included Ages 0-17
Ages 0-17 Ages 0-17
Age 18+ Age 18+ Age 18+ TOTAL
Winter Months (December-February)
1985/86 yes 90 235 78 75 76 73 154 148 302
1986/87 96
no 51 23 67 32 83 55 150 205
1987/88 yes 84 177 78 65 71 126 149 191 340
Fall Months (September-November)
1985 yes 35 63 49 46 20 51 69 97 166
1986 no 31 47 23 48 25 60 48 108 156
1987 yes 47 83 55 46 24 66 79 112 191
Fall and Winter (September-February)
1985/86 yes 63 149 127 121 96 124 223 245 468
1986/87 no 41 71 46 115 57 143 103 258 361
1987/88 yes 111
66 130 133 95 192 228 303 531
626 AJPH May 1989, Vol. 79, No. 5
5. RESPIRATORY DISEASE AND COMMUNITY AIR POLLUTION
TABLE 3-Sample Results of Multiple Regreion Analysis
Dependent
Variable: Regression Coefficients
Lagged Low Lagged Low
Monthly
Admissions Constant PM1o Mean PM10 Mean
Model Temperature Temperature R2
Total 21.18 0.357 0.599
1 - - .59
(7.1) (.14) (.15)
95.54
Total
2 0.119 0.339 -0.351 -0.929 .83
(12.8) (.11) (.11) (.30) (.31)
Total Adult 25.31 0.150 0.175
3 - - .26
(4.9) (.09) (.10)
Total Adult
4 73.65 -0.016 0.017 -0.347 -0.486 .64
(9.4) (.08) (.08) (.22) (.23)
Total Child -4.14 0.207 0.425
5 - - .67
(4.0) (.08) (.08)
Total Child
6 21.89 0.135 0.321 -0.004 -0.443 .75
(9.7) (.08) (.08) (.23) (.24)
Pn/PI Adult
7 14.57 0.139 0.034 - - .19
(3.5) (.07) (.07)
Pn/PI Adult
8 46.84 -0.063
0.020 -0.305 -0.252 .54
(7.3) (.06) (.06) (.17) (.18)
Pn/PI Child
9 -1.50 0.112 0.183 - - .53
(2.5) (.05) (.05)
Pn/PI Child
10 15.49 0.086 0.095 0.196 -0.487 .72
(5.3) (.04) (.05) (.13) (.13)
Br/As Adult 10.74
11 0.011 0.140 - - .36
(2.0) (.04) (.04)
Br/As Adult
12 26.81 -0.037 0.081 -0.042 -0.234 .59
(4.3) (.04) (.04) (.10) (.11)
Br/As Child
13 -2.63 0.094 -0.241 - - .60
(2.5) (.05) (.05)
Br/As Child
14 6.40 0.049 0.226 -0.201 0.044 .64
(6.5) (.05) (.06) (.15) (.16)
All-Other -0.050
15 1586 -0.604 - - .02
(.9)
(46) (1.0)
All-Other
16 1482 0.840 -0.798 5.904 -4.069 .15
(120) (1.0) (2.8)
(1.0) (2.9)
Out-of-County 15.09
17 -0.047 -0.006 0.123 -0.264 .43
Total (2.9) (.02) (.03) (.07) (.07)
Mountain View
18 33.38 -0.013 -0.041 0.073 -0.474 .46
Total (6.8) (.05) (.06) (.16) (.16)
aThe absolute value of the standard errors is provided in parentheses.
Pn/PI=pneumonia/pleurisy
Br/As=bronchibs/asthma
Although Payson is located in the county and should be
similarly influenced by contagious illness, it is over 32
kilometers from the major sources of pollution and should not 140
be as influenced by monitored levels of PMIo. Actual Total Admissions
-
The regressions using out-of-county and Mountain View Estimated Total Admissions (Model 2)
.....
Hospital admissions are limited by the fact that only about 15 _ Actua Children's Admissions
120 .
Estimated Children's Admissions
-
per cent of Utah Valley Regional Medical Center admissions (Model 6)
are out-of-county, and Mountain View Hospital's data are 100-
missing for the months of October, November, and Decem-
ber of 1986. The results indicated that there was significant
correlation between the mean low temperature lagged vari- 80-
able similar to those in the earlier regressions. There was no
positive correlation between out-of-county or Mountain
View Hospital admissions and PM1o levels, however.
Discussion
The results indicated that hospital admissions for respira-
tory illnesses were strongly associated with PM10 levels. This
association is much stronger for children than adults, and
somewhat stronger for bronchitis and asthma than for pneu-
monia and pleurisy. These associations were particularly strong
Jan. Apr. July Oct. Jan.
Apr. Oct.
Juty July Oct.
with monthly lagged variables suggesting that the health effects Jan. Apr.
1985 1986 1987 1988
of particulate pollution are cumulative and that it takes time FIGURE 3-Actual and Estimated Hospital Admissions, April 1985 through
before they are manifested in inpatient hospital admissions data. January 1988, Utah Valley
AJPH May 1989, Vol. 79, No. 5
627
6. POPE
Also, increased admissions for children are observed even for 2. Ciocco A, Thompson DJ: A follow-up on Donora ten years after:
methodology and findings. Am J Public Health 1961; 51:155-164.
months when PM,o did not exceed 150 ,ug/m3, suggesting that 3. Firket J: The cause of the symptoms found in the Meuse Valley during the
this standard may not be adequate protection for some children. fog of December, 1930. Bull Acad Roy Med Belg 1931; 11:683-741.
There are several concerns about these observations. One 4. Gore AT, Shaddick CW: Atmospheric pollution and mortality in the
County of London. Br J Prev Soc Med 1968; 12:104-113.
concern is that if increases in contagious illnesses such as 5. Logan WPD: Mortality in London fog incident. Lancet 1953; 1:336-338.
influenza by chance coincided with periods of high PM,o levels, 6. Schrenk JJ, Heimann H, Clayton GD, Gafafer W, Wexler H: Air Pollution
particularly during the winters when the steel mill was open, in Donora, Pennsylvania, Epidemiology of the Smog Episode of October
then the observed correlation between PM,0 and admissions 1948. Public Health Bull 306. Washington DC: Govt Printing Office, 1949.
7. Scott JA: The London fog of December 1962. Med Off 1963; 109:250.
may be spurious. It would be expected, however, that if this 8. Waller RE, Commins BT: Episodes of high pollution in London, 1952-
were the case, the same correlation would be found in hospital 1966. In: Proceedings, International Clean Air Conference, Part I. Lon-
admissions from neighboring counties or communities unaf- don: National Society for Clean Air, 1966; 288.
9. American Thoracic Society: Health Effects of Air Pollution. New York:
fected by Utah Valley's principal sources of pollution. No such American Lung Association, 1978.
correlation was found for out-of-county admissions to Utah 10. Cannon JS: The Health Costs of Air Pollution. New York: American Lung
Valley Regional Medical Center or to Mountain View Hospital Association, 1985.
in nearby Payson. Nor was such correlation found between 11. Durham WH: Air pollution and student health. Arch Environ Health 1974;
28:241-254.
PM,o levels and non-respiratory hospital admissions. 12. Hammer DI, Miller FJ, Stead AG, Hayes CG: Air pollution and childhood
Another concern is that often levels of several air lower respiratory disease, I. Exposure to particulate matter in New York,
pollutants rise and fall in concert. PM,o may be a surrogate 1972. In: Finkel AJ, Duel WC (eds): Clinical Implications of Air Pollution
Research. Acton, MA: Publishing Sciences Group, 1976.
for other air pollutants with which it is temporarily associ- 13. Holland WW, Bennett AE, Cameron IR, Du V, Florey C, Leeder SR,
ated. Two pollutants that may have had similar impacts on Schilling RSF, Swan AV, Walter RE: Health effects of particulate
respiratory illnesses during the study period are total sus- pollution: Reappraising the evidence. Am J Epidemiol 1979; 110:527-659.
pended particulates and ozone. Because PM,0 measures only 14. Lave LB, Seskin EP: Air Pollution and Human Health. Baltimore: John
Hopkins University Press, 1977.
relatively small particles of particulate pollution, and because 15. Lawther PJ, Waller PE, Henderson M: Air pollution and exacerbations of
it is the smaller particles that are expected to pose the greatest bronchitis. Thorax 1970; 25:525-539.
health risks, it is considered the most appropriate measure of 16. Levy D, Gent M, Newhouse MT: Relationship between acute respiratory
illness and air pollution in an industrial city. Am Rev Respir Dis 1973;
particulate pollution as it relates to respiratory health.' 116: 167-173.
Regression models estimated with monthly mean total sus- 17. Thibodeau LA, Reed RB, Bishop YMM, Kammerman LA: Air pollution
pended particulate levels used as independent variables and human health: A review and reanalysis. Environ Health Perspect 1980;
yielded results similar to Models 1-14 presented in Table 3 34:165-183.
18. Ware J, Thibodeau LA, Speizer FE, Colome S, Ferris BG Jr: Assessment
which used PM,0. The correlations between admissions and of the health effects of atmospheric sulfur oxides and particulate matter:
total suspended particulates were generally not as strong as evidence from observational studies. Environ Health Perspect 1981;
those between admissions and PM,0. 41:255-276.
19. Whittenmore AS, Korn EL: Asthma and air pollution in the Los Angeles
There was no evidence that suggested that PM,o was area. Am J Public Health 1980; 70:687-696.
serving as a surrogate for ozone pollution. The only times 20. Dassen W, Brunekreef B, Hoek G, Hofschreuder P, Staatsen B, de Grout
ozone pollution in Utah Valley rose to levels of any conse- H, Schouten E, Biersteker K: Decline in children's pulmonary function
quence was in the summer months during hot sunny days, during an air pollution episode. J Air Pollut Control Assoc 1986; 36:1223-
1227.
whereas the periods of high levels of PM,0 and hospital 21. Dockery DW, Ware JH, Ferris BG Jr, Spierzer FE, Cook NR, Herman
admissions for respiratory illness occurred mostly during the SM: Change in pulmonary function in children associated with air pollution
winter months when the steel mill was in operation. The results episodes. J Air Pollut Control Assoc 1982; 32:937-942.
22. Ware JH, Ferris BG Jr, Dockery DW, Spengler JD, Stram DO, Speizer
of this study suggest that the dominant pollution in terms ofits FE: Effects of ambient sulfur oxides and suspended particulates on
impact on respiratory health in Utah Valley is particulate respiratory health of preadolescent children. Am Rev Respir Dis 1986;
pollution and that PM,0 is a better indicator than TSP. 133:834-842.
23. Ostro BD: A search for a threshold in the relationship of air pollution to
Finally, the association between respiratory illness and mortality: a reanalysis of data on London winters. Environ Health
particulate pollution found in this study is relatively large as Perspect 1984; 58:397-399.
compared with some previous studies.2022'33 This relatively 24. Woods and Poole Economics, Inc: 1987 Nevada and Utah State Profile.
strong association can be explained in part because PM,0 is Washington DC: Woods and Poole, Inc, 1987.
25. Deseret News: 1985 Church Almanac. Salt Lake City, Utah: Deseret
a better indicator of particulate pollution as it relates to
News: 1984.
respiratory health than previously used indicators.' Also, 26. Johnson DW, Picard PR, Quin B: Churches and Church Membership in the
because Utah Valley experiences relatively high levels of United States, 1971: An Enumeration by Region, State, and County.
particulate pollution, yet has an extremely low portion of its Washington DC: Glenmary Research Center, 1974.
27. Utah Bureau ofAir Quality: Utah Air Emission Inventory. Salt Lake City,
population that smoke, particulate pollution is likely a rela- Utah: Utah State Department of Health, various issues 1985-87.
tively large contributor to respiratory disease in the county. 28. Pope CA III, Miner FD Jr: Valuation of improved air quality in Utah
County. Environ Manag 1988; 12:381-389.
29. Lorenz EW, Jones MK: The Physician's DRG Working Guidebook.
Washington DC: St Anthony Hospital Publications, 1987.
ACKNOWLEDGMENTS 30. Brigham Young University, Department of Geography: Weather Station
Special thanks are given to Victor Archer, MD, Clark Bishop, MD, Don Reports. Provo, Utah: Brigham Young University, 1985-88.
Bloxham, PhD, Joseph Miner, MD, and Henry Yeates, MD, as well as personnel 31. Jackman DN, Chapman WT: Some meterological aspects of air pollution
at the Utah Bureau of Air Quality; Utah Valley Regional Medical Center;
in Utah with emphasis on the Salt Lake Valley. Technical Memorandum
American Fork Hospital; and Mountain View Hospital for providing informa-
NWS WR-120. Salt Lake City, Utah: National Oceanic and Atmospheric
tion, data, helpful suggestions, and reviews of earlier drafts of this manuscript.
Administration, National Weather Service, Western Region, 1977.
32. National Oceanic and Atmospheric Administration, National Weather Ser-
vice. Air Stagnation Index for Basin I, Western Utah. Salt Lake City, Utah:
REFERENCES National Weather Service Western Region, April 1985-February 1988.
1. US Environmental Protection Agency: Revisions to the National Ambient 33. Samet JM, Bishop Y, Speizer FE, Spengler JF, Benjamin GF Jr: The
Air Quality Standards for Particulate Matter. Federal Register July 1, 1987; relationship between air pollution and emergency room visits in an
52:(126)24634-24669. industrial community. J Air Pollut Control Assoc 1981; 31:236-240.
628 AJPH May 1989, Vol. 79, No. 5