Download as PDF, PPTX
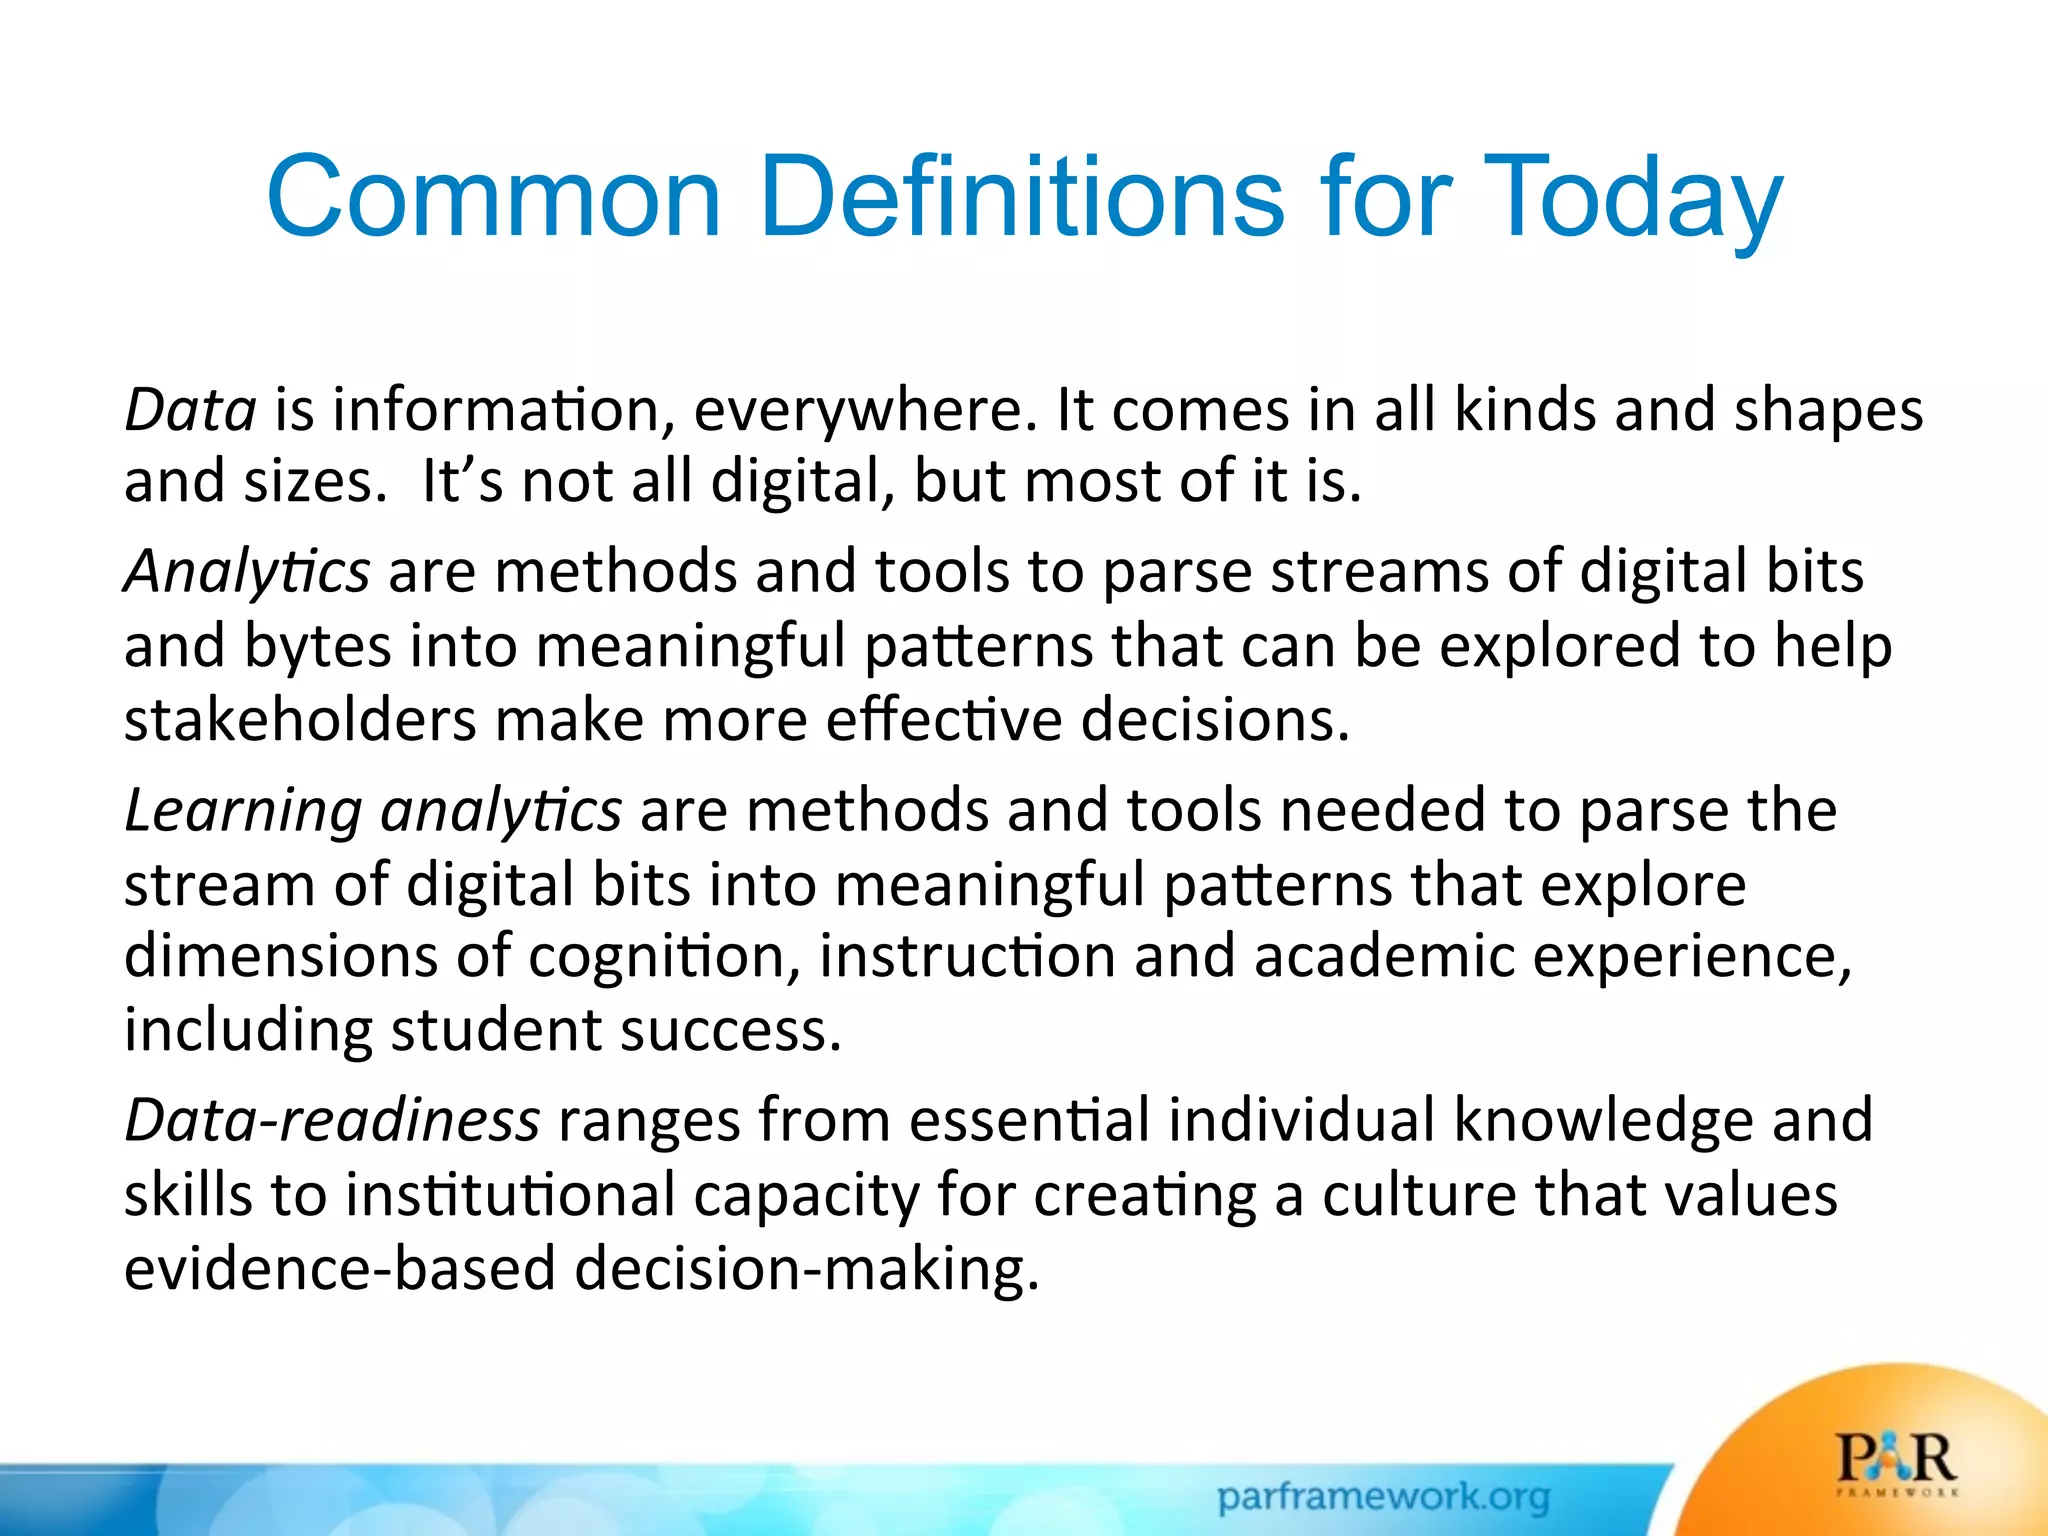


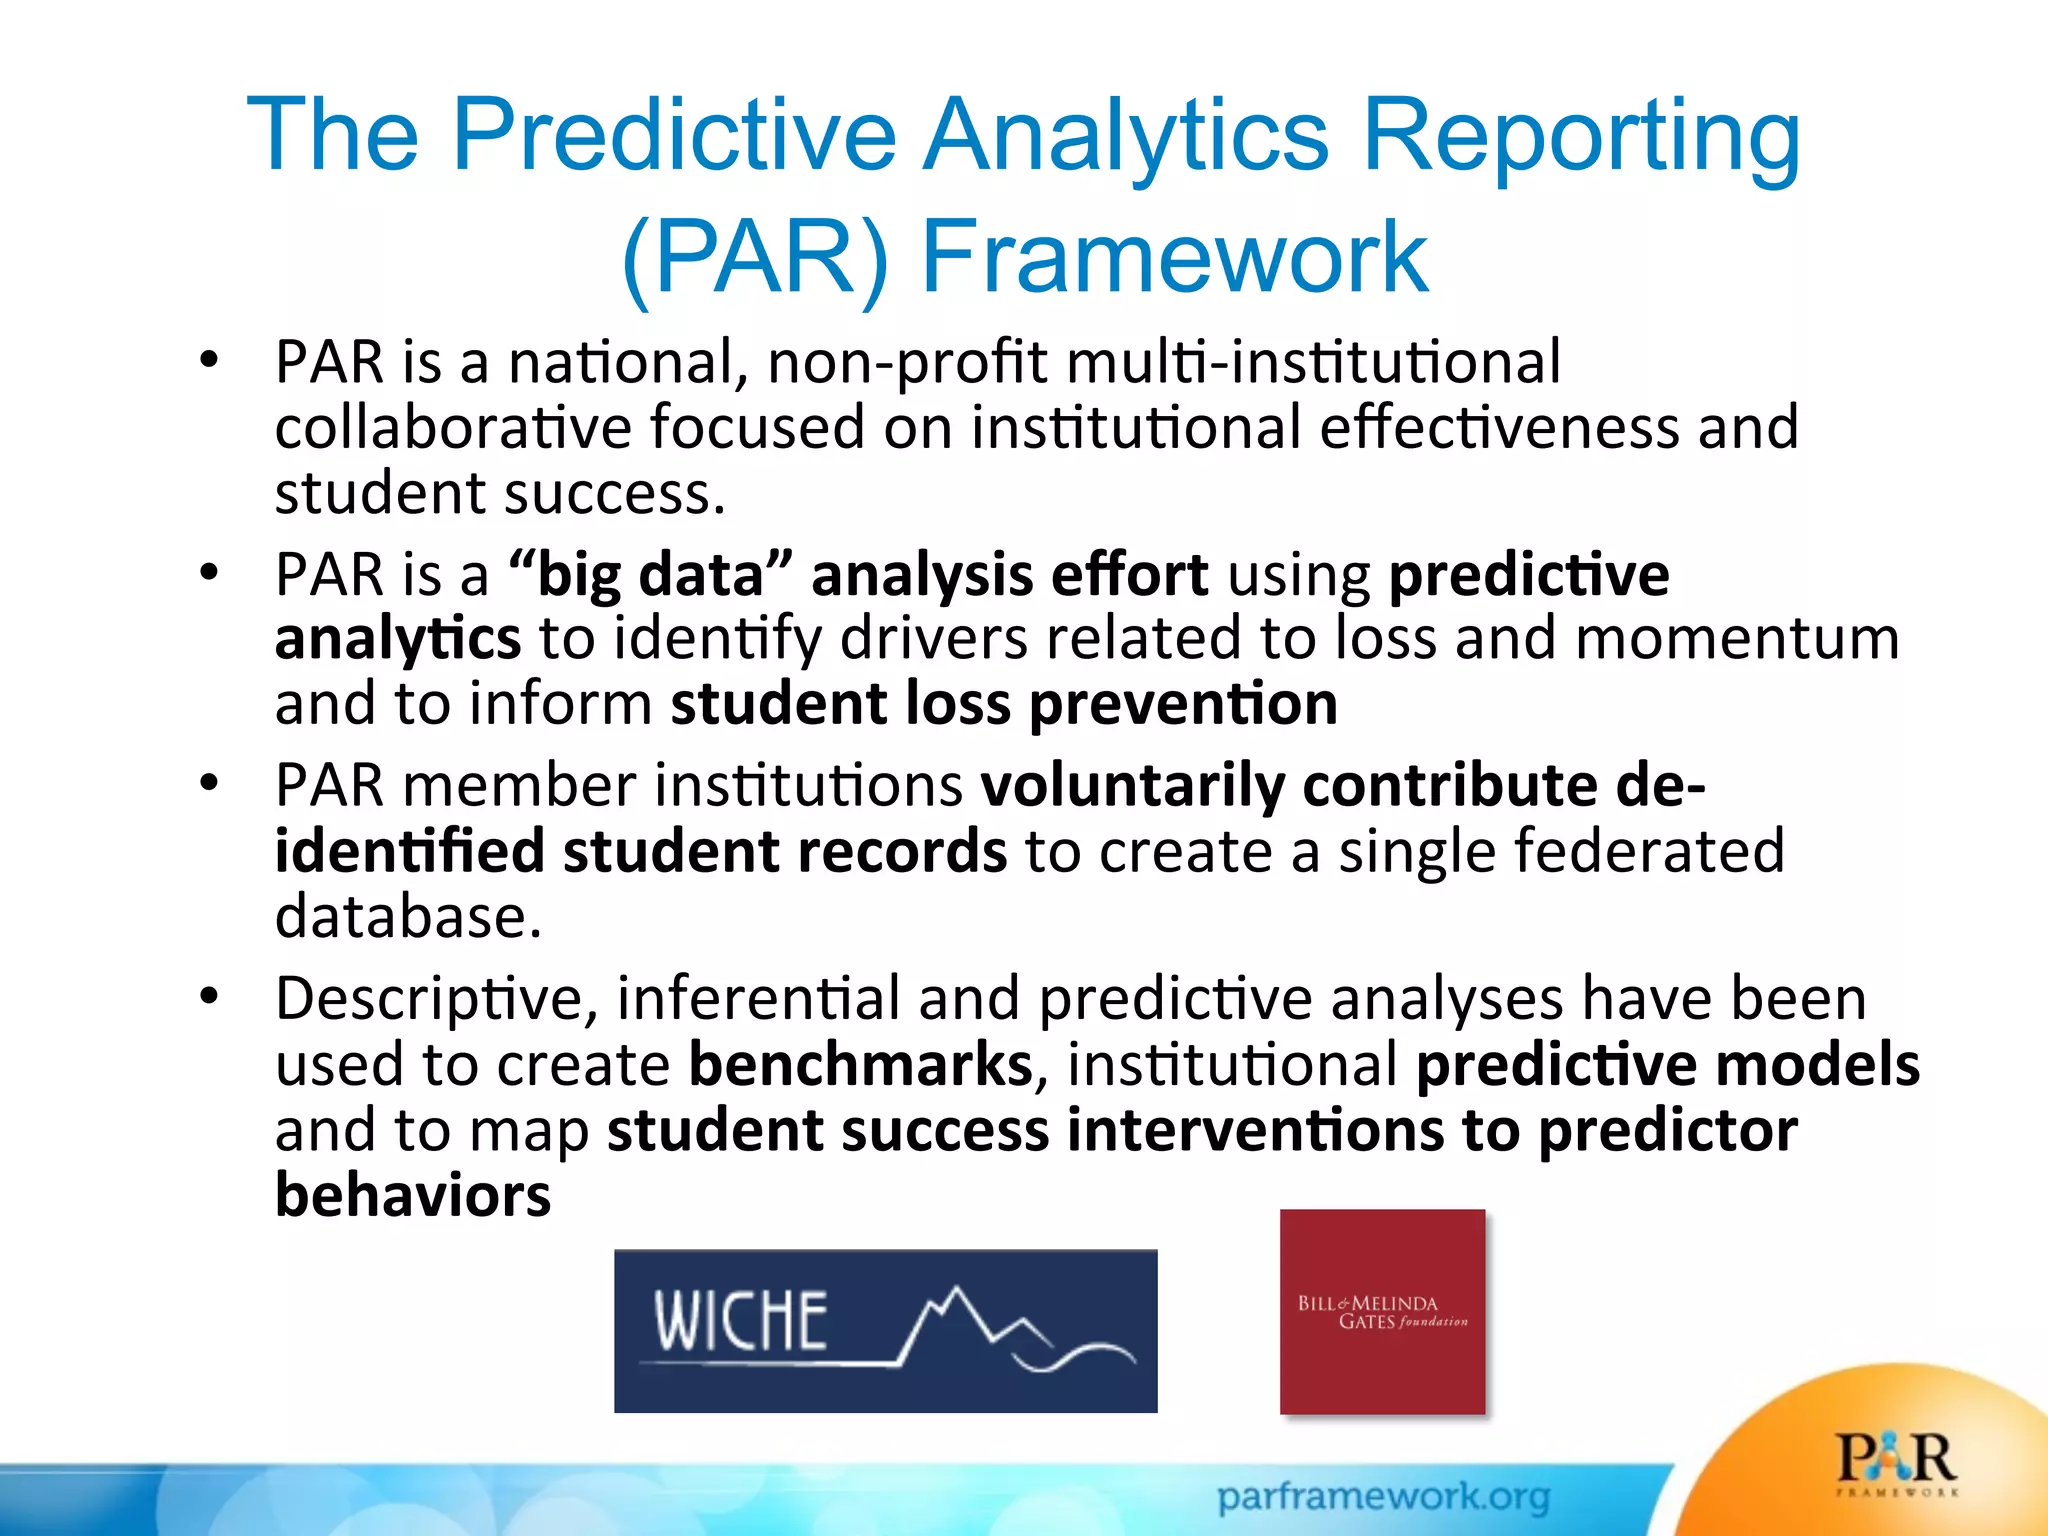
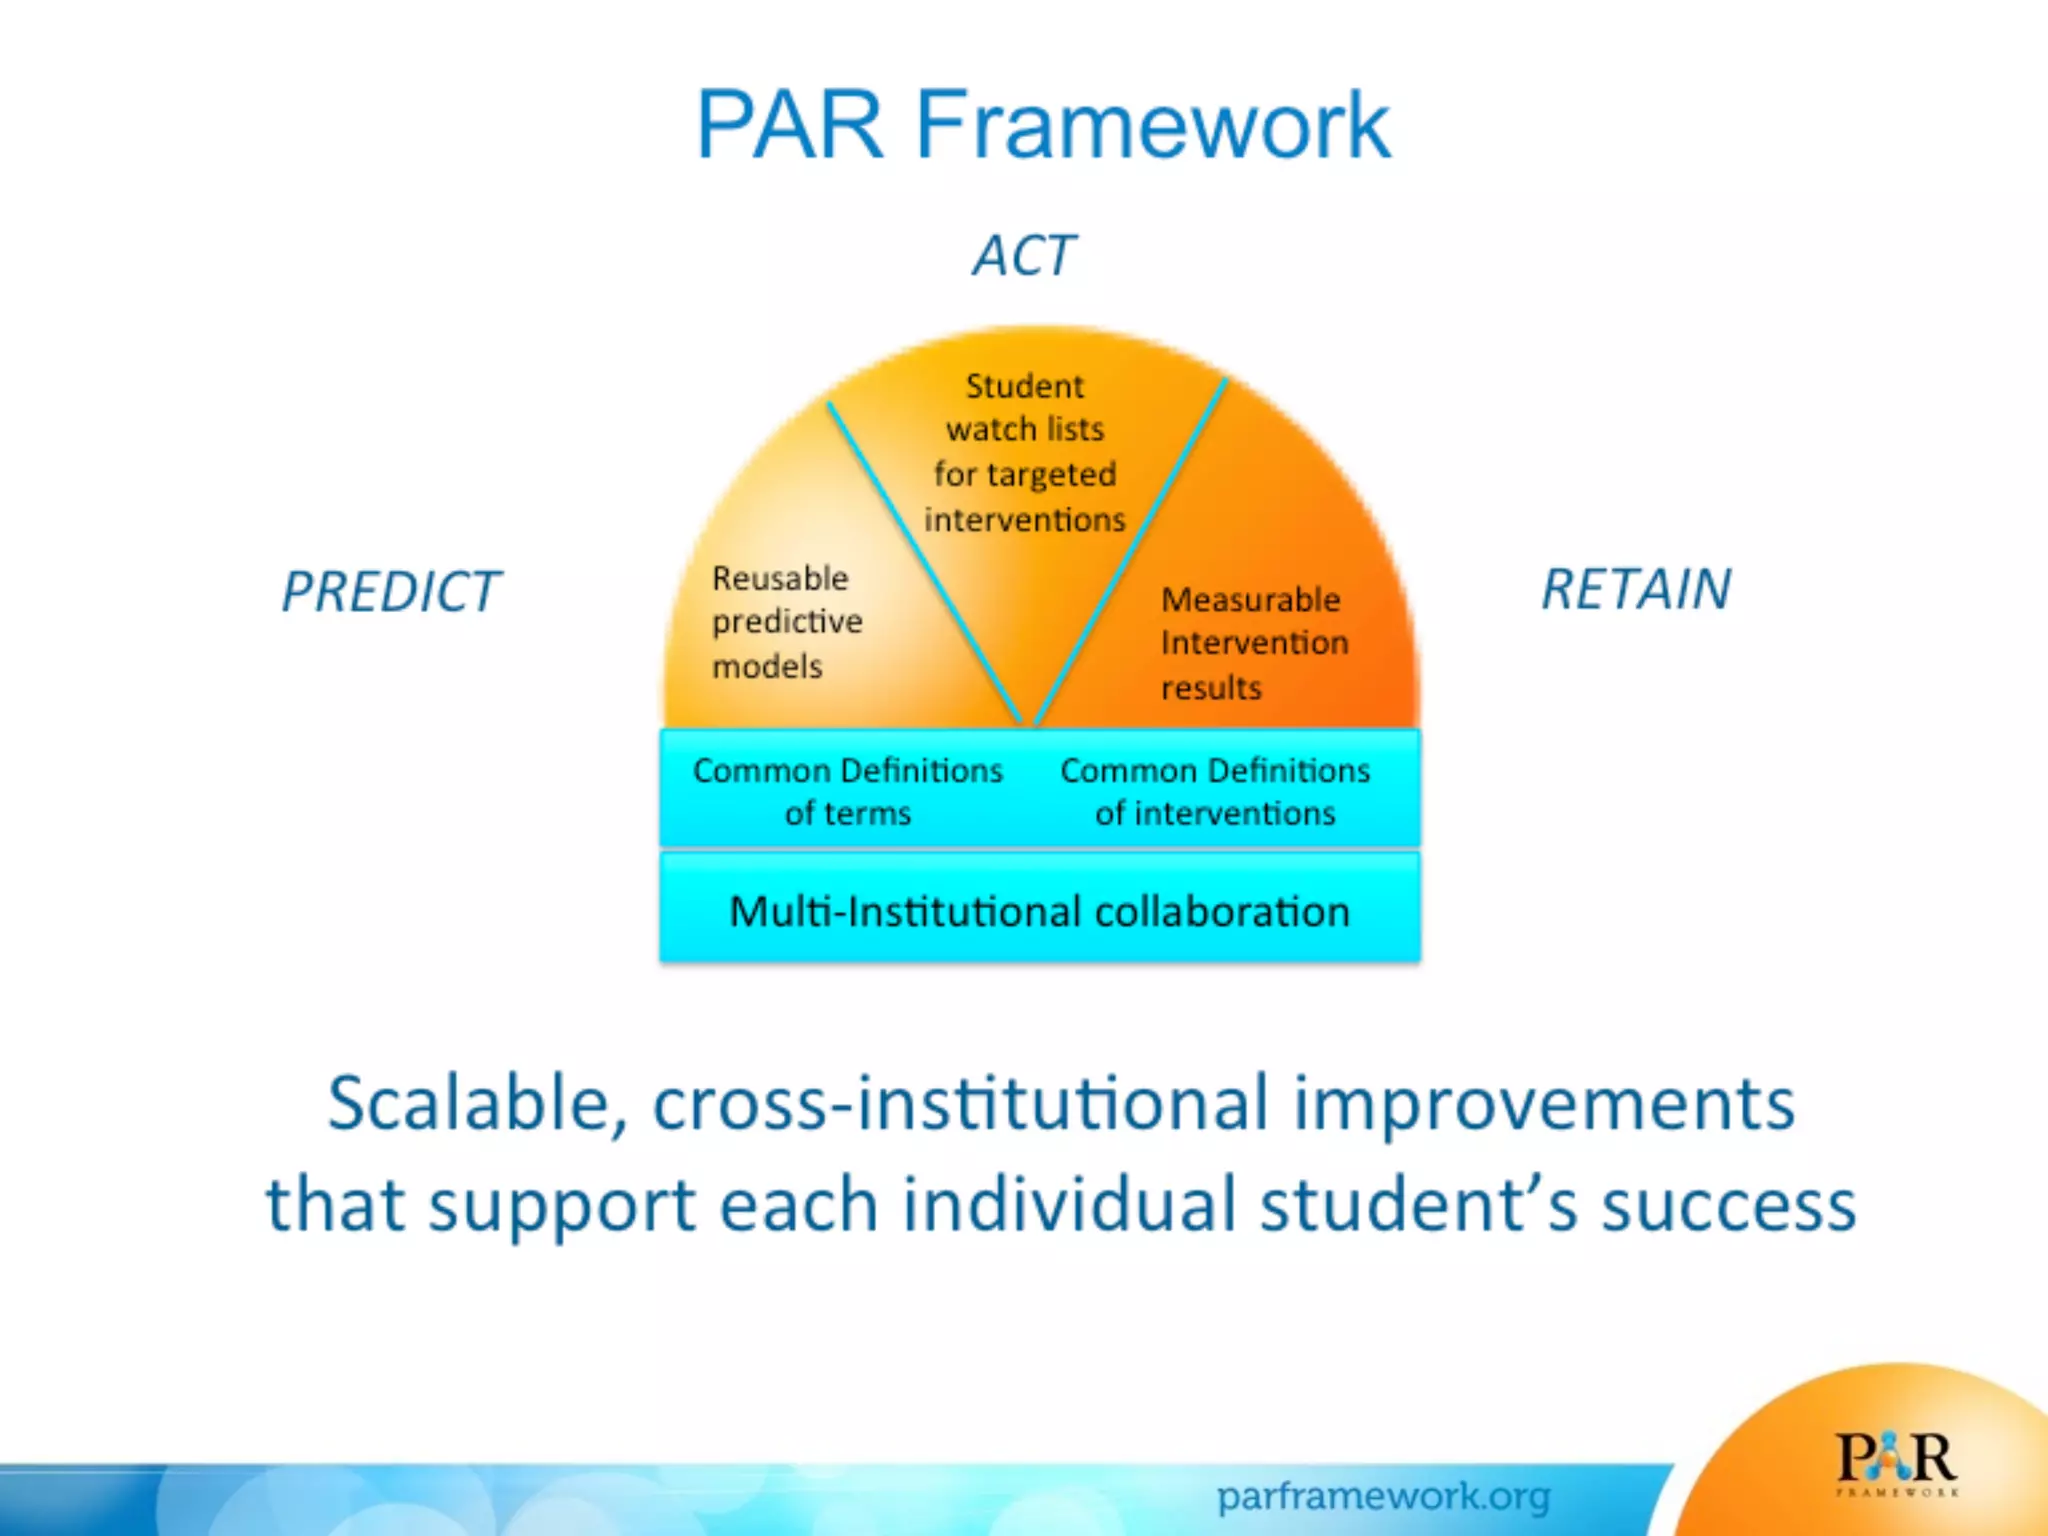
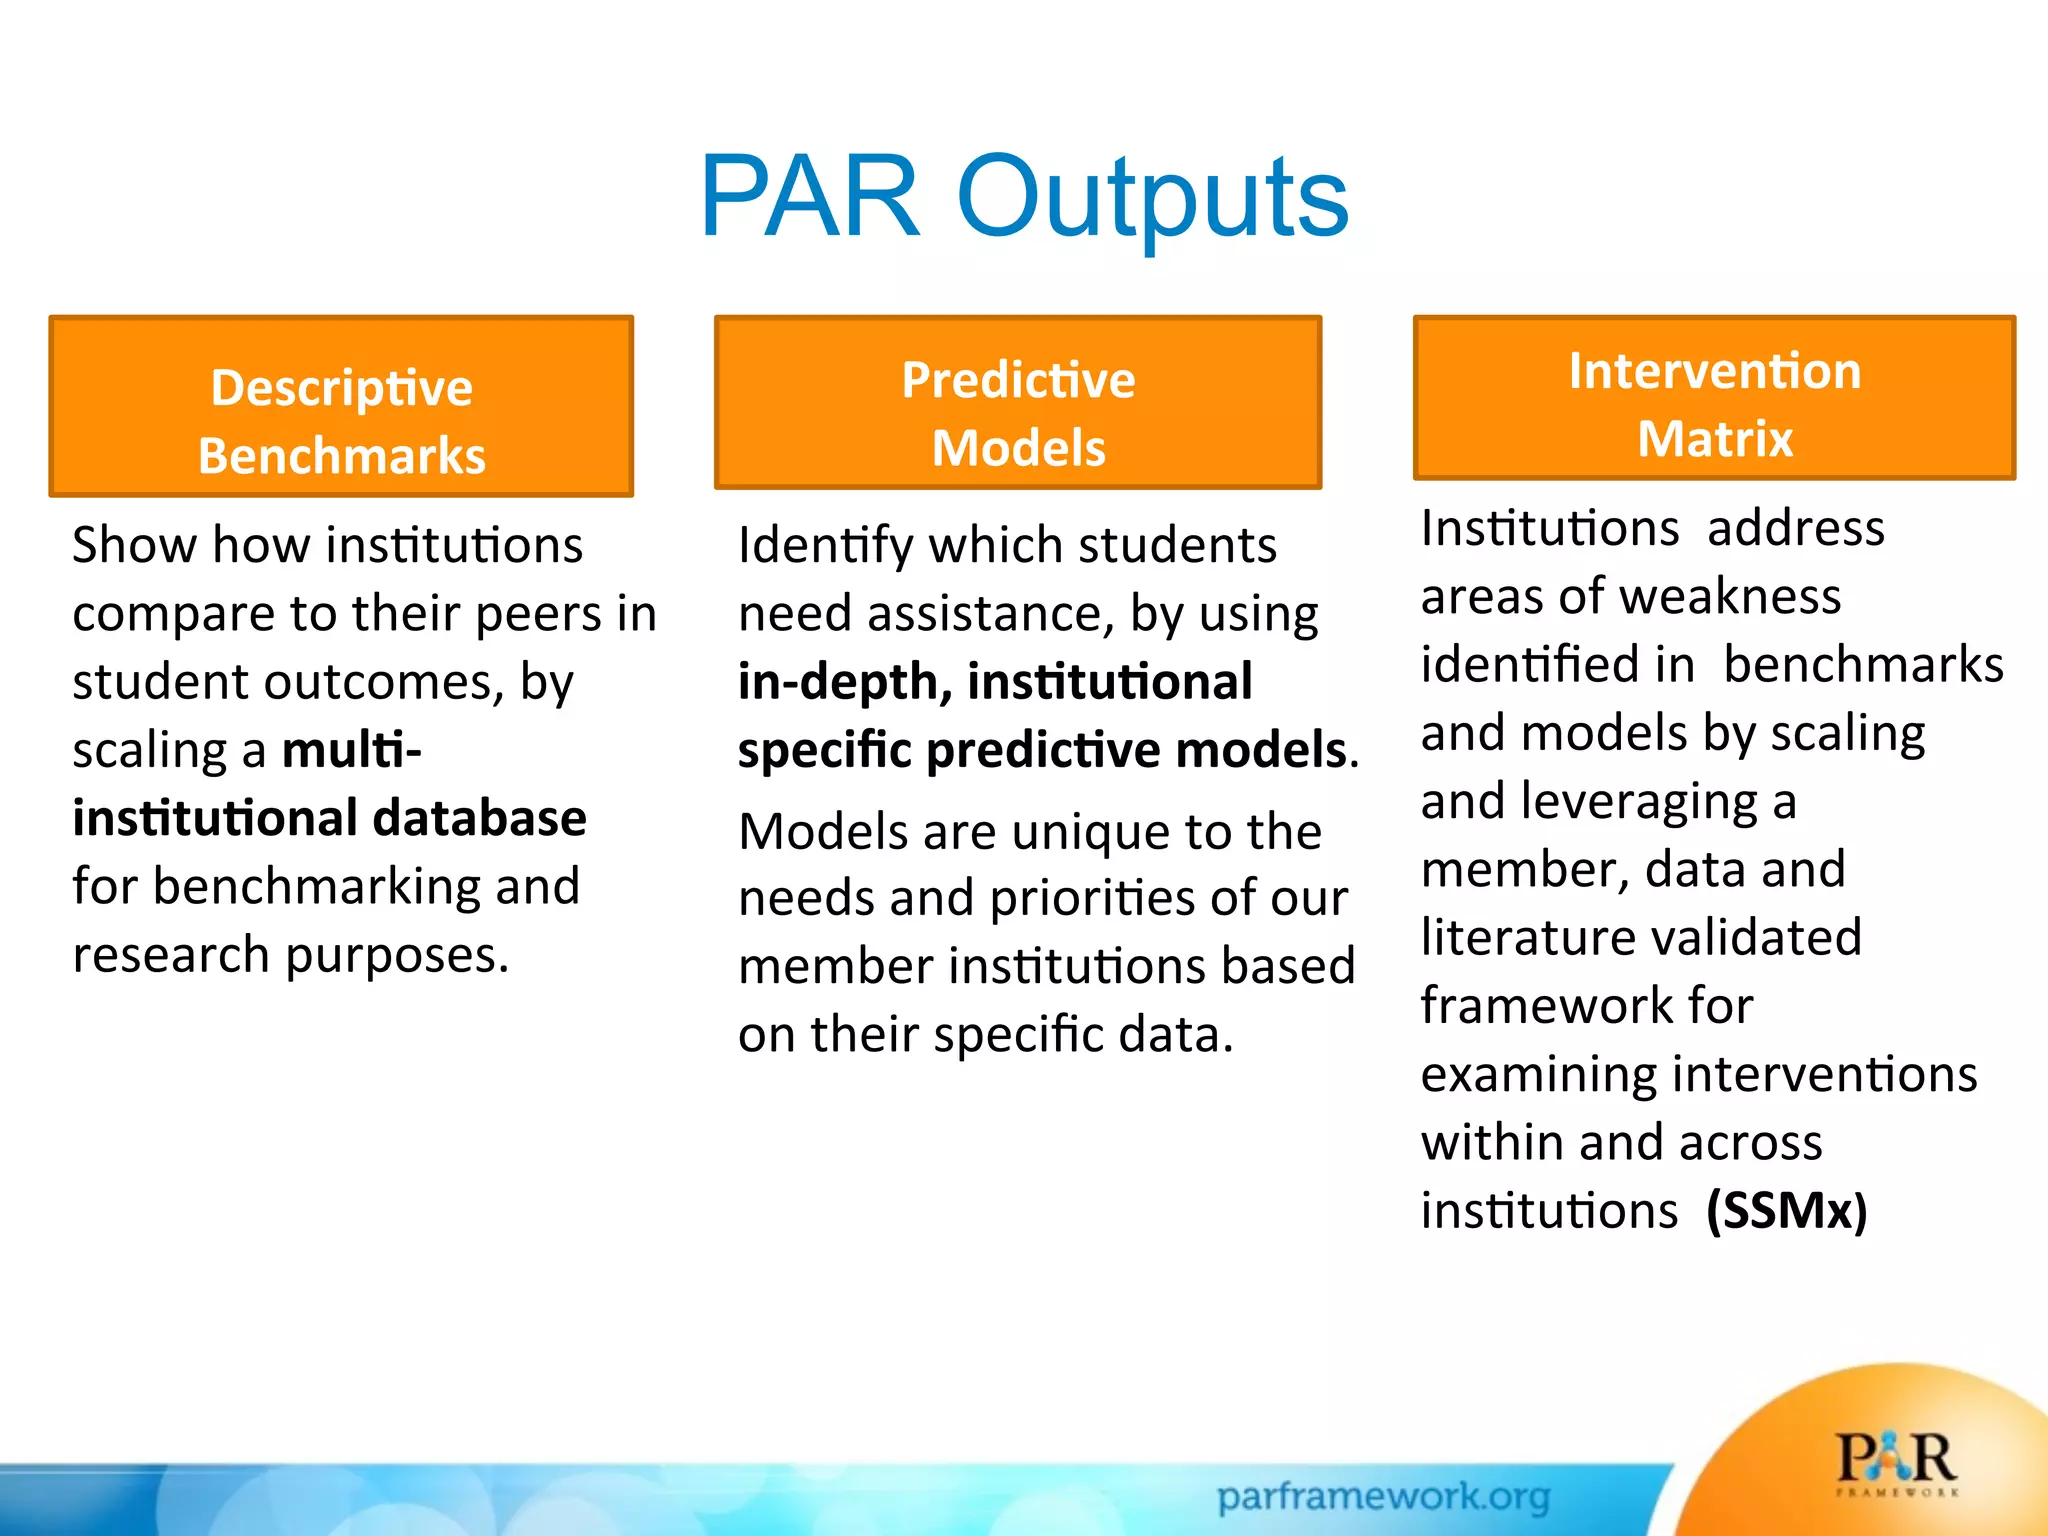
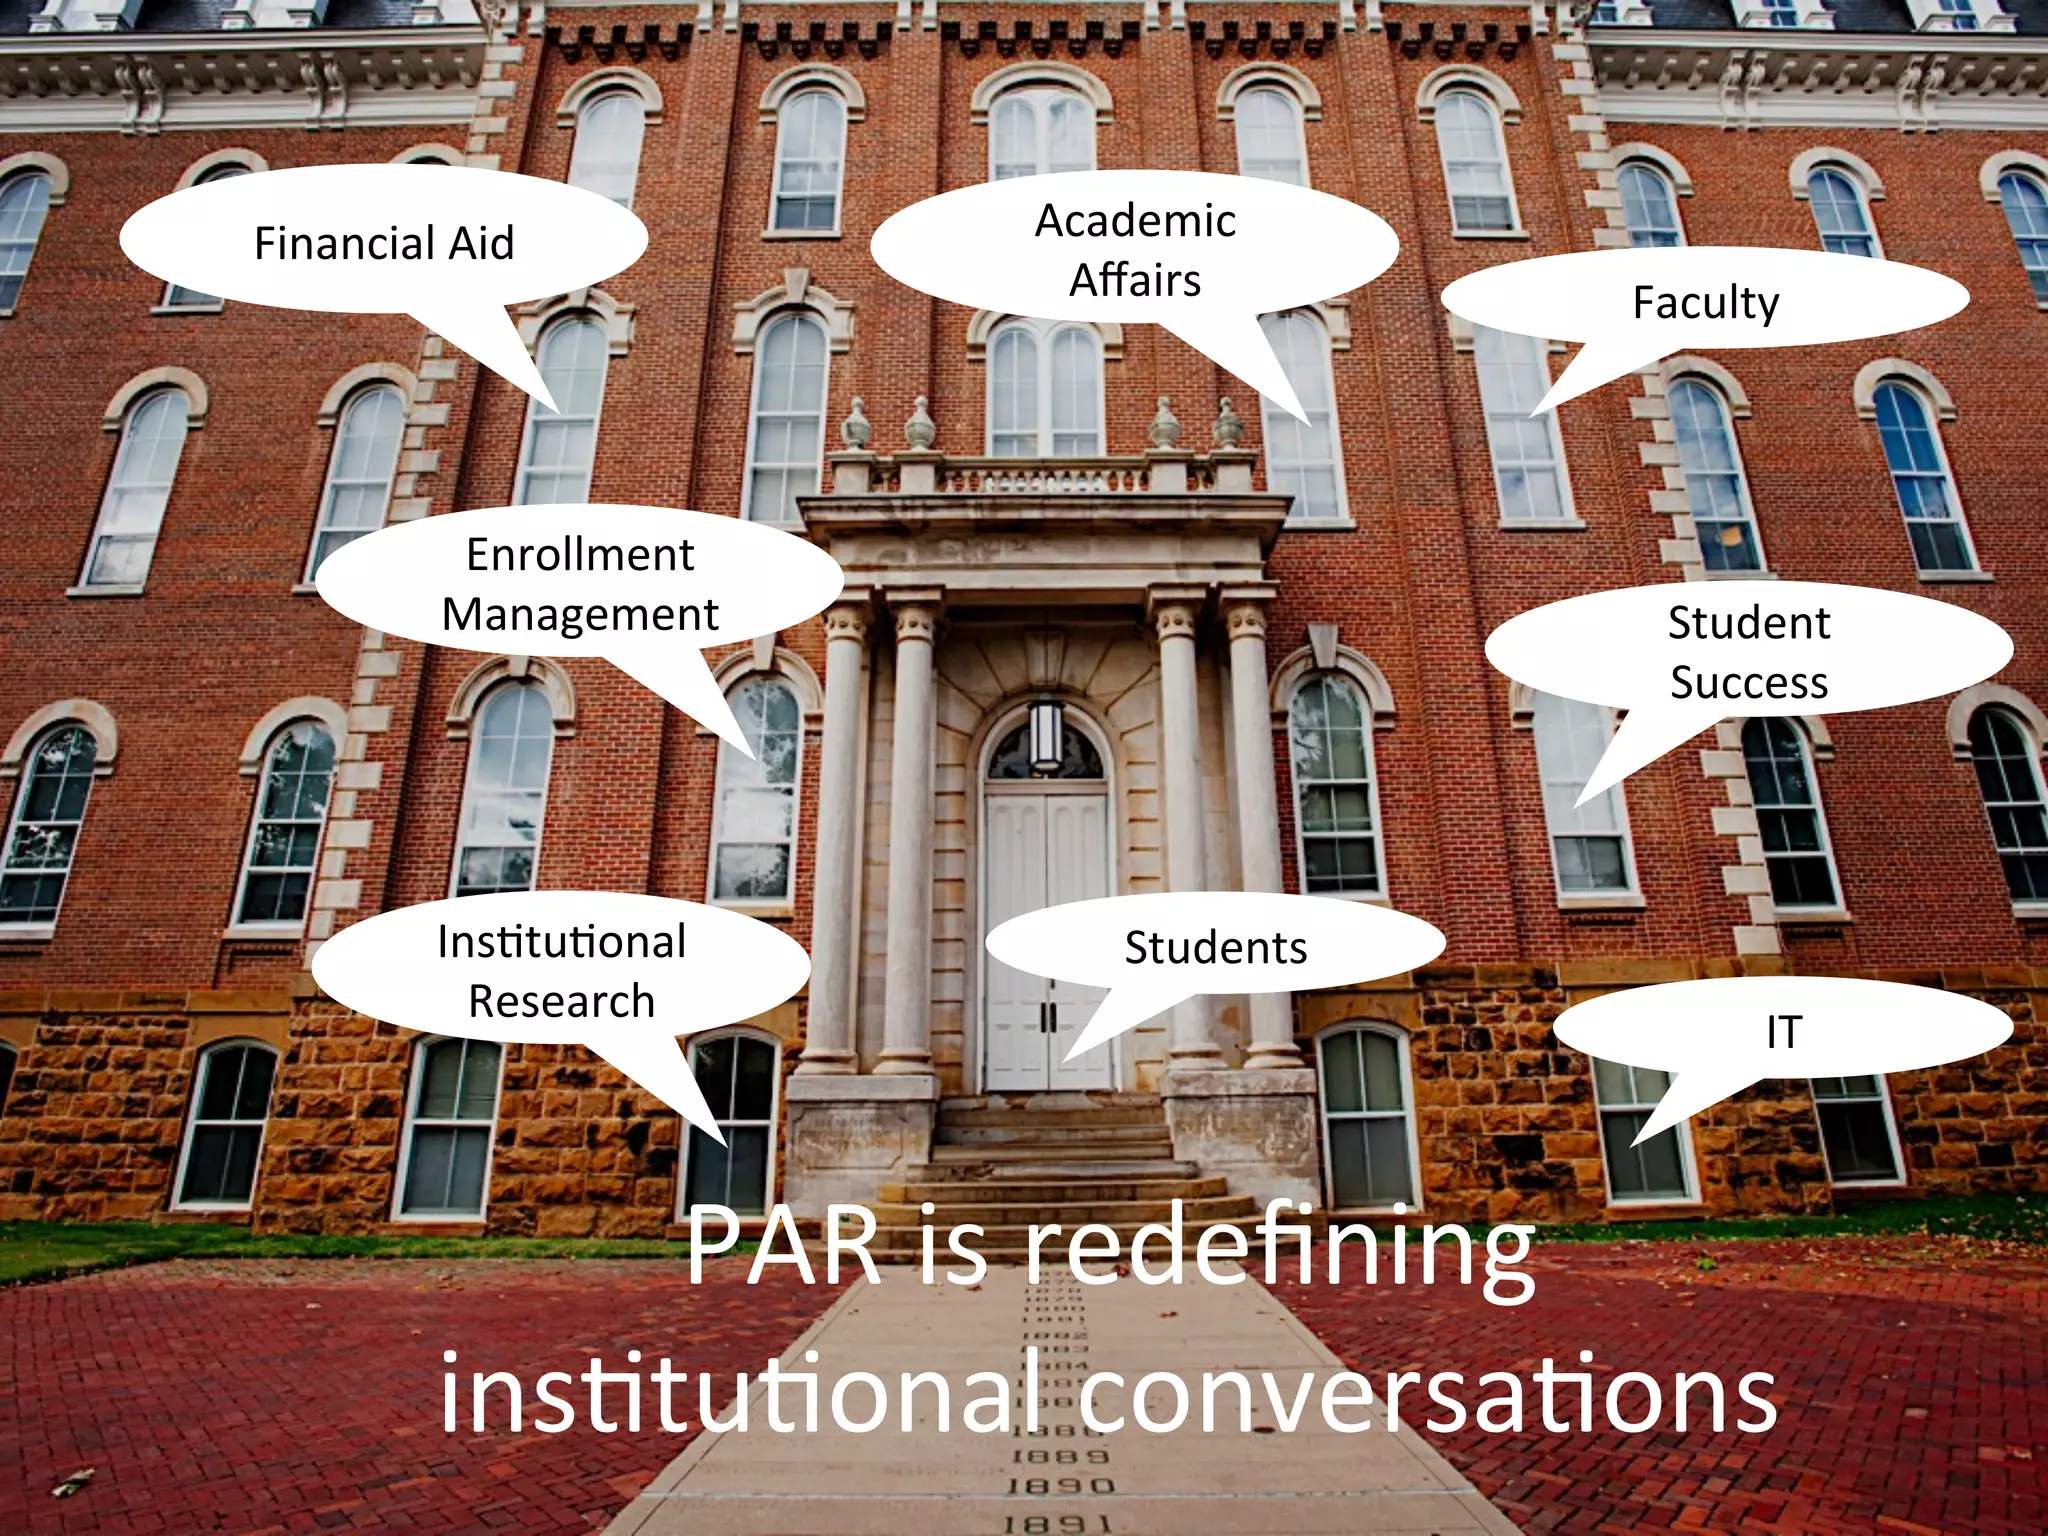

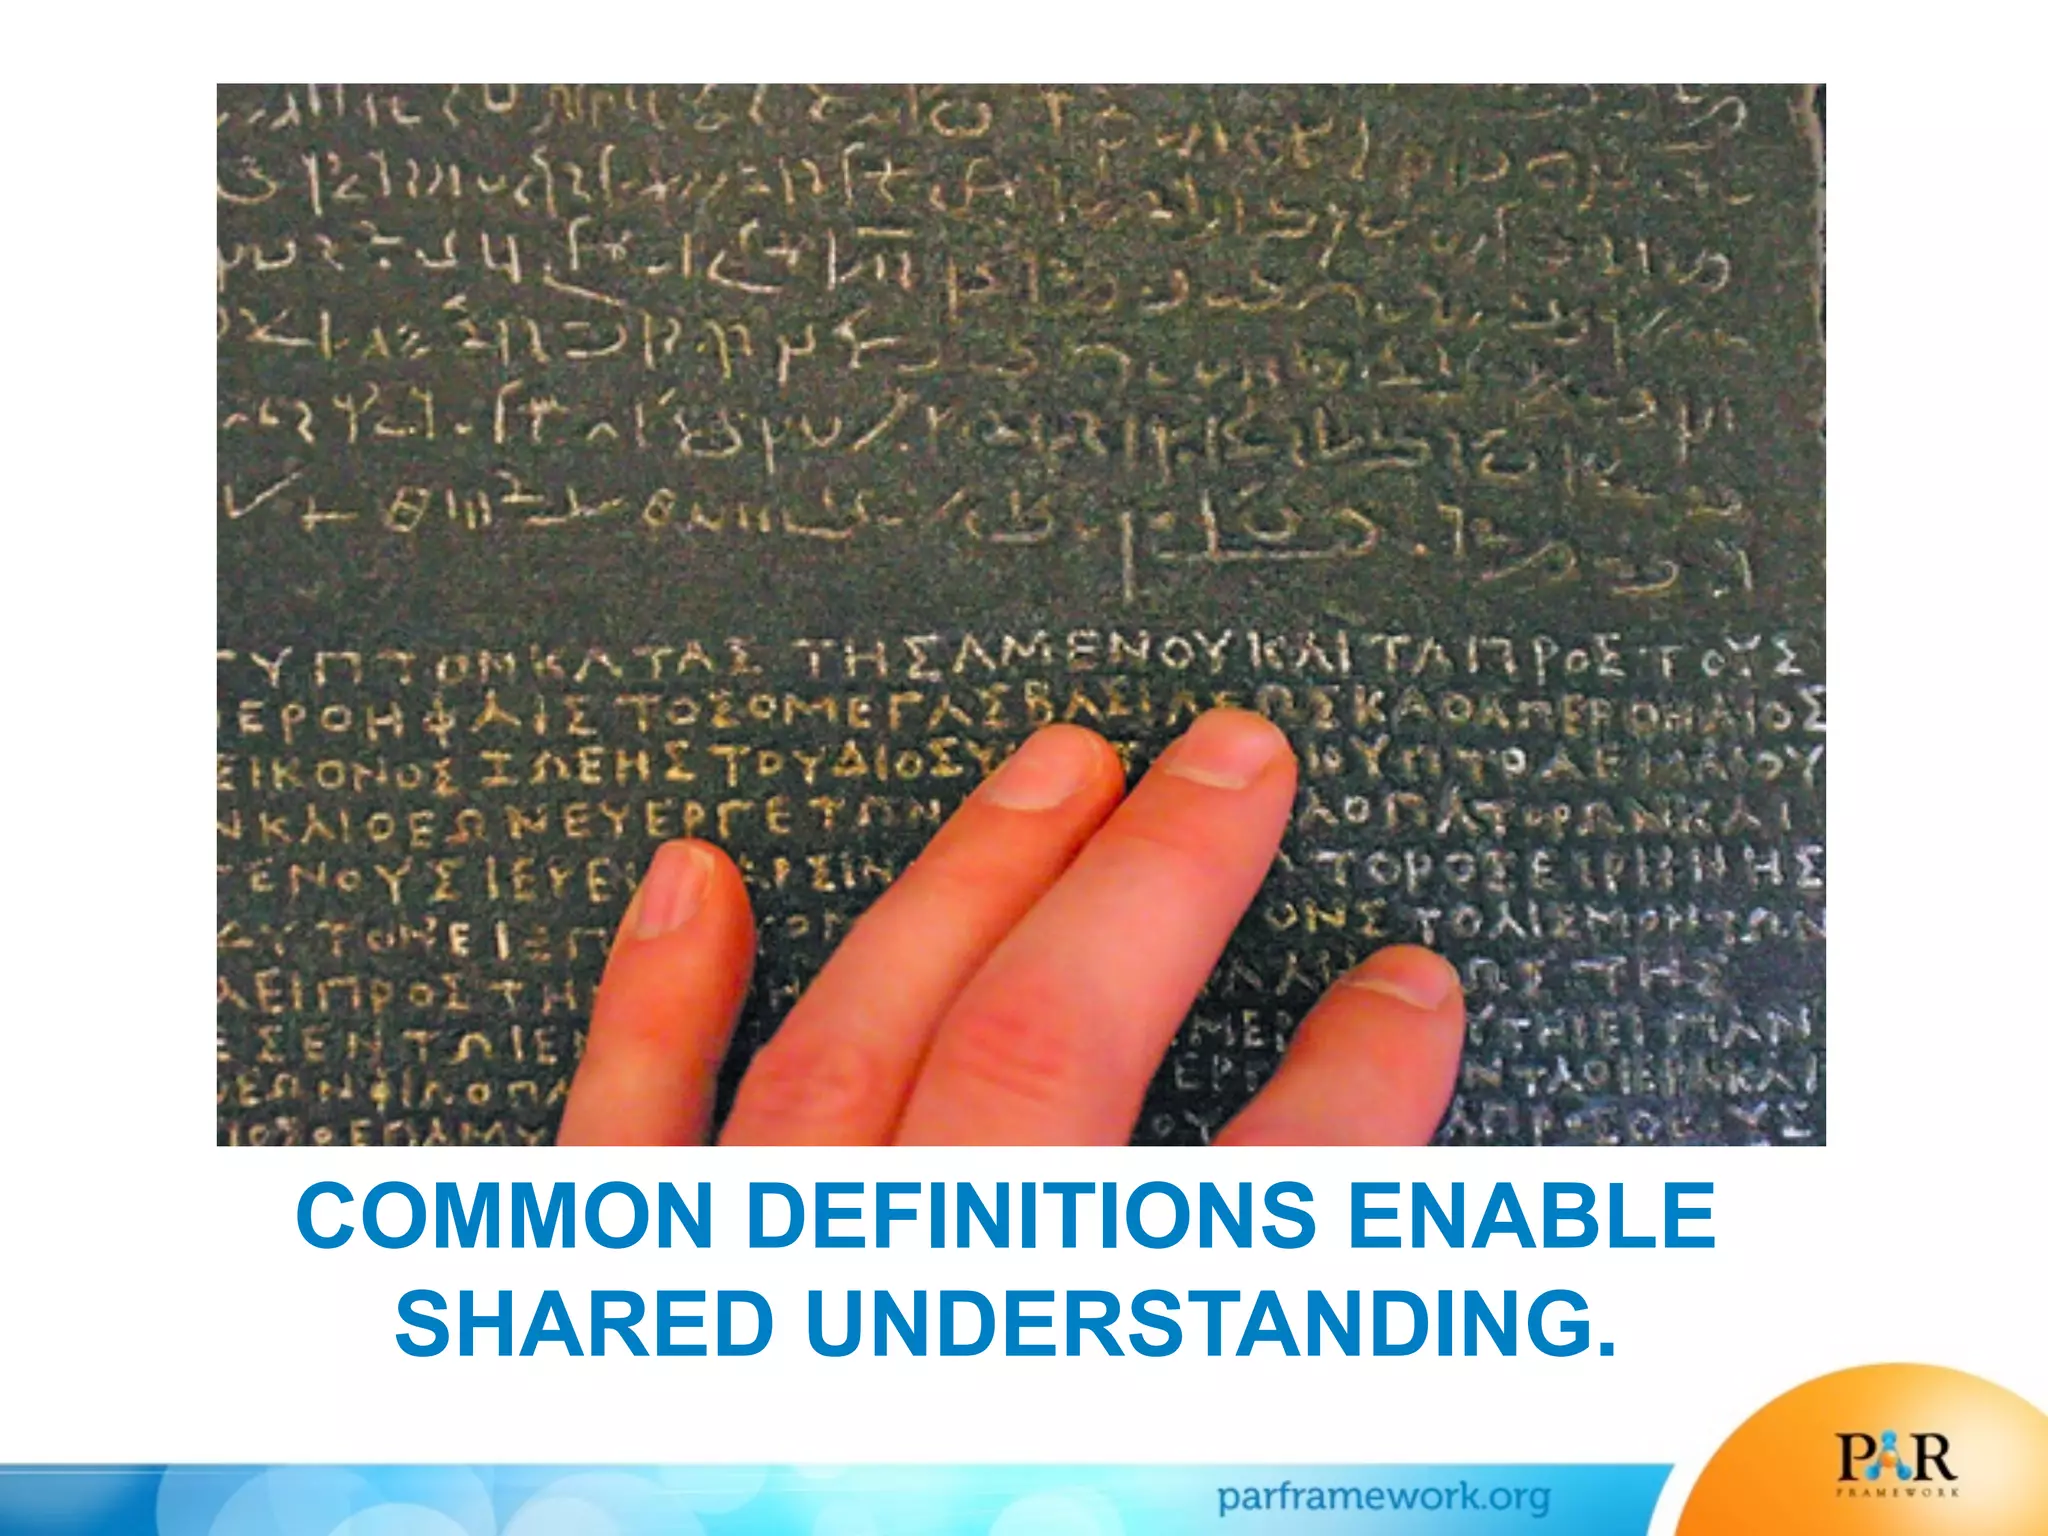

The document outlines five steps for achieving success with learning analytics: 1) Start with a focus on desired outcomes, 2) Clearly define what constitutes success, 3) Use common definitions to enable shared understanding, 4) Focus on generating insights from data rather than just collecting data, and 5) Share results and findings with others. It then provides more details on the Predictive Analytics Reporting (PAR) Framework, a collaborative focused on institutional effectiveness and student success using predictive analytics of integrated student data from member institutions.


