Appendix 2
•
0 likes•1,267 views

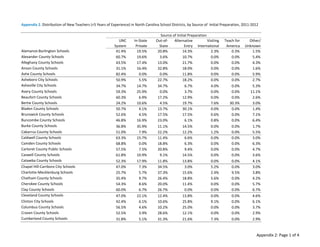
This document provides data on the source of initial teacher preparation for new teachers (those with less than 5 years of experience) in various North Carolina school districts for the 2011-2012 school year. It shows the percentage of new teachers in each district that were prepared through the UNC system, private NC institutions, out-of-state institutions, alternative entry programs, Teach for America, and other/unknown categories. The data is presented in a table with columns for each preparation source and rows for each individual school district.

Recommended
More Related Content
Similar to Appendix 2
Similar to Appendix 2 (16)
More from EducationNC
More from EducationNC (20)
Recently uploaded
Recently uploaded (20)
Appendix 2
- 1. UNC System In-State Private Out-of- State Alternative Entry Visiting International Teach for America Other/ Unknown Alamance-Burlington Schools 41.4% 19.5% 20.8% 14.3% 2.3% 0.3% 1.5% Alexander County Schools 60.7% 19.6% 3.6% 10.7% 0.0% 0.0% 5.4% Alleghany County Schools 43.5% 17.4% 13.0% 21.7% 0.0% 0.0% 4.3% Anson County Schools 31.1% 16.4% 32.8% 18.0% 0.0% 0.0% 1.6% Ashe County Schools 82.4% 0.0% 0.0% 11.8% 0.0% 0.0% 5.9% Asheboro City Schools 50.9% 5.5% 22.7% 18.2% 0.0% 0.0% 2.7% Asheville City Schools 34.7% 14.7% 34.7% 6.7% 4.0% 0.0% 5.3% Avery County Schools 59.3% 25.9% 0.0% 3.7% 0.0% 0.0% 11.1% Beaufort County Schools 60.3% 6.9% 17.2% 12.9% 0.0% 0.0% 2.6% Bertie County Schools 24.2% 10.6% 4.5% 19.7% 7.6% 30.3% 3.0% Bladen County Schools 50.7% 4.1% 13.7% 30.1% 0.0% 0.0% 1.4% Brunswick County Schools 52.6% 4.5% 17.5% 17.5% 0.6% 0.0% 7.1% Buncombe County Schools 46.8% 16.9% 23.0% 6.1% 0.8% 0.0% 6.4% Burke County Schools 36.8% 35.9% 11.1% 14.5% 0.0% 0.0% 1.7% Cabarrus County Schools 51.0% 7.9% 22.2% 12.2% 1.2% 0.0% 5.5% Caldwell County Schools 63.3% 15.7% 11.4% 6.6% 0.0% 0.0% 3.0% Camden County Schools 68.8% 0.0% 18.8% 6.3% 0.0% 0.0% 6.3% Carteret County Public Schools 57.5% 7.5% 20.8% 9.4% 0.0% 0.0% 4.7% Caswell County Schools 61.8% 10.9% 9.1% 14.5% 0.0% 0.0% 3.6% Catawba County Schools 52.3% 17.9% 11.8% 13.8% 0.0% 0.0% 4.1% Chapel Hill-Carrboro City Schools 47.0% 7.3% 34.5% 3.0% 5.2% 0.0% 3.0% Charlotte-Mecklenburg Schools 25.7% 5.7% 37.3% 15.6% 2.4% 9.5% 3.8% Chatham County Schools 35.4% 9.7% 26.4% 18.8% 5.6% 0.0% 4.2% Cherokee County Schools 54.3% 8.6% 20.0% 11.4% 0.0% 0.0% 5.7% Clay County Schools 60.0% 6.7% 26.7% 0.0% 0.0% 0.0% 6.7% Cleveland County Schools 47.0% 22.1% 12.4% 13.8% 0.0% 0.0% 4.6% Clinton City Schools 42.4% 6.1% 10.6% 25.8% 9.1% 0.0% 6.1% Columbus County Schools 56.5% 4.6% 10.2% 25.0% 0.0% 0.0% 3.7% Craven County Schools 52.5% 3.9% 28.6% 12.1% 0.0% 0.0% 2.9% Cumberland County Schools 31.8% 5.1% 31.3% 21.6% 7.3% 0.0% 2.9% Appendix 2. Distribution of New Teachers (<5 Years of Experience) in North Carolina School Districts, by Source of Initial Preparation, 2011-2012 Source of Initial Preparation Appendix 2: Page 1 of 4
- 2. Currituck County Schools 53.5% 2.3% 27.9% 4.7% 0.0% 0.0% 11.6% Dare County Schools 46.8% 2.1% 34.0% 17.0% 0.0% 0.0% 0.0% Davidson County Schools 46.7% 27.9% 8.7% 12.7% 0.0% 0.0% 4.0% Davie County Schools 56.7% 14.4% 11.1% 14.4% 1.1% 0.0% 2.2% Duplin County Schools 53.1% 6.3% 8.1% 25.0% 4.4% 0.0% 3.1% Durham Public Schools 40.3% 7.5% 32.2% 14.0% 0.2% 3.3% 2.6% Edenton-Chowan Schools 62.1% 6.9% 20.7% 10.3% 0.0% 0.0% 0.0% Edgecombe County Public Schools 44.2% 9.3% 24.8% 17.1% 0.0% 3.1% 1.6% Elkin City Schools 50.0% 25.0% 8.3% 16.7% 0.0% 0.0% 0.0% Forsyth County Schools 37.5% 20.3% 16.2% 17.6% 3.2% 0.0% 5.2% Franklin County Schools 36.9% 10.7% 32.2% 14.8% 0.0% 0.0% 5.4% Gaston County Schools 35.0% 16.3% 25.5% 16.0% 0.5% 0.0% 6.8% Gates County Schools 47.6% 9.5% 14.3% 23.8% 0.0% 0.0% 4.8% Graham County Schools 77.3% 0.0% 9.1% 4.5% 0.0% 0.0% 9.1% Granville County Schools 35.6% 8.5% 28.0% 16.1% 0.0% 10.2% 1.7% Greene County Schools 61.1% 5.6% 5.6% 13.0% 9.3% 0.0% 5.6% Guilford County Schools 42.5% 13.7% 15.4% 21.2% 1.9% 0.1% 5.1% Halifax County Schools 23.3% 3.3% 32.2% 7.8% 1.1% 27.8% 4.4% Harnett County Schools 27.3% 18.4% 26.8% 22.7% 2.0% 0.0% 2.8% Haywood County Schools 65.4% 8.7% 7.7% 13.5% 0.0% 0.0% 4.8% Henderson County Schools 36.2% 18.4% 26.5% 12.8% 0.0% 0.0% 6.1% Hertford County Schools 32.2% 22.0% 22.0% 22.0% 0.0% 0.0% 1.7% Hickory City Schools 44.0% 36.0% 6.7% 9.3% 0.0% 0.0% 4.0% Hoke County Schools 28.3% 4.2% 41.5% 23.8% 0.0% 0.0% 2.3% Hyde County Schools 38.5% 0.0% 30.8% 23.1% 0.0% 0.0% 7.7% Iredell-Statesville Schools 35.3% 14.4% 28.1% 15.1% 1.7% 0.0% 5.5% Jackson County Public Schools 71.6% 0.0% 12.2% 12.2% 0.0% 0.0% 4.1% Johnston County Schools 42.3% 11.7% 19.4% 18.2% 4.2% 0.2% 4.0% Jones County Schools 77.8% 5.6% 0.0% 16.7% 0.0% 0.0% 0.0% Kannapolis City Schools 47.1% 10.6% 28.2% 8.2% 0.0% 0.0% 5.9% Lee County Schools 38.3% 12.6% 34.5% 10.2% 2.4% 0.0% 1.9% Lenoir County Public Schools 54.5% 4.8% 15.0% 20.9% 1.1% 0.0% 3.7% Lexington City Schools 35.8% 22.4% 13.4% 23.9% 1.5% 0.0% 3.0% Lincoln County Schools 60.6% 13.5% 13.5% 7.1% 0.0% 0.0% 5.3% Macon County Schools 71.8% 0.0% 14.1% 10.3% 0.0% 0.0% 3.8% Appendix 2: Page 2 of 4
- 3. Madison County Schools 20.0% 42.0% 16.0% 16.0% 0.0% 0.0% 6.0% Martin County Schools 69.8% 7.5% 3.8% 13.2% 1.9% 0.0% 3.8% McDowell County Schools 41.2% 31.8% 5.9% 9.4% 4.7% 0.0% 7.1% Mitchell County Schools 44.4% 40.7% 7.4% 7.4% 0.0% 0.0% 0.0% Montgomery County Schools 32.8% 34.4% 11.5% 18.0% 0.0% 0.0% 3.3% Moore County Schools 27.6% 17.3% 33.5% 17.3% 0.0% 0.0% 4.3% Mooresville Graded School District 53.7% 13.0% 20.4% 7.4% 0.0% 0.0% 5.6% Mount Airy City Schools 46.7% 13.3% 6.7% 26.7% 6.7% 0.0% 0.0% Nash-Rocky Mount Schools 47.4% 16.5% 7.8% 21.7% 0.4% 3.0% 3.0% New Hanover County Schools 62.6% 3.7% 22.1% 7.1% 0.0% 0.0% 4.6% Newton Conover City Schools 42.3% 26.9% 11.5% 19.2% 0.0% 0.0% 0.0% Northampton County Schools 16.3% 7.0% 18.6% 16.3% 9.3% 27.9% 4.7% Onslow County Schools 41.0% 3.7% 42.0% 9.8% 0.6% 0.0% 2.9% Orange County Schools 52.5% 10.2% 26.3% 7.6% 0.0% 0.0% 3.4% Pamlico County Schools 66.7% 12.5% 4.2% 12.5% 0.0% 0.0% 4.2% Pasquotank County Schools 46.3% 1.9% 19.4% 25.0% 4.6% 0.0% 2.8% Pender County Schools 56.9% 3.3% 23.6% 14.6% 0.0% 0.0% 1.6% Perquimans County Schools 78.1% 6.3% 3.1% 9.4% 3.1% 0.0% 0.0% Person County Schools 48.4% 13.7% 20.0% 16.8% 0.0% 0.0% 1.1% Pitt County Schools 76.3% 2.2% 6.1% 12.5% 0.6% 0.0% 2.4% Polk County Schools 33.3% 16.7% 26.7% 20.0% 0.0% 0.0% 3.3% Randolph County School System 52.1% 15.3% 7.3% 20.8% 2.1% 0.0% 2.4% Richmond County Schools 35.0% 11.7% 19.0% 26.3% 3.6% 0.0% 4.4% Roanoke Rapids City Schools 45.8% 16.7% 12.5% 25.0% 0.0% 0.0% 0.0% Robeson County Schools 44.3% 2.1% 13.5% 36.5% 0.0% 0.0% 3.7% Rockingham County Schools 44.2% 20.1% 14.1% 17.6% 0.5% 0.0% 3.5% Rowan-Salisbury Schools 40.3% 22.5% 17.1% 15.6% 1.0% 0.0% 3.5% Rutherford County Schools 45.8% 15.0% 25.2% 13.1% 0.0% 0.0% 0.9% Sampson County Schools 41.6% 19.0% 7.3% 29.9% 0.0% 0.0% 2.2% Scotland County Schools 29.5% 8.9% 18.8% 41.1% 0.0% 0.0% 1.8% Stanly County Schools 31.8% 30.0% 10.0% 17.3% 0.0% 0.0% 10.9% Stokes County Schools 43.8% 24.7% 10.1% 13.5% 0.0% 0.0% 7.9% Surry County Schools 25.3% 38.9% 9.5% 21.1% 0.0% 0.0% 5.3% Swain County Schools 79.4% 5.9% 5.9% 5.9% 0.0% 0.0% 2.9% Thomasville City Schools 47.9% 18.8% 14.6% 16.7% 0.0% 0.0% 2.1% Appendix 2: Page 3 of 4
- 4. Transylvania County Schools 42.3% 19.2% 21.2% 13.5% 0.0% 0.0% 3.8% Tyrrell County Schools 46.7% 13.3% 13.3% 20.0% 0.0% 0.0% 6.7% Union County Public Schools 31.8% 11.1% 29.5% 18.9% 4.9% 0.2% 3.6% Vance County Schools 28.4% 8.6% 13.6% 27.2% 14.2% 4.9% 3.1% Wake County Schools 41.1% 11.7% 36.7% 7.7% 0.0% 0.2% 2.6% Warren County Schools 9.3% 5.6% 3.7% 24.1% 0.0% 53.7% 3.7% Washington County Schools 26.7% 3.3% 23.3% 16.7% 10.0% 16.7% 3.3% Watauga County Schools 76.1% 3.0% 16.4% 3.0% 0.0% 0.0% 1.5% Wayne County Public Schools 39.2% 7.2% 16.0% 28.2% 3.4% 0.0% 6.0% Weldon City Schools 33.3% 0.0% 4.8% 14.3% 0.0% 47.6% 0.0% Whiteville City Schools 50.0% 0.0% 15.0% 35.0% 0.0% 0.0% 0.0% Wilkes County Schools 69.3% 14.0% 7.8% 4.5% 1.7% 0.6% 2.2% Wilson County Schools 43.2% 16.5% 14.2% 23.9% 0.0% 0.0% 2.3% Yadkin County Schools 48.9% 18.9% 8.9% 16.7% 0.0% 0.0% 6.7% Yancey County Schools 31.0% 48.3% 6.9% 6.9% 0.0% 0.0% 6.9% Source: University of North Carolina General Administration, accessed March 2017, https://ung4.ondemand.sas.com/SASVisualAnalyticsViewer/guest.jsp?reportPath=/UNG/External+Content/Reports&reportName=TQD+Teacher+ Portals&appSwitcherDisabled=true&reportViewOnly=true. Appendix 2: Page 4 of 4