Session 2
Business Strategies based on Value Chain
Agenda
Opening case & Porter’s Value Chain hypothesis
Porter’s generic strategies framework
Cost leadership
Differentiation
Two views on Value Chain hypothesis
The Consistency View
The Blue Ocean View
Case
Video case: Nintendo Wii Blue Ocean strategy
The Blue Ocean that Disappeared – The Case of Nintendo Wii
Opening case
To offset its market share losses since 2008, Nestle has sought to aggressively promote linkages in the premium, luxury market – that has been immune to the recession and has been growing rapidly
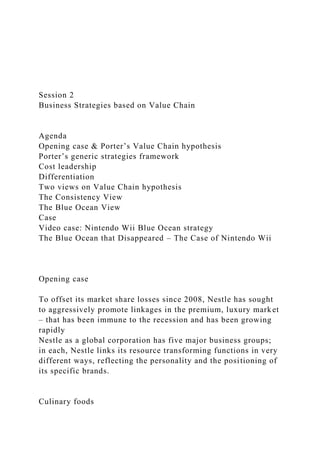
Nestle as a global corporation has five major business groups; in each, Nestle links its resource transforming functions in very different ways, reflecting the personality and the positioning of its specific brands.
Culinary foods
Maggi
Le Creazioni di Casa Buitoni
Beverages
Nescafe
Nespresso
Confecti-onary
Kitkat
Maisen Cailer
Milk products
Nutrition
Cerelac
Nestle Haagen Dazs
Babynes
Porter’s Value Chain hypothesis
According to Porter’s value chain hypothesis, the primary links among the resource transforming functions should be sequenced as a chain, i.e. design, produce, market, deliver and support (Porter, 1985)
Value chain analysis helps to evaluate effectiveness of a firm in different functions
Strategies for manipulating value linkages for improving strategic advantage of a business are referred to as the “Business-level strategies”
Design
Production
Marketing
Support
Delivery
The Value Chain hypothesis
In Porter’s framework, the functions in a firm’s value chain are grouped into two broad categories of activities: primary and secondary
Primary activities are directly involved in transforming inputs into outputs and in delivery and after-sales support
inbound logistics
Support activities are involved in supporting primary activities
procurement
service—installation, usage guidance, maintenance, parts, and returns
operations
outbound logistics
marketing and sales
technology development
human resource management
firm infrastructure—general management, planning, finance, accounting, legal, government affairs and quality management
Porter’s generic strategies framework
Generic Sources of Strategic Advantage in Value Chains
One of the major purposes of Porter’s framework is to explicate two generic sources of strategic advantage for the businesses of a firm.
Value
Cost
If customers perceive a product or service as superior, they are willing to pay a premium relative to the price they will pay for competing offerings
If a firm gains a cost advantage for performing activities in its value chain at a cost lower than its major competitors, then it has flexibility to undercut competitors and offer greater value for money
Two views on Value Chain hypothesis
There are two views on this hypothesis:
Contingency view
The firms that make consistent, persistent and dedicated investments in.
Session 2 Business Strategies based on Value ChainAg.docx
1. Session 2
Business Strategies based on Value Chain
Agenda
Opening case & Porter’s Value Chain hypothesis
Porter’s generic strategies framework
Cost leadership
Differentiation
Two views on Value Chain hypothesis
The Consistency View
The Blue Ocean View
Case
Video case: Nintendo Wii Blue Ocean strategy
The Blue Ocean that Disappeared – The Case of Nintendo Wii
Opening case
To offset its market share losses since 2008, Nestle has sought
to aggressively promote linkages in the premium, luxury market
– that has been immune to the recession and has been growing
rapidly
Nestle as a global corporation has five major business groups;
in each, Nestle links its resource transforming functions in very
different ways, reflecting the personality and the positioning of
its specific brands.
Culinary foods
2. Maggi
Le Creazioni di Casa Buitoni
Beverages
Nescafe
Nespresso
Confecti-onary
Kitkat
Maisen Cailer
Milk products
Nutrition
Cerelac
Nestle Haagen Dazs
3. Babynes
Porter’s Value Chain hypothesis
According to Porter’s value chain hypothesis, the primary links
among the resource transforming functions should be sequenced
as a chain, i.e. design, produce, market, deliver and support
(Porter, 1985)
Value chain analysis helps to evaluate effectiveness of a firm in
different functions
Strategies for manipulating value linkages for improving
strategic advantage of a business are referred to as the
“Business-level strategies”
Design
Production
Marketing
Support
4. Delivery
The Value Chain hypothesis
In Porter’s framework, the functions in a firm’s value chain are
grouped into two broad categories of activities: primary and
secondary
Primary activities are directly involved in transforming inputs
into outputs and in delivery and after-sales support
inbound logistics
Support activities are involved in supporting primary activities
procurement
service—installation, usage guidance, maintenance, parts, and
returns
operations
outbound logistics
5. marketing and sales
technology development
human resource management
firm infrastructure—general management, planning, finance,
accounting, legal, government affairs and quality management
Porter’s generic strategies framework
Generic Sources of Strategic Advantage in Value Chains
One of the major purposes of Porter’s framework is to explicate
two generic sources of strategic advantage for the businesses of
a firm.
Value
Cost
If customers perceive a product or service as superior, they are
willing to pay a premium relative to the price they will pay for
competing offerings
If a firm gains a cost advantage for performing activities in its
6. value chain at a cost lower than its major competitors, then it
has flexibility to undercut competitors and offer greater value
for money
Two views on Value Chain hypothesis
There are two views on this hypothesis:
Contingency view
The firms that make consistent, persistent and dedicated
investments in “value” differentiation or “cost” leadership, are
likely to generate stronger and more sustainable competitive
advantage
Blue Ocean View
A strategy built on an integrated approach will position the firm
in strategically advantageous uncontested space
The Consistency View of Value Chain hypothesis
is based on three implicit assumptions:
Knowledge processes/ routines assumption
7. The firms who strategically concentrate all their investments in
either cost reduction or in differentiation are likely to develop
deep, strong knowledge processes, or routines, to undergird
their competitive advantage, as compared to those who strive to
do both
Motivational processes/ culture assumption:
The firms who strategically strive to promote either cost
reduction or differentiation only are likely to develop deep,
strong motivational processes, or culture, to undergird their
competitive advantage
The firms who strategically position themselves as capable of
cost reduction or differentiation are likely to develop deep,
strong reputation, or credibility, to undergird their competitive
advantage
Reputational processes/ credibility assumption
The Consistency View of Value Chain hypothesis
The Consistency View offers a typology of two pure business
strategies, based on the two generic sources of strategic
advantage:
8. 9
Differentiation strategy
The strategy involves making a fairly standardized product,
combined with aggressive underpricing all rivals (Porter, 1980:
36)
The strategy involves offering superior product features to
customers
Cost leadership strategy
The Consistency View of Value Chain hypothesis
There are three different sub-hypotheses on the relationship
between differentiation and cost leadership strategies:
Lifecycle hypothesis
At different phases of product and organizational lifecycles,
changing conditions enable change in generic strategies and the
firms who embrace this change outpace their competitors
(Gilbert & Strebel, 1989)
Singularity hypothesis
Both cost reduction and value addition are integral to any
9. business strategy, and are not distinct but singular, i.e. cost is
one variable in the overall differentiation strategy
Mutually-exclusive hypothesis
Porter (1980: 38) asserts that a firm must make a choice among
generic strategies, otherwise it will become “stuck in the
middle.” (Porter, 1985: 11)
The Consistency View of Value Chain hypothesis
There are three different sub-hypotheses on how generic
strategies are related to firm performance:
Differentiation hypothesis
Some scholars assert that the firms using differentiation
strategy in a market outperform those using a cost-leadership
strategy
Equivalency hypothesis
Contingency hypothesis
Porter (1980: 35) asserts that cost leadership and differentiation
strategies offer an equally successful and profitable path to
strategic advantage. This may be true in a highly cyclical
economic environment
10. Firms from different nations may have different capabilities for
differentiation vs. cost leadership advantage
The Consistency View of Value Chain hypothesis
Risks of Pure Business Strategies
Research shows a lack of support for the Consistency view in
highly dynamic and turbulent markets – here the firms that
focus on only differentiation or cost leadership may not be as
successful because of the risks from the following three risk
factors:
Risks
Risks of diminishing returns: as one invest more and more in
one objective, incremental benefits become less and less.
Risks of diminishing demand: as one invests more and more in
one objective, it becomes less attractive for a broader group.
Risks of competitive interplay: as one gains dramatic cost or
value edge over rivals, new rivals emerge to capture a share of
the market.
The Consistency View of Value Chain hypothesis
Benefits of a Hybrid Business strategy
11. In highly dynamic markets, the success of the firms pursuing a
hybrid strategy, based on the integration of the linkages for
differentiation or cost leadership, may be attributed to the
following three factors:
Benefits
Benefits of increasing demand
Benefits of increasing returns
Benefits of competitive priorities
The Blue Ocean View of Value Chain hypothesis
Kim and Mauborgne (2005) characterize cut-throat target
markets as ‘Red oceans’, where the sharks compete mercilessly.
To succeed in dynamic environments, the firms need to pursue a
blue ocean strategy, taking an integrated approach aimed at not
killing the competition, but rather to make the competition
irrelevant
Blue ocean strategy refers to the creation by a firm of a new,
uncontested market space that makes competitors irrelevant and
that creates new consumer value often while decreasing costs.
It focuses less on competitors, but more on alternatives. It also
focuses less on existing customers, but more on non-customers,
or potential new customers
The Blue Ocean View of Value Chain hypothesis
The four actions framework for Blue Ocean Strategy
12. Alternate target customers,
with alternate value factors
Reduce:
What factors should be reduced well below the industry
standard?
Create:
What factors should be created that the industry has never
offered?
Raise:
What factors should be raised well above the industry standard?
Eliminate:
What factors should be eliminated from what the industry has
taken for granted?
The Blue Ocean View of Value Chain hypothesis
The four actions framework for Cirque du Soleil
Cirque du Soleil adopted the blue ocean strategy using a hybrid
focus approach; it helped the company gain a significant
strategic advantage and grow very rapidly by redefining circus
Eliminate
Start Performers
Animal Shows
13. Aisle concession sales
Multiple show arenasRaise
Unique venueReduce
Fun and humor
Thrill and dangerCreate
Theme
Refined watching environment
Artistic music and dance
Strategy Canvas for Cirque du Soleil
Reduce
Raise
Create
Cirque du SoleilStar peformersAnimal showsAisle
concessionsMultiple show arenasFun and humorThrills and
dangerUnique venueThemeRefined watching
environmentArtistic music and dancePrice00006699998Smaller
Regional circusStar peformersAnimal showsAisle
concessionsMultiple show arenasFun and humorThrills and
dangerUnique venueThemeRefined watching
environmentArtistic music and
dancePrice68867720003Strongest National CircusStar
peformersAnimal showsAisle concessionsMultiple show
arenasFun and humorThrills and dangerUnique
venueThemeRefined watching environmentArtistic music and
dancePrice89988830004
The Blue Ocean View of Value Chain hypothesis
Using Bricolage for constructing Blue Ocean Value Chains
Bricolage offers a useful perspective for constructing blue
ocean value chains in fast-changing competitive environments
Bricolage means using whatever available resources as the
inputs into a creative process
A classic example of Bricolage is the printing press. As noted in
14. the Wall Street Journal, “The printing press is a classic
combinatorial innovation. Each of its key elements—the
movable type, the ink, the paper and the press itself—had been
developed separately well before Johannes Gutenberg printed
his first Bible in the 15th century.” (Johnson, 2010). Gutenberg
made use of the available materials to develop a printing press
The Blue Ocean View of Value Chain hypothesis
Limitations of Traditional Value Chain Analysis
It takes a static view of both capabilities and markets, and thus
contributes to the commodification of the functions, by
promoting similarities in what firms do.
It ignores the opportunities for broader network relationships
that might shape several inter-related activities.
Video case: Nintendo Wii Blue Ocean strategy
Case: The Blue Ocean that Disappeared – The Case of Nintendo
Wii
The case evaluates the ‘‘turning points’’ and the timing of
Nintendo’s strategies in transforming a Red Ocean to a Blue
Ocean, and back again
With the launch of Nintendo Wii in 2006, the company created a
Blue Ocean by offering a unique gaming experience to previous
non-customers and at the same time keeping the cost of its
15. system lower than Sony’s and Microsoft’s. Wii became a market
leader by emphasizing its simplicity and lower price (compared
to Sony and Microsoft) to break down barriers for new
customers
Case: The Blue Ocean that Disappeared – The Case of Nintendo
Wii
The competitors’ reaction to Nintendo’s Wii – launch of similar
devices:
In response Nintendo releases the new Wii U in 2012 in an
attempt to differentiate its new console and create a “Blue
Ocean” again. However, if the original Wii represented a shift
away from the hardcore gaming market, the
Wii U signals a movement back towards the hardcore gaming
market space
This case underlines that the Blue Ocean strategy cannot be a
static process (Kim and Mauborgne, 2005).
Nintendo must create a dynamic strategy in order to stay in the
Blue Ocean and not to allow turning it into a Red Ocean again
Sony PlayStation Move
Kinect for Xbox 360
16. Veteran Status and Material Hardship: The Moderating
Influence of Work-Limiting Disability
Colleen M. Heflin University of Missouri
Janet M. Wilmoth Syracuse University
Andrew S. London Syracuse University
Veterans are a sizable and policy-relevant demographic group in
the United States, yet little is known about their economic well-
being. Although having a work-limiting disability is known to
be associated with material hardship, no known study compares
material hardship between veteran households and nonveteran
households or investigates whether work-limiting disability
moderates the association between veteran status and material
hardship. This study uses data from the Survey of Income and
Program Participation to examine how householdwork-
limitingdisabilitystatusmoderatestherelationshipbetween veteran
status and the likelihood of material hardship. Results suggest
the following: nondisabled-veteran households report lower or
equivalent levels of material hardship than do households with
no veteran or disabled member; regardless of whether a veteran
is present, households that include a disabled person have
higher levels of every type of hardship than other households
do; and disabled-veteran households experience statistically
significantly more hardship than nondisabled-veteran
households do.
Little is known about the economic well-being of veteran
households despite the fact that they constitute a sizable and
policy-relevant demographic group in the United States
(USCensusBureau2009;Burland and Lundquist, forthcoming).
This is surprising because emerging research documents that
veteran status is associated with increases in rates
PAGE 120
of functional limitation and disability over the life course
(Dobkin and Shabani 2009; MacLean 2010; Wilmoth, London,
and Parker 2010, 2011). So too, having a work-limiting
17. disability is positively associated with poverty and material
hardship (Mayer and Jencks 1989; Fujiura, Yamaki, and
Czechowicz 1998; She and Livermore 2007; Rose, Parish, and
Yoo 2009). In fact, Bonnie O’Day and Marcie Goldstein’s
(2005) analysis identifies the effect of poverty among people
with disabilities as an overarching theme in key informant
interviews with disability advocacy and research leaders;
however, none of those key informants specifically mentions
that addressing the needs of disabled veterans is a top priority.
Few studies of disability and economic hardship measure
participants’ veteran status. One recent study documents a large
and negative association between disabled-veteran status and
income, such that income is estimated to be statistically
significantly lower for disabled veterans
thanforpersonswithoutdisabilitiesandfornonveteranswithdisabilit
ies (Fulton et al. 2009).
Another recent study demonstrates that house hold level
veteran and work-limiting disability statuses are jointly
associated with household poverty status (London, Heflin, and
Wilmoth 2011). Poverty and various material hardships are
conceptually distinct and only modestly correlated (Mayer and
Jencks 1989, 1993; Mayer 1995; Beverly 2001; Boushey et al.
2001; Bradshaw and Finch 2003; Heflin, Sandberg, and Rafail
2009). Researchers increasingly focus on the experience of
material hardship net of household income (Iceland and Bauman
2004; She and Livermore 2007; Heflin and Iceland 2009), but
the authors are aware of no study that focuses on experiences of
material hardship among veteran and comparable nonveteran
households. Nor does any known study consider whether the
presence of a household member with a work-limiting disability
moderates the risk for material hardship in veteran households.
This is a surprising omission in the literature given that
veterans are eligible for an array of federal cash and noncash
benefits, many of which are tied to service-related disability
(Wilmoth and London 2011). Thus, households that include
veterans may have lower levels of material hardship than
18. comparable nonveteran households do, regardless of whether
any household member has a work-limiting disability. This
article uses pooled data from five waves of the Survey of
Income and Program Participation (SIPP; 1992, 1993, 1996,
2001, and 2004 panels) to examine variation in the likelihood of
household-level
materialhardshipbyveterananddisabilitystatuses.Specifically,itex
amines the extent to which having a household member with a
work-limiting disability moderates the relationship between
having an adult household member who is a veteran and the
experience of each of four types of material hardship: home
hardship, medical hardship, bill-paying hardship, and food
insufficiency. The analysis takes into account household
PAGE 121
income-to-needs ratios and various household-level
demographic characteristics.
Relevant Literature
The Well-Being of Veterans in the United States
In 2009, over 21.9 million Americans were veterans. They
represent approximately 9.5 percent of those ages 18 years or
older (US Census Bureau 2009). Experience with military
service is particularly prevalent
amongcohortsofmenages65andolder.In2000,therewere9.4million
male veterans (65 percent) in that age group, many of whom
served in World War II and the
KoreanWar(FederalInteragencyForumonAgingRelatedStatistics2
010).Althoughratesofexperiencewithmilitaryservice have
declined in cohorts that came of age during the Vietnam War
and the All-Volunteer Force (AVF) era, which began in 1974, a
substantial portion of the working-age population served in the
military: as of 2010, veterans accounted for 4 percent of the
population ages 25–44 and for 11 percent of the population ages
45–64 (Wilmoth and London 2011). The effect of military
service on subsequent human capital development and
socioeconomic attainment receives sustained attention in the
literature (MacLean and Elder 2007; Bennett and McDonald,
19. forthcoming; Kleykamp, forthcoming). By paying close
attention to different historical and policy periods, these studies
provide insight into the possible complexity of the relationship
between military service and material well-being. Considerable
evidence suggests that large numbers of World War II veterans
took advantage of the generous GI Bill benefits to enhance their
education beyond what they would have attained without
military service (Bound and Turner 2002; Turner and Bound
2003; Mettler 2005).
Yet, research that considers the effect of military service and
the use of benefits on educational outcomes in other historical
periods finds that veterans from the Cold War (MacLean 2005),
the Vietnam War era (Teachman 2004, 2005; Teachman and
Call 1996), and the AVF era (Teachman 2007) have lower
educational attainments than nonveterans do. These findings
might be due to increases in the educational attainment of the
nonveteran population, changes in the availability of GI Bill
benefits, and declines in the value of such benefits during the
latter half of the twentieth century. Other research focuses on
occupational and income components of socioeconomic
attainment and again provides mixed evidence that depends
upon individual and historical specificities. Studies suggest that,
compared with nonveterans from the same period, veterans from
World War II did not experience higher earnings or substantial
occupational gains; there is one exception: officers converted
their service into postwar occupational advancement (Angrist
and Krueger 1994; Dechter and
PAGE 122
Elder 2004). Studies focusing mostly on Vietnam War–era
veterans suggest that military service in a war zone and combat
exposure are adversely associated with labor market experiences
and negatively associated with earnings (Angrist 1990). In part,
findings on the earnings of Vietnam War–era veterans may be
attributable to post-traumatic stress disorder and other
psychiatric disorders, as Vietnam veterans who meet the
diagnostic criteria for those conditions are less likely to be
20. working and, if working, have lower wages than comparable
Vietnam veterans who do not meet those criteria (Savoca and
Rosenheck 2000).
There is also evidence that military service substantially
decreases accumulated net worth among veterans relative to that
among nonveterans, although the magnitude of this effect varies
with length of service (Fitzgerald 2006). In contrast, some
studies suggest that military service has positive effects on
socioeconomic outcomes (SampsonandLaub1996). Earnings
among African American and other, nonwhite World War II
veterans (Teachman and Tedrow 2004) and also among AVF-era
veterans are higher than those among their nonveteran
counterparts (Angrist 1998). This provides evidence that
military service can produce a positive turning point in the
earnings trajectories of initially disadvantaged men (see also
Elder 1986; Xie 1992). In addition, men from disadvantaged
backgrounds who served during the AVF era are found to earn
more than their civilian counterparts, but the difference in
earnings dissipates after the service members are discharged
(Teachman and Tedrow 2007). Although research pays a
substantial amount of attention to whether, how, and for whom
military service affects human capital development and
socioeconomic attainment, no known study specifically
compares material hardship outcomes among veterans and
nonveterans.
Perhaps this is due in part to the assumption that current and
former military personnel are unlikely to experience material
hardships because they are eligible for and use benefits provided
by the US Department of Veterans Affairs. Through the direct
distribution of cash and noncash resources, such benefits can
enhance human capital development. These benefits also
directly subsidize housing, health care, and income. Yet,
evidence from the 1 percent sample of the 2000 US Census
suggests that a substantial percentage of veterans (8.4 percent)
live in poverty, even though they are less likely than
nonveterans to do so (London and Wilmoth 2008). In an
21. analysis based on SIPP data, the authors (London et al. 2011)
find that households with nondisabled veterans are less like to
be in poverty than are households whose members include no
veterans or disabled people; however, this advantage diminishes
if the veteran is disabled or shares the household with an adult
family member who has a work-limiting disability. This
suggests that veteran status interacts with disability status in
ways that could also affect material hardship. Also, a
substantial additional percentage of the veteran population
likely lives near poverty, and this puts them at risk for
PAGE 123
Material hardship. Veterans ‘experiences of material hardship
may differ from those of nonveterans because nonveterans lack
access to veterans benefits and services (Goodman and Stapleton
2007; US Department of Veterans Affairs 2009a, 2009b;
Wilmoth and London 2011).1
Disability Status as a Moderator of Veteran Status Although
selection into military service may alter the risk of material
hardship, a potential treatment effect of military service (or
direct effect of program participation) is that veterans are more
likely to be disabled than nonveterans are (Dobkin and Shabani
2009; MacLean 2010; Wilmoth et al. 2010, 2011). Military
personnel are initially selected for their good health and
functioning (National Research Council 2006), but military
service carries a risk of injury and exposure to circumstances,
such as combat, training-related accidents, interpersonal
violence, substance abuse, and stress-related mental health
problems, that increase the likelihood of having a functional
limitation or disability (Elder and Clipp 1988, 1989; Clipp and
Elder 1996; Bedard and Descheˆnes 2006; Dobkin and Shabani
2009; MacLean 2010). Exposure to these servicerelated risks
may therefore distinguish veteran households from nonveteran
households. They also may distinguish households that include
veterans with disabilities from those that include nondisabled
veterans. Under some circumstances, military service can
disrupt the life course by interfering with established marital,
22. parenting, and occupational trajectories (Teachman, Call, and
Wechsler 1993; Elder, Shanahan, and Clipp 1994; Tseng et al.
2006). Although trajectories vary by gender, race, ethnicity,
social class origins, active-duty status, rank, combat exposure,
and historical period, some evidence suggests that veterans have
higher rates of divorce than nonveterans do (Burland and
Lundquist, forthcoming; London, Allen, and Wilmoth, forth
coming)
.To the extent that military service causes interference and
instability in marriage and life-course trajectories, it might
impede veterans’ access to social and economic resources or
contribute to lifestyles that ultimately increase their risk of
functional limitation or disability. Previous research suggests
that poor health and the presence of a work-limiting disability
respectively increase the risk of material hardship (Mayer and
Jencks 1989; Bauman 1998; Corcoran, Heflin, and Siefert 1999;
Heflin, Corcoran, and Siefert 2007; She and Livermore 2007;
Parish, Rose, and Andrews 2009). In the study closest to the
current one, Peiyun She and Gina Livermore (2007) use data
from the 1996
PAGE 124
panel of the SIPP to demonstrate that individuals with some
type of disability compose a large share of the population
reporting material hardship (49–62 percent depending on the
hardship domain). The risk of material hardship among
households that include a disabled person is likely due in part to
that person’s limited employment, but the care work performed
by nondisabled household members can impede their labor force
participation and suppress household income (Cancian and
Oliker 2000; London, Scott, and Hunter 2002; Pavalko and
Henderson 2006). Few studies focus on care work in veteran
households, although care for veterans with disabilities can
require long-term commitment due to the debilitating nature of
some combat-related injuries (Resnik and Allen 2007). A recent
study finds that the majority of wounded veterans’ caregivers
experience relatively long spells of intense care work; this
23. group provides care for about 10 hours per week for an average
of 19 months, and 43 percent report that they expect to continue
providing long-term care (Christensen et al. 2009). Such care
work demands contribute to losses in time spent on paid
employment and, thus, could increase the risk of material
hardship. This article extends the previous literature on the
economic wellbeing of policy-relevant groups by documenting
how levels of material hardship vary by veteran and disability
statuses. It then examines the extent to which disability status
moderates the relationship between veteran status and each of
four specific material hardships. Previous research identifies
links between military service and disability as well as between
disability and hardship. By considering these links, the current
study seeks to address an important gap in the literature.
Method
Sample and Procedures
To examine the relationships among veteran status, disability
status, and each of four distinct types of material hardship, this
research uses data from the 1992–2004 panels of the SIPP, a
nationally representative household survey conducted in the
United States by the US Census Bureau. Each interview in the
panel consists of a core interview and a topical module
interview. The core interview poses standard questions on
demographics, labor force participation, and income. The
topical module interview includes questions on topics that
change from one interview wave to the next. Interview waves
are conducted every 4 months. Data on material hardship come
from the Adult Well-Being Topical Module, which was fielded
in one wave of each panel from 1992 to 2004: the third wave of
the 1992 SIPP panel (collected October 1992
throughJanuary1993);then in the wave of the1993 SIPP
panel(collected October 1995 through January 1996); the eighth
wave of the 1996 SIPP
24. PAGE 125
panel (collected August through November 1998); the eighth
wave of the 2001 SIPP panel (collected June through September
2003); and the eighth wave of the 2004 SIPP panel (collected
June through September 2005). If survey weights are used,
results from analyses of SIPP data are representative of the
civilian (nonveteran and veteran), noninstitutionalized
population of the United States. Imputed data are used as
provided by the US Census Bureau. The maximum analytic
sample includes 58,686 individuals across all waves; as the
notes to table 1 indicate, some models are estimated on slightly
smaller samples because of missing values on the hardship
questions. Although veteran and disability statuses are
measured at the individual level, material hardship is a
household-level indicator. Individual-level analysis is likely to
understate the associations among veteran status, work-limiting
disability status, and the measured material hardships, because
many nonveteran and able-bodied individuals share households
with veterans and the disabled. Thus, all analyses are conducted
at the household level.
Measures
This study incorporates established principles for the
measurement of material hardship (Beverly 2001; Ouellette et
al. 2004) into models that are based upon four domains of
material need: home hardship, medical hardship, bill-paying
hardship, and food insufficiency. It utilizes a number of
dichotomous indicators from the SIPP instrument designed for
this purpose. The measure of home hardship indicates whether,
in the 12 months prior to the survey, a member of the
respondent’s household reportedly had a problem with the
following: pests; a leaky roof or ceiling; broken windows;
plumbing issues; or cracks in the walls, floor, or ceiling.
Medical hardship indicates that a member of the respondent’s
household reportedly was not able to see a doctor or a dentist
when he or she needed to do so in the 12 months prior to the
survey. Bill-paying hardship measures respondents’ reports of
25. whether, in the 12 months prior to the survey, the household
experienced any of three events: the household was behind on a
utility, rent, or mortgage payment; the telephone was
disconnected; or other essential expenses were not met. The
food insufficiency measure is based on the following question:
“Which of the following statements best describes the food
eaten in your household in the last 12 months: enough to eat,
sometimes not enough to eat, or often not enough to eat?” The
responses “sometimes” and “often not enough to eat” are coded
as food insufficient. The measure of veteran status is based on
whether a member of a household self-reports that he or she
ever served on active duty (yes p 1). Work-limiting disability
(hereafter disability) is defined as the presence of a member of
the household with physical, mental, or other
PAGE 126
condition that limits the kind or amount or work that can be
performed (yes p 1). The SIPP poses this question to persons
ages 16 or older. Household-level interaction terms are created
to capture different possible combinations of disability and
veteran statuses: disabled veteran present; nondisabled veteran
present; disabled nonveteran present; and nondisabled veteran
with disabled nonveteran present. These four household types
are compared with all households in which no household
member is either disabled or a veteran.2 The measure of
disability likely underestimates the presence of disability among
household members who are over age 65. These individuals are
more likely than the general working-age population to be out
of the labor force and therefore more likely to report functional
limitations and disabilities other than a work-limiting disability.
Thus, the analytic sample for the main models excludes
households that include adults ages 65 years and older
(households with adults in that age range make up 25 percent of
all households in the total sample).
Supplementaryanalysesestimateidenticalmodelsonthetotalsample
ofhouseholds, and the results are consistent with those from the
models estimated on the analytic sample that only includes
26. households without
adultsages65orolder.Supplementaryanalysesalsosuggestthat,amo
ng households with a working-aged member and at least one
working-aged veteran, 25 percent include a veteran who served
in or after May 1974 (the start of the AVF era), 39 percent
include a veteran who served between August 1964 and April
1974 (the Vietnam War era), 17 percent served before August
1964 (most likely during the Cold War or the Korean War), and
14 percent served across multiple time periods.3 The study
includes controls for a variety of household-level demographic
characteristics that are known to be associated with material
hardship.Theseincludethefollowing:theratiooftheannualhousehol
d income to the federal needs standard for a household of that
size (the income-to-needs ratio); the racial and ethnic
composition of the household (black only, Hispanic only, Asian
only, and other and mixed races or ethnicities; white-only
households comprise the reference group); the highest level of
education achieved by a household member (high school
diploma, some college, college degree; the comparison group
haslessthanahighschooldiploma);themaritalstatusofthehousehold
er (never married or previously married, which includes
divorced, widowed, or separated respondents; married
respondents comprise the reference group); whether the
household includes children younger than age 18
PAGE 127
(yes p 1); and whether the household is located in an urban area
(yes p 1).
Data Analysis
After describing the sample and the prevalence of each of the
four material hardships overall, this study presents the
proportion of households reporting each hardship. The typology
is employed to distinguish households with respect to the work-
limiting-disability and veteran statuses of all adult household
members. Then, logistic regression models are employed to
assess statistical significance using Stata statistical software
(version 10.1). By including dichotomous variables for each
27. year, the study effectively adjusts for the changes in material
hardships over the 14-year period.4 All analyses employ sample
weights. Predicted probabilities for the main variables of
interest are calculated in models that hold all other observed
characteristics at their mean values. In addition, supplementary
analyses test for statistically significant differences in the point
estimates for each household type, which is defined by the
veteran and disability statuses of adult household members.
Statistically significant differences are reported in the tables
and text.
Results
Table 1 shows descriptive statistics for all of the variables
included in the analysis. The first row specifies the prevalence
of each form of material hardship in the analytic sample.
Among the four domains of material hardship, bill-paying
hardship is reportedly the most common (19.39 percent). About
12 percent of households are reported to experience medical
hardship; home hardships and food insufficiency are relatively
rare experiences, with respondents in approximately3percent of
all households’ report experiencing these. The first column of
table 1 presents the sample characteristics. In the left-most
column, the first five household disability- and veteran-status
categories represent the key independent variable in this
analysis. The largest share of households, over two-thirds,
includes neither a veteran nor a disabled household member;
13.67 percent of households reportedly include a nondisabled
veteran, and 13.27 percent of households include a disabled
nonveteran. Less than 3 percent of all households include a
disabled veteran, and only 1.21 percent are classified as
nondisabled-veteran households with a disabled-nonveteran
member.
PAGE 128
28. PAGE 129
PAGE 130
Almost three-quarters of the households include whites only;
12.03 percent include blacks only, 8.58 percent include
Hispanics only, 2.40 percent include Asians only, and 5.14
percent include persons of other and mixed races and
ethnicities. The distribution of highest educational attainment in
the household ranges from 7.65 percent (less than high school
education) to 34.14 percent (a college degree or higher). One
fourth of households include a member who graduated from
high school, and 33.2 percent include one who has some
college. About 40 percent of householders report that they are
married (40.44 percent), though sizable percentages report that
they are previously married (38.21 percent) and never married
(21.35 percent). About 42 percent of households reportedly
include at least one minor child. The mean income-to-needs
ratio is 3.86, and supplementary analysis (not shown) suggests
that almost 14 percent of sampled households live at or below
the poverty threshold. About 82 percent of households live in
urban areas. Table 1 also shows the percentage of household
types reporting each of the four domains of material hardship.
Several patterns emerge regarding variation in material hardship
across the veteran- and disability status categories. First,
reports of all forms of material hardship are lowest among
nondisabled-veteran households: 1.26 percent report home
hardship, 6.86 percent report medical hardship, 10.46 percent
report bill-paying hardship, and 1.19 percent report food
insufficiency. Rates of arterial hardship are relatively low
29. among households in which no member is a veteran or disabled,
although they are somewhat higher than rates among
nondisabled-veteran households. Rates of each type of material
hardship are reportedly highest among disabled-nonveteran
households: 6.13 percent for home hardship, 22.54 percent for
medical hardship, 34.98 percent for bill-paying hardship, and
9.01 percent for food insufficiency. Disabled-veteran
households have relatively high levels of each type of material
hardship; they rank second-highest by a substantial margin in
each hardship domain: 5.51 percent for home hardship, 19.93
percent for medical hardship, 24.89 percent for billpaying
hardship, and 4.87 percent for food insufficiency. In all four
domains, nondisabled-veteran households that include a
disabled nonveteran do substantially better than households
with a disabled veteran. A second observation from the top
panel of table 1 is that bill-paying hardship and medical
hardship are consistently the first- and second most frequently
reported hardship domains across all household types. However,
veteran and nonveteran households differ in their likelihood of
reporting home hardship and food insufficiency: nonveteran
households (regardless of whether they include a person with a
disability) report higher levels of food insufficiency than home
hardship, but veteran households (regardless of whether they
include a person with a
PAGE 131
disability) are more likely to report home hardship than food
insufficiency. Table 1 also shows that demographic and
compositional differences across households are related to the
prevalence of material hardship. In general, each type of
material hardship is reportedly more common among black and
Hispanic households than among white, Asian, and other mixed-
race households. Among households whose members’ highest
level of education is less than a high school diploma, the
percentage reporting each hardship is greater than the
percentage
reportingitamonghouseholdswithahighschooldiplomaormore.Nev
30. ermarried householders respectively report more of each
hardship than their married counterparts do, and the same is true
of previously married householders. So too, each of the
percentages is higher for urban than for nonurban households,
and they are higher for households that include members under
age 18 than for those whose members are all over that age. In
addition, the average income-to-needs ratio in each hardship
category is lower than the average ratio for the analytic sample
as a whole. The average ratio is particularly low among the
subsample reporting food insufficiency. Table 2 presents results
from multivariate logistic regression models that examine each
domain of material hardship in relation to each household-level
configuration of veteran and disability statuses among adult
household members. The models control for other known
correlates of household-level hardship. In the first column,
estimates suggest that nondisabled-veteran households are not
statistically significantly different from households in the
comparison group (i.e., those that do not include a veteran or a
disabled person). However, households that include a person
with a disability, regardless of the disabled individual’s veteran
status, are estimated to face an elevated risk of home hardship.
Disabled-veteran households are 2.73 times more likely to
report experiencing home hardship than are households with no
veteran or disabled person. Compared to the same reference
group, disabled-nonveteran households are 2.27 times more
likely to report home hardship. Finally, nondisabled-veteran
households with a disabled nonveteran are 1.91 times more
likely to report home hardship than are households with no
disabled person and no veteran. Results from supplementary
analyses (see table 2, note a) suggest that disabled-veteran
households are statistically significantly more likely than
nondisabled veteran households to report experiencing home
hardship. It is useful to keep in mind that the overall prevalence
of experiencing a home hardship is rather low (2.65 percent
across the full analytic sample) but disabled-veteran households
face the highest probability of reporting this material hardship
31. (4.38 percent) and a substantively higher probability than
nondisabled households do (1.38 percent). Although
PAGE 132
Page 133
PAGE 134
veteran status appears to be protective in relation to home
hardship, the protection only accrues to households that do not
include an adult with a work-limiting disability. The pattern of
results is similar in the second model, which predicts medical
hardship. The sign on the coefficient for nondisabled-veteran
households is once again negative, but this difference is
statistically significant. The results suggest that nondisabled-
veteran households have 10 percent lower odds of reporting
medical hardship than households in the comparison group.
Households that include a disabled adult are estimated to face
an increased likelihood of reporting a medical hardship,
regardless of veteran status; disabled-veteran households are
estimated to be 2.17 times more likely than the comparison
group households to report medical hardship; the odds are 1.88
higher for nondisabled-veteran households with a disabled
nonveteran. Supplementary analyses suggest once again that
disabled-veteran households experience statistically
significantly more medical hardship than nondisabled-veteran
households do. In addition, the difference in the coefficients for
32. disabled-veteran and disabled-nonveteran households is
marginally statistically significant (p p .089). In substantive
terms, the
predictedprobabilityofexperiencingamedicalhardshipis7.9percen
t for nondisabled-veteran households but double that (16.8
percent) for disabled-veteran households. Although disabled
veterans have access to an array of veteran health benefits that
are not available to nonveterans or to veterans with no
disability, there is no evidence that the risk of medical hardship
is lower in disabled-veteran households than in disabled-
nonveteran households; the predicted probability that disabled
nonveteran households experience a medical hardship is 14.15
percent. Results in the third model show the estimated odds of
experiencing bill-paying hardship, and the patterns are very
similar to those for the
experienceofhomeandmedicalhardships.Nondisabled-
veteranhouseholds enjoy a statistically significantly lower
likelihood of experiencing bill-paying hardship than that faced
by households in the comparison group, though the substantive
effect is only moderate (the predicted probabilities are 12.14
percent for nondisabled-veteran households and 13.22 percent
for the comparison group households). In contrast, the odds of
experiencing a bill-paying hardship are similarly elevated
among all of the households that include a disabled person,
regardless of veteran status. Compared to households in which
no member is a veteran or disabled, disabled-veteran households
are estimated to be 1.96 times more likely to experience a bill-
paying hardship; nondisabled-veteran households with a
disabled nonveteran are 2.08 times more likely, and disabled-
nonveteran households are 2.04 times more likely. The
predicted probabilities are 22.43 percent for disabled-veteran
households, 23.43 percent for nondisabled-veteran households,
and 21.74 percent for disabled-nonveteran households. Results
from supplementary anal
PAGE 135
suggest that disabled-veteran households experience
33. statistically significantly more bill-paying hardship than
nondisabled-veteran households do. In the case of bill-paying
hardship, as with other forms of material hardship, the
advantage that accrues to veteran households appears to decline
and, in fact, becomes a disadvantage, if the veteran is disabled.
The final model estimates the likelihood of experiencing food
insufficiency. Among nondisabled-veteran households and
households in which a nondisabled veteran lives with a disabled
nonveteran, the estimated odds of experiencing food
insufficiency are not statistically significantly different from the
odds that this hardship is experienced by households in which
no member is a disabled person or veteran. The odds of
experiencing food insufficiency are 2.12 times higher among
disabled-veteranhouseholdsand2.39timeshigheramongdisabled-
nonveteran households. Note that the overall prevalence of
reported food insufficiency is low, but the substantive
difference in the odds of experiencing food insufficiency is
meaningful. The predicted probability for a disabled-veteran
household is 2.39 percent, but that for a nondisabled nonveteran
household is 1.1 percent. Consistent with the findings for other
forms of material hardship, results from supplementary
analysissuggestthatdisabled-
veteranhouseholdsarestatisticallysignificantly more likely than
nondisabled-veteran households to experience food
insufficiency.
The other covariates in each of the four models yield estimates
that are consistent with previous research in all regards. Black-
only and Hispanic-only households are more likely than white-
only households to experience home hardship, bill-paying
hardship, and food insufficiency but are slightly less likely than
their white-only counterparts to experience medical hardship.
Households that include at least one person who has a college
education are less likely to experience each measured hardship
than are households in which all members have less than a high
school education. Households with never-married and
previously married householders are estimated to have greater
34. likelihood of hardship than households with married
householders. Households with children under age 18 are
estimated to be at greater likelihood than all adult households.
The household-level income-to-needs ratio is
estimatedtobenegativelyassociatedwiththelikelihoodofexperienci
ng each type of hardship, such that the odds of experiencing
each decline as the ratio rises. Living in an urban area is
estimated to be positively associated with the experience of bill-
paying hardship and food insufficiency. Reports of home and
medical hardships, respectively, are estimated to decline across
the survey periods, but there are no clear patterns of sustained
change in the experience of bill-paying hardship or food
insufficiency across the survey years.
PAGE 136
Discussion
This study contributes to the literatures on veteran well-being
and material hardship. Using nationally representative data from
the1992–2004panels of the SIPP, it examines how adult work-
limiting disability status moderates the relationships between
veteran status and each of four material hardships: home
hardship, medical hardship, bill-paying hardship, and food
insufficiency. The results suggest that veteran and disability
statuses jointly influence material hardships net of the
household’s income-to-needs ratio, household demographics,
and compositional characteristics. Although nondisabled-
veteran households experience levels of hardship that are
similar to(home hardship and food insufficiency)or statistically
significantly lower than (medical and bill-paying hardships)
those experienced by households with no disabled person or
veteran, the levels of material hardship are statistically
significantly higher for all other household types that include a
disabled person than for households in the reference group (with
the exception of food insufficiency among households that
include a nondisabled veteran and a disabled nonveteran).
The odds ratios for all contrasts are in the range of 1.88 to 2.73,
and some of the highest increases in the estimated odds of
35. hardship are in households that include a veteran. Moreover,
disabled-veteran households are estimated to experience
statistically significantly more of each type of hardship than
nondisabled-veteran households do. To the authors’ knowledge,
this is the first study to document material hardships among
households with different configurations of veteran and
disability statuses. Several limitations should be noted. First,
the results in this study should be interpreted as descriptive and
do not provide direct evidence that military service has a
treatment effect on material hardship. It is possible that veteran
households differ from other households on unobserved factors,
and those factors could influence their probability of reporting a
hardship. Second, this study measures disability as a physical,
mental, or other condition that limits the kind or amount of
work an individual can perform. Such a measure does not
capture the full range of specific functional limitations and
disabled statuses that could influence a household’s chances of
experiencing material hardship. Of particular note is the
exclusion from the analysis those households that contain
members who are ages 65 and older. The authors exclude these
households because the measure of work-limiting disability
underestimates disability among older adults. However, children
with disabilities may be present in the households, and their
presence may also affect household well-being. As a
consequence, the estimates provide a downward-biased account
of the effect of disability on the risk of material hardship at the
household level. Also, because of sample size and data
limitations, this study is not able to distinguish among veterans
by the
PAGE 137
historical time periods of their service or by their military
service experiences (e.g., branch of service, rank, military
occupational specialty, exposure to combat). The moderating
influence of veteran status on the relationship between disability
and material hardship is likely to vary with the characteristics
of the veteran. Finally, because this study is largely descriptive,
36. it does not explore how participation in different disability or
veteran programs affects well-being. This is an important topic
for future research. Future research should focus attention on
whether the provision of benefits and services mitigates material
hardships in veterans’ households. Provisions from the US
Department of Veterans Affairs directly aim to address service-
related needs. These provisions try to mitigate some of the
disruption that military service can cause. They compensate and
care for persons harmed in the course of their service, as well as
their dependents. They generally reward those who have taken
risks and made various personal sacrifices in service to their
country. These benefits and services represent two approaches
in the effort to address the needs of veterans. Some benefits
work in tandem with social insurance programs, such as Social
Security and Medicare (Goodman and Stapleton 2007). Others
are designed to accommodate the unique needs of specific
subgroups of veterans (e.g., veterans with service connected
post-traumatic stress disorder, illnesses, and disabilities;
veterans from specific wars; and other veterans with unique
service-related experiences). Provisions for veterans have
expanded over time, but the basic types of benefits have
remained the same since World War II (US Department of
Veterans Affairs 2009a). To qualify, the service member must
have performed full-time, active-duty service and must not be
separated from service through dishonorable discharge.
Eligibility for some benefits is contingent on service during
wartime. Members of Reserve and National Guard components
qualify for benefits under certain conditions. Special provisions
are made for other historically relevant groups (US Department
of Veterans Affairs 2009b). Veterans with service-connected
disabilities are given priority in access to benefits and receive
premiums in resource allocations. This priority depends on an
individual’s disability rating, which is determined by the US
Department of Veterans Affairs and can range from 0 to 100
percent (Wilmoth and London 2011). Thus, access to veterans
benefits varies considerably across the population of individuals
37. who served in the military. This study’s results suggest that it is
important to recognize this underlying heterogeneity in the
veteran population, and particularly the heterogeneity in access
to veterans benefits, time period served, and other military-
related experiences. Although nondisabled-veteran households
may fare better in terms of experiences of material hardship
than comparable households, disabled-veteran households face a
dis
PAGE 138
tinct disadvantage relative to households with nondisabled
nonveterans. Specific veteran programs were created to address
the special challenges faced by disabled-veteran households. As
such, they may not meet the needs of households with
nondisabled veterans. For example, these programs may fail
nondisabled veterans who require assistance to address basic
needs for adequate housing, medical care, and food, or to pay
bills. Further research is needed to investigate whether
nonparticipation is a key issue in current veterans programs and
whether, as recent analyses suggest, the veterans program
participants experience a hole in the social safety net (Fulton et
al. 2009; Perl 2010).
Note
Colleen M. Heflin is an associate professor at the Truman
School of Public Affairs at the University of Missouri. Her
interdisciplinary research program focuses on understanding the
survival strategies employed by low-income households to make
ends meet, the implications of using these strategies for
individual and household well-being, and how public policies
influence well-being. A central focus of her work has been on
understanding the causes and consequences of material
hardship. Janet M. Wilmoth has a PhD in sociology and
demography, with a minor in gerontology, from the
Pennsylvania State University. She is a professor of sociology,
director of the Aging Studies Institute, and senior fellow in the
Institute for Veterans and Military Families at Syracuse
University. Her research examines older adult migration and
38. living arrangements, health status, and financial security. She
and Andrew London are collaborating on several projects about
military service and various life course outcomes. Andrew S.
London is professor and chair of sociology, senior research
associate in the Center for Policy Research, senior fellow in the
Institute for Veterans and Military Families, and codirector of
the Lesbian, Gay, Bisexual, and Transgender Studies Program at
Syracuse University. His research focuses on the health, care,
and well-being of stigmatized and vulnerable populations,
including persons living with HIV, welfare-reliant and working
poor women and children, the previously incarcerated, and
veterans. This research was supported by a Survey of Program
Participation (SIPP) Analytic Research Small Grant from the
National Poverty Center, Gerald R. Ford School of Public
Policy, University of Michigan (Co-PIs: Colleen M. Heflin,
Andrew S. London, and Janet M. Wilmoth). Additional support
was provided by a grant from the National Institute on Aging:
“Military Service and Health Outcomes in Later Life” (1 R01
AG028480-01; PI: Janet M. Wilmoth).
References
Angrist, Joshua D. 1990. “Lifetime Earnings and the Vietnam
Era Draft Lottery: Evidence from Social Security
Administrative Records.” American Economic Review 80 (3):
313– 36. ———. 1998. “Estimating the Labor Market
Impact of Voluntary Military Service Using Social Security
Data on Military Applicants.” Econometrica 66 (2): 249–88.
Angrist, Joshua D., and Alan B. Krueger. 1994. “Why Do World
War II Veterans Earn More Than Nonveterans?” Journal of
Labor Economics 12 (1): 74–97.
Bauman, Kurt J. 1998. Direct Measures of Poverty as
Indicators for Economic Need: Evidence from the Survey of
Income and Program Participation. Technical Working Paper 30,
November. Washington, DC: US Census Bureau, Population
Division.
Bedard, Kelly, and Olivier Descheˆnes. 2006. “The Long-Term
Impact of Military Service on Health: Evidence from World War
39. II and Korean War Veterans.”AmericanEconomic Review 96
(1): 176–94.
Bennett, Pam R., and Katrina Bell McDonald. Forthcoming.
“Military Service as aPathway to Early Socioeconomic
Attainment among Disadvantaged Groups.” Chap. 6 in Life
Course Perspectives on Military Service, edited by Janet M.
Wilmoth and Andrew S. London. New York: Routledge.
Beverly, Sondra G. 2001. “Measures of Material Hardship:
Rationale and Recommendations.” Journal of Poverty 5 (1): 23–
41.
Bound, John, and Sarah Turner. 2002. “Going to War and Going
to College: Did World War II and the G.I. Bill Increase
Educational Attainment for Returning Veterans?” Journal of
Labor Economics 20 (4): 784–815.
Boushey, Heather, Chauna Brocht, Bethney Gundersen,
andJaredBernstein.2001.“Hardships in America: The Real Story
of Working Families.” Report. Economic Policy Institute,
Washington, DC.
Bradshaw, Jonathan, and Naomi Finch. 2003. “Overlaps in
Dimensions of Poverty.” Journal of Social Policy 32 (4): 513–
25.
Burland, Daniel, and Jennifer H. Lundquist. Forthcoming. “‘The
Best Years of Our Lives’: Military Service and Family
Relationships—a Life Course Perspective.” In Life Course
Perspectives on Military Service, edited by Janet M. Wilmoth
and Andrew S. London. New York: Routledge.
Cancian, Francesca M., and Stacey J. Oliker. 2000. Caring and
Gender. Thousand Oaks, CA: Pine Forge Press.
Christensen, Eric, Candace Hill, Pat Netzer, DeAnn Farr,
Elizabeth Schaefer, and Joyce McMahon. 2009. “Economic
Impact on Caregivers of the Seriously Wounded, Ill,and
Injured.” Report CRM D0019966.A2/Final, April. CNA,
Alexandria, VA. http://
www.cna.org/sites/default/files/research/D0019966.A2.pdf.
Clipp, Elizabeth Colerick, and Glen H. Elder Jr. 1996. “The
Aging Veteran of World War II: Psychiatric and Life Course
40. Insights.” 19–51 in Aging and Post traumatic Stress Disorder,
edited by Paul E. Ruskin and John A. Talbott. Washington, DC:
American Psychiatric Press
. Corcoran, Mary E., Colleen M. Heflin, and Kristine Siefert.
1999. “Food Insufficiency and Material Hardship in Post-
TANFWelfare Families.”Ohio StateLawJournal60(4):1395–
1422.
Dechter, Aime´e R., and Glen H. Elder Jr. 2004. “World War II
Mobilization in Men’s Work Lives: Continuity or Disruption for
the Middle Class?” American Journal of Sociology110 (3): 761–
93.
Dobkin, Carlos, and Reza Shabani. 2009. “The Health Effects of
Military Service: Evidence from the Vietnam Draft.” Economic
Inquiry 47 (1): 69–80. Elder, Glen H., Jr. 1986. “Military Times
and Turning Points in Men’s Lives.” Developmental Psychology
22 (2): 233–45. ———. 1989. “Combat Experience and
Emotional Health: Impairment and Resilience in Later Life.”
Journal of Personality 57 (2): 311–41.
Elder, Glen H., Jr., and Elizabeth Colerick Clipp. 1988.
“Wartime Losses and Social Bonding: Influences across 40
Years in Men’s Lives.” Psychiatry: Interpersonal and Biological
Processes 51 (2): 177–98.
Elder, Glen H., Jr., Michael J. Shanahan, and Elizabeth Colerick
Clipp. 1994. “When War Comes to Men’s Lives: Life-Course
Patterns in Family, Work, and Health.” Psychology and Aging 9
(1): 5–16.
Federal Interagency Forum on Aging-Related Statistics. 2010.
“Population Indicator 6: Older Veterans.” 9, 79, and 80 in Older
Americans 2010: Key Indicators of Well-Being.
Report.Washington,DC:USGovernmentPrintingOffice.
http://www.agingstats.gov/agingstatsdotnet/Main_Site/Data/201
0_Documents/Docs/OA_2010.pdf
Fitzgerald,KellyG.2006.“TheEffectofMilitaryServiceonWealthA
ccumulation.”Research on Aging 28 (1): 56–83.
Fujiura, Glenn T., Kiyoshi Yamaki, and Susan Czechowicz.
41. 1998. “Disability among Ethnic and Racial Minorities in the
United States: A Summary of Economic Status and Family
Structure.” Journal of Disability Policy Studies 9 (2): 111–30.
Fulton, Lawrence V., Janna M. Belote, Matthew S. Brooks, and
M. NicholasCoppola.2009. “A Comparison of Disabled Veteran
and Nonveteran Income: Time to Revise the Law?” Journal of
Disability Policy Studies 20 (3): 184–91.
Goodman, Nanette J., and David C. Stapleton. 2007. “Federal
Program Expenditures for Working-Age People with
Disabilities.” Journal of Disability Policy Studies 18 (2): 66–78.
Heflin, Colleen M., Mary E. Corcoran, and Kristine Siefert.
2007. “Work Trajectories, Income Changes, and Food
Insufficiency in a Michigan Welfare Population.” Social Service
Review 81 (1): 3–25.
Heflin, Colleen M., and John Iceland. 2009. “Poverty, Hardship,
and Depression.” Social Science Quarterly 90 (5): 1051–71.
Heflin, Colleen M., Andrew S. London, and Ellen K. Scott.
2011. “Mitigating Material Hardship: The Strategies Low-
Income Families Employ to Reduce the Consequences of
Poverty.” Sociological Inquiry 81 (2): 223–46.
Heflin, Colleen M., John Sandberg, and Patrick Rafail. 2009.
“The Structure of Material Hardship in U.S. Households: An
Examination of the Coherence behind Common Measures of
Well-Being.” Social Problems 56 (4): 746–64.
Iceland, John, and Kurt J. Bauman. 2004. “Income Poverty and
Material Hardship: How Strong Is the Association?” Working
Paper 04-17, December. University of Michigan, National
Poverty Center, Ann Arbor.
http://www.npc.umich.edu/publications/workingpaper04/paper1
7/
Kleykamp, Meredith. Forth coming. “Labor Market Out comes
among Veterans and Military Spouses.” Chap. 9 in Life Course
Perspectives on Military Service, edited by Janet M. Wilmoth
and Andrew S. London. New York: Routledge.
London, Andrew S., Elizabeth Allen, and Janet M. Wilmoth.
Forthcoming. “Military Service, Marital Infidelity, and
42. Divorce.” Journal of Family Issues.
London, Andrew S., Colleen M. Heflin, and Janet M. Wilmoth.
2011. “Work-Related Disability, Veteran Status, and Poverty:
Implications for Family Well-Being.” Journal of Poverty 15 (3):
330–49.
London, Andrew S., Ellen K. Scott, and Vicki Hunter.
2002.“ChildrenandChronicHealth Conditions: Welfare Reform
and Health-Related Carework.” 99–112 in Child Care and
Inequality: Re-thinking Carework for Children and Youth,
edited by Francesca M. Cancian, Demie Kurz, Andrew S.
London, Rebecca Reviere, and Mary C. Tuominen. NewYork:
Routledge.
London, Andrew S., and Janet M. Wilmoth. 2008. “Military
Service.”262–99 in Encyclopedia of the Life Course and Human
Development, vol. 2. Edited by Deborah Carr, Robert Crosnoe,
Mary Elizabeth Hughes, and Amy M. Pienta. Farmington Hills,
MI: Gale.
MacLean, Alair. 2005. “Lessons from the Cold War: Military
Service and College Education.” Sociology of Education 78 (3):
250–66. ———. 2010. “The Things They Carry: Combat,
Disability, and Unemployment among U.S. Men.” American
Sociological Review 75 (4): 563–85.
MacLean, Alair, and Glen H. Elder Jr. 2007. “Military Service
in the Life Course.” Annual Review of Sociology 33:175–96.
Mayer,SusanE.1993.“RecentTrendsinEconomicInequalityintheU
nitedStates:Income versus Expenditures versus Material Well-
Being.” 121–203 in Poverty and Prosperity in the USA in the
Late Twentieth Century, edited by Dimitri B. Papadimitriou and
Edward N. Wolff. New York: St. Martin’s. ———. 1995. “A
Comparison of Poverty and Living Conditions in the United
States, Canada, Sweden, and Germany.” 109–51 in Poverty,
Inequality, and the Future of Social Policy: Western States in
the New World Order, edited by Katherine McFate, Roger
Lawson, and William Julius Wilson. New York: Russell Sage.
Mayer, Susan E., and Christopher Jencks. 1989. “Poverty and
the Distribution of Material Hardship.” Journal of Human
43. Resources 24 (1): 88–114.
Mettler, Suzanne. 2005. Soldiers to Citizens: The G.I. Bill and
the Making of the Greatest Generation. New York: Oxford
University Press.
NationalResearchCounciloftheNationalAcademies,Committeeont
heYouthPopulation and Military Recruitment: Physical,
Medical, and Mental Health Standards. 2006. Assessing Fitness
for Military Enlistment: Physical, Medical, and Mental Health
Standards. Edited by Paul R. Sackett and Anne S. Mavor.
Washington, DC: National Academies Press.
O’Day, Bonnie, and Marcie Goldstein. 2005. “Advocacy Issues
and Strategies for the 21st Century: Key Informant Interviews.”
Journal of Disability Policy Studies 15 (4): 240–50.
Ouellette, Tammy, Nancy Burstein, David Long, and Erik
Beecroft. 2004. Measures of Material Hardship: Final Report.
Report (Contract 282-98-006 [TO #31]). Washington, DC: US
Department of Health and Human Services, Office of the
Assistant Secretary for Planning and Evaluation.
Parish, Susan L., Roderick A. Rose, and Margaret E. Andrews.
2009. “Income Poverty and Material Hardship among U.S.
Women with Disabilities.” Social Service Review 83 (1): 33–52.
Pavalko, Eliza K., and Kathryn A. Henderson. 2006.
“Combining Care Work and Paid Work: Do Workplace Policies
Make a Difference?” Research on Aging 28 (3): 359–74.
Perl,Libby.2010.VeteransandHomelessness.Report7-
5700(RL34024),June26.Washington, DC: Library of Congress,
Congressional Research Service.
Resnik, Linda J., and Susan M. Allen. 2007. “Using
International Classification of
Functioning,Disability,andHealthtoUnderstandChallengesinCom
munityReintegration of Injured Veterans.” Journal of
Rehabilitation Research and Development 44 (7): 991– 1006.
Rose, Roderick A., Susan L. Parish, and Joan P. Yoo. 2009.
“Measuring Material Hardship among the US Population of
Women with Disabilities Using Latent Class Analysis.” Social
Indicators Research 94 (3): 391–415.
44. Sampson, Robert J., and John H. Laub. 1996. “Socioeconomic
Achievement in the Life Course of Disadvantaged Men: Military
Service as a Turning Point, circa 1940–1965.” American
Sociological Review 61 (3): 347–67.
Savoca, Elizabeth, and Robert Rosenheck. 2000. “The Civilian
Labor Market Experiences of Vietnam-Era Veterans: The
Influence of Psychiatric Disorders.” Journal of Mental Health
Policy and Economics 3 (4): 199–207.
She, Peiyun, and Gina A. Livermore. 2007. “Material Hardship,
Poverty, and Disability among Working-Age Adults.” Social
Science Quarterly 88 (4): 970–89.
Teachman, Jay D. 2004. “Military Service during the Vietnam
Era: Were There Consequences for Subsequent Civilian
Earnings?” Social Forces 83 (2): 709–30. ———. 2005.
“Military Service in the Vietnam Era and Educational
Attainment.” Sociology of Education 78 (1): 50–68. ———.
2007. “Race, Military Service, and Marital Timing: Evidence
from the NLSY-79.” Demography 44 (2): 389–404. Teachman,
Jay D., and Vaughn R. A. Call. 1996. “The Effect of Military
Service on Educational, Occupational, and Income Attainment.”
Social Science Research 25 (1): 1–31.
Teachman, Jay D., Vaughn R. A. Call, and Mady S. Wechsler.
1993. “Family, Work, and School Influences on the Decision to
Enter the Military.” Journal of Family Issues 14 (2): 291–313.
Teachman, Jay
D.,andLuckyM.Tedrow.2004.“Wages,Earnings,andOccupational
Status: Did World War II Veterans Receive a Premium?” Social
Science Research 33 (4): 581– 605. ———. 2007. “Joining Up:
Did Military Service in the Early All Volunteer Era Affect
Subsequent Civilian Income?” Social Science Research 36 (4):
1447–74.
Tseng, Chin-Lin, Usha Sambamoorthi, Anjali Tiwari, Mangala
Rajan, Patricia Findley, and Leonard Pogach. 2006. “Diabetes
Care among Veteran Women with Disability.” Women’s Health
Issues 16 (6): 361–71.
Turner, Sarah, and John Bound. 2003. “Closing the Gap or
45. Widening the Divide: The Effects of the G.I. Bill and World
War II on the Educational Outcomes of Black Americans.”
Journal of Economic History 63 (1): 145–77.
US Census Bureau. 2009. “Selected Social Characteristics in the
United States: 2009.” Table CP02 in 2009 American Community
Survey 1-Year Estimates. http://factfinder2census.gov.
US Department of Veterans Affairs. 2009a. Federal Benefits for
Veterans, Dependents, and Survivors:2009
Edition.VAPamphlet80-09-01(P94663). Washington, DC:US
Government Printing Office.
US Department of Veterans Affairs. 2009b. “A Summary of VA
Benefits: Putting Veterans 142 Social Service Review First.”
VA Pamphlet 21-00-1, July. US Department of Veterans
Affairs, Washington, DC.
http://www.vba.va.gov/VBA/benefits/factsheets/general/21-00-
1.pdf
Wilmoth, Janet M., and Andrew S. London. 2011. “Aging
Veterans: Needs and Provisions.” 445–61 in Handbook of the
Sociology of Aging, edited by Richard A. Settersten Jr. and
Jacqueline L. Angel. New York: Springer.
Wilmoth, Janet M., Andrew S. London, and Wendy M. Parker.
2010. “Military Service and Men’s Health Trajectories in Later
Life.” Journal of Gerontology B: Social Sciences 65B (6): 744–
55. ———
.2011.“SexDifferencesintheRelationshipbetweenMilitaryService
andFunctional Limitations and Disabilities.” Population
Research and Policy Review 30 (3): 333–54.
Xie, Yu. 1992. “The Socioeconomic Status of Young Male
Veterans, 1964–1984.” Social Science Quarterly 73 (2): 379–96.
Journal of Loss and Trauma, 16:160–179, 2011
Copyright # Taylor & Francis Group, LLC
ISSN: 1532-5024 print=1532-5032 online
DOI: 10.1080/15325024.2010.519281
46. PAGE 160
When Veterans Return: The Role of Community in
Reintegration
ANNE DEMERS
Health Science Department, San Jose State University, San
Jose, California, USA
Experiences of Iraq and Afghanistan war veterans were explored
to understand the challenges of reintegrating into civilian life
and the impact on mental health. Respondents completed
preliminary electronic surveys and participated in one of six
focus groups. High levels of distress exist among veterans who
are caught between military and civilian cultures, feeling
alienated from family and friends, and experiencing a crisis of
identity. Narrative is identified as a means of resolution.
Recommendations include development of social support and
transition groups; military cultural competence training for
clinicians, social workers, and college counselors; and further
research to identify paths to successful reintegration into
society.
War is widely acknowledged as a public health issue, and there
is a growing body of literature documenting the negative health
effects of war on military personnel who have served in either
the Iraq or Afghanistan wars. According to the Department of
Defense (2010), over 5,500 military service members have died
and approximately 38,650 have been physically wounded since
March 19, 2003. Tanielian and Jaycox (2008) report that 31% of
veterans overall have posttraumatic stress disorder (PTSD), and
combat experience itself is related to increased risk for anxiety,
depression, and anger symptomology. Suicides among troops
have been well-publicized, and soldiers without comorbid
diagnoses report high levels of stress and the use of alcohol as a
coping mechanism (Miles, 2004). Additionally, several studies
(Cascardi & Vivian, 1995; Gelles & Cornell, 1985; Riggs,
Caulfield, & Street,
Received 16 April 2010; accepted 10 July 2010. Address
47. correspondence to Anne Demers, Assistant Professor and MPH
Fieldwork Coordinator, Health Science Department, San Jose
State University, 1 Washington Square, San Jose, CA 95192-
0052, USA. E-mail: [email protected]
PAGE 161
2000; Seltzer & Kalmuss, 1988; Strauss, 1990) have found that
stress brought about by economic strains, chronic debt, and
income shortfalls increases the likelihood of engaging in
interpersonal violence upon return from deployment. These
stressors are all common to the challenges of readjustment for
veterans. Research on veterans’ readjustment has focused
primarily on psychosocial adjustment within the context of
PTSD (King, King, Fairbank, Keane, & Adams, 1998; Koenen,
Stellman, Stellman, & Sommer, 2003; Mazeo, Beckham,
Witvliet, Feldman, & Shivy, 2002), adult antisocial behavior
(Barrett et al., 1996), and physical injury (Resnik & Allen,
2007; Resnik, Plow, & Jette, 2009), and social support appears
to act as either a protective factor against developing PTSD
(Brewin, Andrews, & Valentine, 2000; Pietrzak, Johnson,
Goldstein, Malley, & Southwick, 2009; Westwood, McLean,
Cave, Borgen, & Slakov, 2010) or a moderating factor against
PTSD symptoms (Barrett & Mizes, 1988; Schnurr, Lunney, &
Sengupta, 2004). Fifty years after reintegration, World War II
veterans identified social support from comrades, wives, and
family members as an important lifelong coping strategy (Hunt
& Robbins, 2001). The literature documents the mental and
physical outcomes of deploying to war, and there is a body of
work that addresses psychosocial adjustment to combat
experiences; however, there are few qualitative studies, and
there is a paucity of research examining current soldiers’ and
veterans’ lived experiences of returning home and transitioning
into civilian life. This qualitative study sought to uncover these
experiences in veterans’ own words.
LITERATURE REVIEW
Unlike quantitative research in which a complete literature
review is conducted prior to implementing the study, the
48. relevant literature for qualitative research emerges during data
analysis. Identity and the role of military culture in the
formation of identity emerged as cross-cutting themes during
the analysis process; hence, these topics formed the basis of the
literature review and the lens through which the experiences of
participants were interpreted.
Culture
Culture is the web of significance that humans create (Geertz,
1973), and it is within culture that we learn socially accepted
norms, how selves are valued, and what constitutes a self (Adler
& McAdams, 2007; Pasupathi, Mansour, & Brubaker, 2007).
Although men and women come to the military from diverse
cultural backgrounds, the one thing they ultimately share is
PAGE 162
assimilation into military culture. One of the primary goals of
boot camp, the training ground for all military personnel, is to
socialize recruits by stripping them of their civilian identity and
replacing it with a military identity. The passage from one
identity to another comprises three stages: separation, liminality
(or transition), and incorporation (Van Gennep, 1960).
Separation involves the removal of an individual from his or her
customary social life and the imposition of new customs and
taboos. The second stage, liminality, is one of transition
between two social statuses. The individual is ‘‘betwixt and
between’’ statuses, belonging to neither one nor the other
(Turner, 1974, p. 232). Transition rites create new social norms,
and initiates become equal to each other within emergent
‘‘communitas’’ (a ‘‘cultural and normative form...stressing
equality and comradeship as norms’’ within relationships that
develop between persons) (Turner, 1974, pp. 232, 251). In the
third stage, the individual reenters the social structure,
oftentimes, but not always, with a higher status level than
before. Military identity is infused with the values of duty,
honor, loyalty, and commitment to comrades, unit, and nation.
It promotes self-sacrifice, discipline, obedience to legitimate
authority, and belief in a merit-based rewards system (Collins,
49. 1998). These values are in conflict with more individualistic,
liberty-based civic values, which embrace materialism and
excessive individualism.
Military training is rooted in the ideal of the warrior,
celebrating the group rather than the individual, fostering an
intimacy based on sameness, and facilitating the creation of
loyal teams, where recruits develop a ‘‘bond that transcends all
others, even the marriage and family bonds we forge in civilian
life’’ (Tick, 2005, p. 141). At the same time, recruits become
capable of fighting wars by learning how to turn their emotions
off and depersonalizing the act of killing ‘‘the other.’’ The
process of war involves dehumanizing everyone involved (on
both sides) and placing everyone in kill or be killed situations.
According to Tick (2005, p. 21), war ‘‘reshapes the imagination
as an agent of negation.’’ To create strategies and use weapons
for the destruction of others, the imagination is ‘‘enlisted in
life-destroying service’’ (Tick, 2005, p. 21).
The differences in values between civilian society and military
society create a ‘‘civil-military cultural gap’’ (Collins, 1998, p.
216), which is exacerbated by the fact that there is an all-
volunteer military. Today, fewer families have direct contact
with someone serving in the military than ever before. The
move away from a draft and to a volunteer force has allowed
most Americans to become completely detached from military
issues and the men and women who are sent to war, leading to a
lack of understanding about the differences between the two
worlds (Collins, 1998). This is complicated further by the
absence of a national consensus about war, the lack of
validation of soldiers’ efforts, and the general lack of
acknowledgment of soldiers who return from war (Doyle &
Peterson, 2005).
PAGE 163
Identity
Identity is socially, historically, politically, and culturally
50. constructed (Weber, 1998) within communities (i.e., within
social or civic spaces) (Kerr, 1996). Ideally, these are places
where others recognize, acknowledge, and respect one’s
experiences, thus providing a sense of belonging. The way in
which our identities are constituted is through narrative, or
storytelling. Stories are the primary structure through which we
think, relate, and communicate, actively shaping our identities
by enabling us to integrate our lived experiences into a cohesive
character (Mair, 1988; Cajete, 1994). Not only do the stories
that we tell and live by shape our individual continuity by
connecting past, present, and future, they also shape our
communities. Thus, a reciprocal relationship exists between
individual narratives and cultural narratives, each serving to
inform the other and to maintain continuity of a sense of self
and culture over time (Chandler & Lalonde, 1998; O’Sullivan-
Lago, de Abreu, & Burgess, 2008; Sussman, 2000).
According to Ricoeur (1992) and others (Baerger & McAdams,
1999; Bruner, 1987; Howard, 1991; Pasupathi et al., 2007;
Sarbin, 1986; Whitty, 2002), we can only know ourselves and
find meaning in our lives through narrative. It is through the
continual retelling of our stories (i.e., weaving together our
day-to-day experiences with reinterpretations of our past
experiences) that we know who we are today. These narratives
create our personal myths that change over time (McAdams,
1993). We choose to remember events in a particular way, we
set goals and expectations, we regulate emotions, and we can
imagine possible future selves based on our current lives
(Pasupathi, Weeks, & Rice, 2006). Understood in narrative
terms, identity belongs in the sphere of the dialectic between
sameness (that part of us that holds constant, i.e., genetic
makeup, physical traits, and character) and selfhood (our
experiences over time) (Abes, Jones, & McEwen, 2007;
Ricoeur, 1992); it is constructed in connection with the story
elements in a life’s narrative (Ricoeur, 1992). Life stories
address the issue of identity by describing how a person came to
be his or her current self, via remembering and the
51. interpretation of past experiences.
Traumatic experiences create an additional challenge to
maintaining a continued sense of personal identity because of
their highly disruptive and emotionally charged nature (Janoff-
Bulman, 1992). Burnell, Hunt, and Coleman (2009) and others
(Crossley, 2000; Pillemer, 1998; Westwood, Black, & McLean,
2002) assert that reconciliation comes about when negative
narratives are integrated as one coherent chapter of a life story.
Coherence is ensured when the story is linked together and not
merely a succession of separate chronological events. The
narrative must contain a theme that integrates events (Burnell et
al., 2009), and dysfunctional integration (Berntsen, Willert, &
Rubin, 2003)—integration of the trauma into one’s narrative
whereby the traumatic experience becomes the focal point of
one’s life story
PAGE 164
and the lens through which all other experiences are then
interpreted—must be avoided. In their work with veterans,
Burnell et al. (2009) and Pillemer (1998) found that veterans
identified telling their stories to others as an effective way to
cope with war memories. Some achieved coherence through
professional aid, and others achieved it through positive
interactions with informal social support networks, including
comrades, family and friends, and the general public (Burnell et
al., 2009). When we do not have the opportunity to reflect on
the history of our life and our place in it, an interval opens
between sameness and selfhood (Ricoeur, 1992). Individuals
may find themselves living between two social contexts that
offer incompatible cultural narratives and unable to articulate
an integrated personal narrative that avoids a crisis in identity
(Adler & McAdams, 2007; O’Sullivan-Lago et al., 2008).
Hermans and Kempen (1998) identify the spaces where cultures
meet and individuals are confronted with the challenge of
constructing new identities as contact zones that become the
‘‘habitus for constructing an identity through a socially shared
repertoire of cultural knowledge, practices, and values with
52. clearly marked power asymmetries in one’s ability to freely
negotiate this process’’ (Mahalingam, 2008, p. 368).
Uncertainties that are caused by contact with others in contact
zones lead to developing strategies to either avoid or reconcile
contradictions that arise from these interactions in order to
protect the continuity of one’s identity (Hermans, 2001;
O’Sullivan-Lago & de Abreu, 2010). Under ideal circumstances,
people identify the similarities between themselves and others
in the ‘‘I as a human being’’ strategy (O’Sullivan-Lago et al.,
2008, p. 359), a dialogical strategy that allows connections with
others based on sameness and allows one to take in the past,
thus easing cultural uncertainty and permitting the rejection of
unwanted identities, which results in the creation of a hybrid
identity (Mahalingam, 2008). The reality is that a process of
hegemonic bargaining occurs (Chen, 1999) between the
dominant culture and persons from other cultures that may have
negative mental health consequences for those outside the
dominant culture (Mahalingam, 2008). At best, this may lead to
limited opportunities for adult development; at worst, it leads to
poorer mental health (Main, 1995), including depression
(Baerger & McAdams, 1999) and other forms of
psychopathology (White & Epston, 1990), and may predict
vulnerability to suicide (Chandler & Lalonde, 1998).
METHODS
Design
A qualitative study utilizing focus groups to explore active duty
soldiers’ and veterans’ experiences of returning home was
conducted. Qualitative
PAGE 165
interviews are a key way to learn about other people’s feelings
and thoughts and achieve new shared understandings about
people’s lived experiences. Focus groups were selected because
this method is recognized as an appropriate way to obtain in-
depth information about individuals who share similar
experiences, using group interaction as a catalyst for generating
innovative ideas that might not be revealed in individual
53. interviews (Morgan, 1998).
Participants
Purposive sampling was employed to identify and recruit
participants who had served in Afghanistan, Iraq, or both since
the beginning of the wars in those countries in October 2001
and March 2003, respectively. Participants were recruited in
both northern California (San Francisco Bay area) and southern
California (San Diego) through Internet advertisements;
dissemination of flyers at 2- and 4-year colleges and
universities, coffee houses, and veterans’ centers; and word of
mouth primarily through area veteran groups and veterans’
family groups, veterans’ hospitals and medical facilities, and
community nonprofit organizations.
Recruitment materials directed potential participants to the
Swords to Plowshares (an agency that has worked with veterans
since the early 1970s) Web site, where they were asked to
complete an electronic survey using Survey Monkey.
Demographic data were collected via the survey, including age,
branch of service, rank, military status, and number of
deployments to Iraq and=or Afghanistan. Respondents were
asked to provide an e-mail address to receive detailed
information about locations and times of focus groups. These
methods resulted in 45 male and 3 female participants. Because
so few females responded, they were contacted and asked to
consider participating in a future study. Each of them consented
to do so.
Procedures
The San Jose State University Institutional Review Board
approved this study. Respondents who were eligible for the
study were given a date and time that was most convenient for
them to participate in one focus group session. The interviewer
reviewed all relevant points contained in the consent form,
emphasizing that results would be reported only in aggregate
form. All participants provided written informed consent before
participating in the study. Confidentiality was explained to
participants and maintained throughout the study. A list of local
54. mental health and social service resources was provided to
participants. A semistructured interview guide was used to
conduct the focus groups. The guide was developed by the
principal investigator (PI) and reviewed
PAGE 166
and endorsed by Swords to Plowshares staff, including three
veterans. The interview guide consisted of open-ended questions
to elicit responses among participants about (a) the ways in
which their deployments impacted their lives, (b) the ways in
which their deployments affected their interactions with family
members and friends, and (c) the types of support they sought
out and received (both formal and informal).
Six focus groups were held—one each in San Francisco (n=5),
Oakland (n=5), and San Jose (n=8) and three in San Diego,
California (n=27; 9 in each group)— Jose (n¼8) and three in
San Diego, California (n¼27; 9 in each group)—between
September 2006 and September 2008. Focus groups were held in
community rooms at local hospitals, nonprofit organizations,
and churches. All sessions were audiotaped. Before the start of
each focus group, participants were presented with a list of
guidelines in order to facilitate effective communication during
the discussions. The tape recorder was placed in full view of
participants. Each participant was provided with the opportunity
to respond to each question but was informed that he did not
have to do so. Data saturation was used to determine the number
of focus groups needed to fully explore the topic of this study.
Data saturation was achieved when no new information was
gathered during the focus groups and statements were
supportive of previously identified categories and themes.
Data Analysis
Data from Survey Monkey were downloaded and descriptive
data analysis was conducted using SPSS. Focus group data were
analyzed as group data. Audiotapes were transcribed into
verbatim written records. Transcripts were read and compared
with the audiotapes on two separate occasions by the PI and a
research assistant to ensure accuracy of the data transcription.
55. Transcripts were read and reread in order to find commonalities,
and themes were developed inductively.
Lincoln and Guba’s (1985) four criteria for determining
trustworthiness of qualitative research were used for this study:
credibility, dependability, confirmability, and transferability.
Credibility was established through the use of peer debriefings
and member checks. In this study, peer debriefings were
accomplished by sharing the data and ongoing data analysis
with colleagues, and member checks involved two participants
who were asked to provide feedback at periodic intervals during
data analysis, interpretation, and the formulation of
conclusions. Dependability and confirmability were ensured by
having an independent judge categorize 15% of the data and
compare categories and themes with those of the researcher. An
agreement rate of 93% was reached, with 85% being considered
very good for coding purposes (Rosenthal & Rosnow, 2007).
Transferability was ensured by collecting participants’
demographics and thick descriptions of the data.
PAGE 167
RESULTS
Participants Recruitment methods yielded a diverse group of
participants (N=45) ranging in age from 19 to 51 (Mdn=25) and
representing almost all branches of the U.S. military: Army
(n=12), Marines (n=24), Navy (n=6), and Air Force (n=3). Of
the total sample, 15% were in either the Reserves (n=4) or
National Guard (n=3), and 93% (n=42) were enlisted as opposed
to officers. They had deployed to either Iraq or Afghanistan
between 1 and 4 times (M=2). They reported their current status
as active duty (n=12), reserve (n=3), or separated from the
military (veterans) (n=30). It is acknowledged that each branch
of the military uses different terms to refer to members (e.g.,
marines); however, soldier is commonly used to refer to active
duty military personnel across branches, and it is used
throughout this article to refer to all participants prior to
redeployment from Iraq or Afghanistan to the U.S. Once
soldiers returned home, some of their experiences differed
56. according to status. Thus, beginning with the ‘‘No one
understands us’’ subtheme below, they are referred to by status:
(a) soldiers (those who remain on active duty and reside on or
near military bases and the National Guard), (b) reserves (those
who return to their home communities and can be recalled at
any time), and (c) veterans (those who separate from the
military and return to communities).
Themes and Subthemes
The major themes and subthemes that emerged from this study
are presented in Table 1.
DEPLOYING TO WAR
This theme describes soldiers’ experiences of leaving for war,
thoughts and emotions in the midst of war, and feelings about
returning home. It is divided into three subthemes: ‘‘we are
warriors,’’ ‘‘no fear,’’ and ‘‘feeling high.’’ Each is described
below and supported by selected material from the focus groups.
PAGE 168
We are warriors. This theme addresses soldiers’ experiences in
the war theater and their psychological state of mind while
there. Military personnel are trained to go to war, and some
soldiers said they ‘‘were actually kind of gung ho on the way
over’’ and ‘‘eager to go,’’ because ‘‘this was what we trained
for.’’ One element of the training included how to become
angry on demand. Many soldiers referred to their ‘‘anger
switch,’’ which was described by one participant as ‘‘an act that
you learn from your drill instructors’’ that you can go into at
any time. He elaborated, saying that ‘‘it’s not because [you are]
really angry, but just because [you]...communicate that way.’’
Participants’ narratives revealed the ‘‘life or death’’ nature of
day-to-day existence while in the war theater: ‘‘You cannot
afford to care. You’re constantly scanning the roads, looking for
anything out of place, looking for IEDs [improved explosive
devices].... You can’t trust anybody; they’re all the enemy—
women, children, all of ’em.’’ Speaking about the course of his
days, one soldier said, ‘‘You know, we’ve got this operation,
57. everything is so fast paced, so fast paced. It’s like something in
the movies.’’ Referring to this pace, another soldier described
the level of stress he had to endure as ‘‘almost unbearable,’’
and an Army soldier shared, ‘‘It’s so awful, there are no words
to describe it, and it’s not just fear, there’s an unstoppable
stress that doesn’t turn off.’’ Participants described seeing
‘‘stuff so bad, you can’t put it into words’’; however, they
noted that they had done what they were trained to do and were
forced to do for their own survival and that of their comrades.
No fear. In addition to describing the stress they experienced,
soldiers also explained how they attempted to cope with the
stress and their surroundings. One soldier said:
I saw a lot of combat, and the people around me had an attitude
that it’s like a lottery; [if] it’s your time, it’s your time. You get
in that mindset and then, pretty much, go on with your day.... I
mean, yeah, you would always have it in the back of your head
that, you know, snipers might be taking aim at you, or you
might hit something.
Another soldier shared, ‘‘I would just put in to my mind, every
time I go out, every day, this is the last day you have to live, so
it doesn’t matter.’’ All participants agreed that this attitude
‘‘definitely made it easier to just kind of live life normally’’
while they were in the war theater.
Feeling high. Some soldiers’ narratives revealed that while they
were struggling with the stress of war during their time in the
war theater, their attitudes shifted substantially when they
received news that they were going
PAGE 169
home. They variously said that ‘‘you’re kind of euphoric at that
point’’ and ‘‘you got an artificial high going on.’’ They
described ‘‘just want[ing] to see family’’ and wanting to ‘‘be
with my wife and kids.’’ All soldiers agreed that ‘‘getting out
kind of makes you suppress what you’re feeling because you’re
so excited.’’ They talked about working through emotional and
psychological issues at a later time, after they returned home.
One soldier said, ‘‘I was like what do I care? I’m going home!
58. I’ll figure it out later.’’ He added, ‘‘I think that was the
consensus with the other guys. It was ‘well, I’m going home, I
don’t really—I’m not going to feel.’ If they were going to feel
anything, they’re not going to feel it right then.’’ Nevertheless,
their euphoria was relatively short-lived as they came face to
face with reality upon returning to the United States.
COMING HOME
This theme illustrates soldiers’ reactions to returning home,
perceptions of difference (between themselves and civilians and
between who they were prior to war and who they are now),
tension between wanting to reconnect with civilians (including
family) and wanting to retreat from them, coping mechanisms,
and support for transition. There are three subthemes: ‘‘time
travelers,’’ ‘‘no one understands us,’’ and ‘‘crisis of identity.’’
Each is described below and supported by selected focus group
material.
Time travelers. This subtheme illustrates the disconnection that
soldiers experienced when they returned to the U.S. They all
described their experiences as ‘‘surreal’’ and ‘‘like landing on
Mars.’’ One soldier said:
I remember coming into LAX, and getting off the plane, and
looking around, thinking ‘‘Damn, I’m back in the U.S.’’ It’s
like...there’s a sense of time gone from my life. Their [family]
lives go on, but...your life is stopped for 2 years.
Two soldiers elaborated, contrasting their experiences between
where they had been and where they were now, in terms of both
geographic location and psychological space. They described
being’’ in a completely different place’’ where ‘‘one day you
put a bullet in a guy’s head...you’re getting shot at, and then
you rotate back to Germany, to the States.’’ Soldiers appear to
have been caught between two cultures: military culture, where
they understood what was considered appropriate behavior, and
civilian culture, where they did ‘‘not know the rules of the
game, [and] if you kill somebody, you’ll go to jail.’’ This led to
significant confusion, as illustrated by one soldier’s comment:
‘‘In my mind, I’m like, what the hell is going on here?’’ All of
59. the soldiers acknowledged that this had been their experience,
and that it was overwhelming. They described the challenges of
‘‘turning your emotions
PAGE 170
on and off like a light switch,’’ of ‘‘being a killer,’’ and of the
expectation on the part of civilians that they act ‘‘like a
gentleman at the same time.’’
No one understands us. All soldiers (active duty, reservists, and
veterans) acknowledged that they were no longer the same
individuals who went off to war. They shared that they felt
different from civilians when they returned to the U.S. One
reservist commented, ‘‘Civilians don’t understand you.’’ Other
veterans added that ‘‘[people] think you’re just a regular
civilian’’ and ‘‘they think you’re just a normal dude walking
around [the city]. They have no idea that 72 hours ago you were
whacking dudes in a house in Iraq.’’ One veteran expressed,
‘‘It’s really hard for anyone else to understand, to know what’s
going on.... You know, they don’t understand the military
concept, and it’s hard to blend in with them.... It’s a different
atmosphere.’’
The experience of returning was different for soldiers (active
duty), reservists, and veterans who returned to civilian
communities. Soldiers and reservists identified readjusting to
family life as the most challenging aspect of returning home.
The primary tension was knowing that they would be deployed
again and not knowing where or when it would be. This led to
fighting between soldiers and their spouses. One soldier
summarized the stress, saying, ‘‘These rotations are killing
people’s families.’’ One of the strategies soldiers employed to
address the tension of leaving again was to receive permission
to stay behind during the next deployment. However, that did
not seem to resolve the issue. Another soldier said:
Some guys stay back for family situations, not to piss their wife
off anymore, not to miss another kid born, but then you’re
stressed out by being the guy that’s left. So, you’re not the nice
guy when you come home. It doesn’t help the situation at all;