SlideShare a Scribd company logo
1 of 10
Download to read offline
ENVIRONMENTAL BIOTECHNOLOGY
Biogas desulfurization using autotrophic denitrification process
Alper Bayrakdar1
& Ebrahim Tilahun1
& Baris Calli1
Received: 26 June 2015 /Revised: 9 September 2015 /Accepted: 16 September 2015 /Published online: 1 October 2015
# Springer-Verlag Berlin Heidelberg 2015
Abstract The aim of this study was to evaluate the performance
of an autotrophic denitrification process for desulfurization of
biogas produced from a chicken manure digester. A laboratory
scaleupflowfixedbedreactor (UFBR)wasoperatedfor 105days
and fed with sodium sulfide or H2S scrubbed from the biogas and
nitrate as electron donor and acceptor, respectively. The S/N ratio
(2.5 mol/mol) of the feed solution was kept constant throughout
the study. When the UFBR was fed with sodium sulfide solution
with an influent pH of 7.7, about 95 % sulfide and 90 % nitrate
removal efficiencies were achieved. However, the inlet of the
UFBR was clogged several times due to the accumulation of
biologically produced elemental sulfur particles and the clogging
resulted in operational problems. When the UFBR was fed with
the H2S absorbed from the biogas and operated with an influent
pH of 8–9, around 98 % sulfide and 97 % nitrate removal effi-
ciencies were obtained. In this way, above 95 % of the H2S in the
biogas was removed as elemental sulfur and the reactor effluent
was reused as scrubbing liquid without any clogging problem.
Keywords Clogging .Elementalsulfur .Nitrate .Scrubbing .
Sulfide oxidation
Introduction
Biogas is generated from anaerobic digestion of organic mat-
ters such as manure (Tafdrup 1995), sewage sludge (Fonoll
et al. 2015), and organic fractions of solid waste (FernĂĄndez-
RodrĂ­guez et al. 2015). The combined heat and power gener-
ation by using internal combustion engines is the common
approach to utilize the methane-containing biogas. Hydrogen
sulfide (H2S), which is one of the major impurities in biogas,
may form during the anaerobic digestion due to reduction of
sulfur containing compounds such as sulfates, peptides, and
amino acids (Ko et al. 2015). Co-generator manufacturers
recommend limiting values for H2S between 100 and
300 ppm in order to prevent corrosion in piping systems and
equipment (Deublein and Steinhauser 2011). Besides, H2S is
an odorous gas which is toxic to living organisms and thus its
emission has to be carefully controlled (Ko et al. 2015;
Potivichayanon et al. 2006).
Biogas desulfurization can be performed either in situ
in the digester or ex situ by treating the gas in a sep-
arate desulfurization unit. Removal of H2S can be
achieved via physicochemical (Nowicki et al. 2014;
Shang et al. 2013; Üresin et al. 2014) and biological
(FernĂĄndez et al. 2014; Montebello et al. 2012;
Rodriguez et al. 2014) processes. Amine absorption, liq-
uid phase oxidation and caustics absorption are the most
widely used physicochemical methods (Chen et al.
2001). However, the physicochemical methods are rela-
tively costly compared to the biological desulfurization
processes (Chen et al. 2014) and result in generation of
hazardous spent scrubbing liquid.
H2S can be oxidized biologically by some autotrophic bac-
teria, namely Thiobacillus and Sulfolobus (LĂłpez et al. 2012).
Sulfide oxidizers can use oxygen as electron acceptor and
oxidize hydrogen sulfide to elemental sulfur or sulfate
depending on the aeration rate (Tang et al. 2009). However,
bio-desulfurization of biogas by aeration has some disadvan-
tages. The introduction of oxygen into the biogas might pose
safety problem due to explosion risk (Syed et al. 2006), at
5–15 % oxygen level depending on the CH4 content (Cirne
* Alper Bayrakdar
alper.bayrakdar@marmara.edu.tr
1
Department of Environmental Engineering, Marmara University,
34722 Istanbul, Turkey
Appl Microbiol Biotechnol (2016) 100:939–948
DOI 10.1007/s00253-015-7017-z
et al. 2008; Ramos and Fdz-Polanco 2014). Another disad-
vantage is the difficulty in monitoring the hydrogen sulfide
concentration and controlling the amount of air or oxygen
supplied. Moreover, inert N2 and excess O2 supplied to the
system in the form of air may cause the dilution of biogas.
Diaz et al. (2010) reported that 30–40 % of oxygen introduced
to the system was consumed in sulfide oxidation and the re-
maining oxygen left the digester with the biogas. The dilution
of the biogas may result in combustibility problems and de-
crease the biogas’ calorific value. Therefore, bio-
desulfurization of the biogas by using air may not be suitable
if the biogas is to be used as vehicle fuel or for grid injection
due to the remaining traces of especially O2 (Petersson and
WeLLInGer 2009).
The removal of nitrogen from the industrial and/or
domestic wastewater is obligatory because of stringent
discharge standards, especially in coastal areas sensitive
to eutrophication. Although classical heterotrophic deni-
trification processes are rather effective in removing ni-
trate, always a sufficient amount of organic matter is
required (Lee and Rittmann 2003). If an extended aera-
tion activated sludge process is used for wastewater
treatment, additional organic matter or process modifica-
tions are required to remove nitrate produced in the
aeration basin (Sahinkaya et al. 2014).
The autotrophic denitrification processes receive
more attention due to its two major advantages than
the heterotrophic denitrification processes: (1) no need
for an external organic carbon source (methanol or
ethanol) and (2) less sludge production that minimizes
the chemical and sludge management cost (Zhang and
Lampe 1999). In this context, reduced forms of sulfur
species such as elemental sulfur and sulfide can be
used as an electron source (FernĂĄndez et al. 2008).
Although sulfur is a cheap electron donor for autotro-
phic denitrification process, sulfate production and al-
kalinity requirement are the main drawbacks of using
sulfur as electron donor (Sahinkaya et al. 2015). The
autotrophic denitrification process provide an opportu-
nity for simultaneous removal of sulfide and nitrate in
the wastewater treatment plants having anaerobic
sludge digester (Baspinar et al. 2011). Additionally, it
may be much easier to control the final reaction by-
products compared to aerobic sulfide oxidation by
adjusting the ratio of electron donor to acceptor (H2S/
NO3
−
).
H2S can be scrubbed from the biogas by chemical absorp-
tion using hydroxide solutions (Baciocchi et al. 2013) (Eq.1).
Inorganic carbon required for autotrophic denitrifiers could
also be absorbed in this way (Eq.2). However, when the spent
absorption solution is discharged or mixed with other waste
streams, scrubbed H2S may easily release to the atmosphere.
Hence, the spent scrubbing solutions are classified as
hazardous substances (Chen et al. 2001). The scrubbed H2S
can be used as electron donor in an autotrophic denitrification
process (Eq.3) (Baspinar et al. 2011; FernĂĄndez et al. 2014;
Guerrero and Bevilaqua 2015). In this way, the sulfide in the
spent scrubbing liquid is desulfurized while the nitrate and/or
nitrite ions in wastewater are denitrified.
H2S ĂŸ OH−
↔HS−
ĂŸ H2O Ă°1Þ
CO2 ĂŸ NaOH↔NaHCO3 Ă°2Þ
5HS−
ĂŸ 2NO3
−
ĂŸ 7HĂŸ
→5S0
ĂŸ N2 ĂŸ 6H2O Ă°3Þ
In this study, for the removal of H2S produced from a
laboratory scale anaerobic chicken manure digester, a two-
stage chemical H2S absorption plus bio-desulfurization pro-
cess was investigated. Firstly, the H2S was absorbed from the
biogas using a scrubber filled with alkaline solution. Then the
scrubbing liquid was fed as electron source to an autotrophic
denitrifying upflow fixed bed reactor (UFBR). The perfor-
mance of the UFBR was investigated for 105 days under
varying hydraulic retention times (HRTs), sulfide loading
rates, and influent pH values.
Material and methods
Sulfide oxidizing autotrophic denitrification reactor
In this study, an upflow fixed bed reactor (UFBR) (Fig. 1b)
having a working volume of 250 mL was operated under
anoxic conditions. The diameter and total height of the reactor
were 4 and 20 cm, respectively. The reactor had been operated
for around a year before the initiation of this study with an
HRT of 9 h and influent pH of 7.5 to determine the optimum
operational conditions for sulfide-based autotrophic denitrifi-
cation. Acid washed and rinsed 50 g of granular activated
carbon (GAC) (Norit GAC 1240) was used as packing mate-
rial. The inoculum taken from the denitrification tank of a
local sewage treatment plant was mixed with the activated
carbon granules before being filled into the UFBR. S/N ratio
was kept at 2.5 (mol/mol) to prevent the complete oxidation of
sulfide to sulfate, mainly to produce elemental sulfur as final
product (Eq.3). The UFBR was placed in a water jacket and
operated at 35 ± 1 °C.
Operation of UFBR and H2S scrubber
The operational plan and conditions of the UFBR are given in
Table 1. In the first two periods (periods 1 and 2), the UFBR
was fed with a synthetic solution containing NaNO3
(17 mg N/L), Na2S.9H2O (97 mg S/L), and NaHCO3 as
940 Appl Microbiol Biotechnol (2016) 100:939–948
electron acceptor, donor, and carbon source, respectively.
3.016 g/L K2HPO4 and 0.364 g/L KH2PO4 (20 mM phos-
phate buffer) were added to the synthetic feed after the adjust-
ment of pH to 7.7 with 1 N HCl.
The synthetic feed containing 750 mg/L Na2S.9H2O,
100 mg/L NaNO3, 150 mg/L NaHCO3, 110 mg/L NH4Cl,
10 mg/L MgCl2.6H2O, 10 mg/L CaCl2.2H2O, 3 mg/L yeast
extract, and 5 mg/L ascorbic acid was prepared daily and kept
in refrigerator, while it is continuously fed to the reactor using
a peristaltic pump (Watson-Marlow 323). HRT was 9 h in
period 1 and it was decreased to 4 h in period 2.
In periods 3A and 3B, sulfide and carbon dioxide scrubbed
from biogas of a lab-scale chicken manure digester were fed to
the UFBR, as electron donor and carbon source, respectively.
The biogas of manure digester containing 0.7 ± 0.1 % H2S,
40 ± 3 % CO2, and 60 ± 4 % CH4 was first collected in a 25-L
aluminum foil gas collection bag. Afterwards, it was intro-
duced to a scrubbing column having 350 mL of 2.5 % NaOH
solution (Fig. 1a) for the absorption of the H2S and CO2 from
the biogas. A second scrubber filled with 2.5 % NaOH was
connected to the first one in series to capture the H2S leaving
the first scrubber and to determine the H2S absorption
efficiency. The hydrogen sulfide removal efficiency was cal-
culated according to Eq. 4.
H2S removal eff: %
Ă° Þ ÂŒ HS−
1st scrubber= HS−
1st scrubber ĂŸ HS−
2nd scrubber
ð Þ  100
ð4Þ
In period 3A (days 434–448), the scrubbing liquid was
prepared using tap water, but in period 3B (days 448–470),
the effluent of UFBR was used instead of tap water. The H2S
scrubber was made up off a Plexiglas column and has 4 cm
diameter and 50 cm height. The biogas was introduced to the
alkaline solution through a diffuser from the bottom of the
scrubber using a pump (KNF N86KT.18). Since the absorp-
tion of H2S and CO2 is an alkalinity-consuming process, the
pH decreased during the scrubbing operation. Therefore, pH
was continuously monitored in the first scrubber and the time
to stop pumping biogas was decided based on the pH of the
solution (pH 8–9 in period 3A). The scrubbing operation was
terminated at pH 9. In order to adjust the sulfide concentration
in the feed to 97 mg S/L, some additional sodium sulfide was
supplemented on the days in which there was not enough
biogas generation or the biogas does not contain enough H2S.
Fig. 1 a Biogas scrubbing system (stage 1). b Upflow fixed bed reactor (stage 2)
Table 1 Operational conditions
of UFBR Period Day Sulfide (e−
donor) source Carbon source Scrubbing liquid HRT (h)
1 365–398 Na2S.9H2O NaHCO3 – 9
2 398–434 Na2S.9H2O NaHCO3 – 4
3A 434–448 HS−
scrubbed from biogas HCO3
−
from biogas Tap water 4
3B 448–470 HS−
scrubbed from biogas HCO3
−
from biogas UFBR effluent 4
Appl Microbiol Biotechnol (2016) 100:939–948 941
After batch scrubbing operations, the scrubbing liquid was
immediately transferred into the feeding tank and supplement-
ed with the nutrients listed above, excluding sulfide and bicar-
bonate. Then the headspace of the feeding tank was flushed
with nitrogen gas to provide anaerobic conditions.
Sulfur recovery and electron balance calculations
The amount of daily elemental sulfur production was calcu-
lated by using Eq. 5 assuming that the only products of sulfide
oxidation were elemental sulfur and sulfate.
S0
ÂŒ HS−S
Âœ inf:– HS−S
Âœ eff:– SO4−S
Âœ prod: Ă°5Þ
where S0
is the elemental sulfur, [HS − S]inf. is the equivalent
sulfur input as sulfide, [HS − S]eff. is the equivalent sulfur
output as sulfide, and [SO4 − S]prod. is the equivalent sulfur
output as produced sulfate. The sulfur consumed by microor-
ganisms and polysulfide, which is intermediate product of
sulfide oxidation, was neglected in this calculation.
In addition, the electron balance of the system was also
calculated as a portion of electron accepted by denitrification
and electron donated by sulfide and sulfur oxidations accord-
ing to Eq. 6.
%e−
Œ
mole of electron accepted by denitrification
mole of electron donated by sulfur and sulfide oxidations
 100 ð6Þ
Analytical methods
Samples were filtered using cellulose acetate syringe filters
(pore size of 0.45 ÎŒm) before nitrate, nitrite, ammonia, and
sulfate analyses. Nitrate and nitrite were analyzed using an
HPLC (Shimadzu Prominence LC-20A) equipped with UV
detector at 210 nm and 30 °C. Samples were injected onto a
C18 column (Eurosil Bioselect 300-5, 4 × 120 mm) with the
mobile phase of 0.01 M n-Octylamine (pH 4–4.5) and 1 mL/
min flow rate. Sulfate (4500-SO4
2−
E) and total alkalinity
(2320) were measured according to standard methods (APHA
2005). Sulfide was analyzed spectrometrically (WTW
PhotoLab 6100VIS) following the method described by
Cord-Ruwisch (1985). Biologically produced sulfur particles
taken from the UFBR were extracted and determined accord-
ing to the method described by YĂŒcel et al. (2010). Influent
and effluent ammonia concentrations were analyzed accord-
ing to nesslerization method (Hach 8038) by using a spectro-
photometer (DR2500, Hach Lange GmbH, Germany). Before
the ammonia analysis, samples were distilled by using an au-
tomated distillation system (Vapodest 30, Gerhardt) in order to
eliminate the interference of the sulfide present in the sample.
The methane and carbon dioxide contents of raw and treat-
ed biogas and the nitrogen content of the gas generated by
UFBR were analyzed using a GC equipped with TCD and
Carboxen-1000, 60/80 mesh, 15 ft × 1/8 in. stainless steel
column. The temperature of the column was initially 35 °C
for 5 min and then rose to 225 °C at 20 °C/min.
The amount of nitrogen gas produced from the UFBR was
measured daily by using water displacement method and the
theoretical gas production was calculated according to the
ideal gas law.
Results
Performance of UFBR fed with sodium sulfide solution
This experiment was conducted to evaluate the simultaneous
sulfide oxidation and denitrification performance of an UFBR.
The UFBR was operated with NO3
−
and HS−
loading rates of
44 mg N/L/day and 252 mg S/L/day, respectively, in period 1
(days 365–398). The HRTwas 9 h. Although almost no nitrate
was observed, nitrite concentration sometimes exceeded
3 mg N/L (Fig. 2a) in the effluent. While the influent and
effluent total alkalinity concentrations were comparable, the
influent and effluent pH values were about 7.7 and 9.5, re-
spectively, until day 400 (Fig. 2b). The average nitrogen re-
moval efficiency between days 365 and 400 was about
88 ± 7.5 % (Table 2). On day 390, the influent part of the
reactor was clogged due to the accumulation of sulfur particles
generated as a result of sulfide oxidation in the reactor. The
accumulated sulfur particles were removed by withdrawing
30 ml of the reactor’s content from the bottom. The white
and pale yellow elemental sulfur particles were qualitatively
analyzed and compared with commercial sulfur pellets. The
results showed that they have same UV spectra (data not
shown). In the subsequent days, the nitrogen removal efficien-
cy decreased to 69 % (Fig. 3) and the effluent nitrite concen-
tration increased up to 5.23 mg N/L (Fig. 2a) presumably due
to the oxygen penetration to the reactor and the loss of some
active biomass along with removed sulfur particles.
In period 1, the average sulfide removal rate and efficiency
were 244 mg S/L/day and 97 ± 2 %, respectively (Table 2).
The average nitrogen removal rate was 39 mg N/L/day. In
addition, only 6 ± 1.8 % of the sulfide was oxidized to sulfate.
It proved that the major product of the denitrifying sulfide
oxidation process in the UFBR was elemental sulfur. In period
1, the effluent sulfide concentration was usually below
5 mg S/L and 94 ± 1.9 % of the influent sulfide was oxidized
to elemental sulfur (Fig. 4a). Furthermore, it was calculated
that about 80 ± 5 % of the electrons released from sulfide and
sulfur oxidations were consumed in denitrification process.
The electron balance, nitrogen, and sulfide removal efficien-
cies are given in Table 2. The theoretical gas production was
comparable to the measured gas production and the average
daily gas production rate was 8.8 ± 0.7 mL (Fig. 4b).
942 Appl Microbiol Biotechnol (2016) 100:939–948
In period 2 (days 398–434), the flow rate was increased and
thus the HRT decreased from 9 to 4 h. The sulfide and nitro-
gen loading rates increased to 582 mg S/L/day and 102 mg N/
L/day, respectively. After this alteration, the nitrogen removal
efficiency suddenly dropped from 98 to 45 %. Subsequently,
within 2 days, it restored back to 82 % and within 8 days
exceeded 95 % (Fig. 3). Similarly, the pH also responded
quickly to decreasing HRT and dropped from 9.5 to 8.5
(Fig. 2b).
On day 409, the feeding was stopped and the inlet of the
reactor was cleaned once again because of clogging. Besides,
on the next day the UFBR could not be fed due to a mechan-
ical problem related to the feeding pump. Therefore, the nitro-
gen removal efficiency sharply dropped from 97 to 34 %
(Fig. 3). Effluent NO3 and NO2 increased up to 6 and
5 mg N/L, respectively, on day 411 (Fig. 2a). Similar but less
serious clogging problems were encountered again on days
417 and 430, which resulted in fluctuating nitrogen removal
efficiencies (63–78 %) (Fig. 3).
In periods 1 and 2, although the effluent sulfide concentra-
tion was usually below 5 mg S/L (Fig. 4a) with removal effi-
ciency above 95 %, the nitrogen removal efficiency fluctuated
at lower levels and sometimes dropped sharply because of
clogging-related problems caused by the accumulation of in-
soluble sulfur particles at the bottom of UFBR. The inlet of
UFBR was emptied partially several times to remove the ac-
cumulated sulfur particles. During each cleaning, oxygen,
which is an alternative electron acceptor, was introduced to
the system. Consequently, sulfide-based denitrification effi-
ciency dropped for a few days until appropriate conditions
were re-maintained. In period 2, the average nitrogen and
sulfide removal efficiencies were 78 ± 18 % and 90 ± 11 %,
respectively (Fig. 3). The nitrogen and sulfide removal rates
were 80 mg N/L/day and 531 mg S/L/day, respectively. Con-
sidering the amount of sulfate generated, it was calculated that
about 91 % of the removed sulfide was oxidized to elemental
sulfur and 74 ± 11 % of the electrons donated by sulfide and
elemental sulfur were accepted by the autotrophic denitrifica-
tion process (Table 2). The theoretically calculated and
Table 2 Average removal efficiencies and electron balance of UFBR
Period Day %N removal % HS−
removal %Electron balance
1 365–398 88 ± 7.5 97 ± 2 80 ± 5
2 398–434 78 ± 18.8 90 ± 11 74 ± 11
3A 434–448 97 ± 1 98 ± 1 89 ± 6
3B 448–470 96 ± 6.5 97 ± 2 108 ± 13
Fig. 2 a Influent and effluent
NO3
−
and NO2
−
concentrations. b
Influent and effluent pH and
alkalinity
Appl Microbiol Biotechnol (2016) 100:939–948 943
measured gas production values did not overlap perfectly be-
cause of the frequent clogging problem in this period
(Fig. 4b).
Performance of UFBR fed with sulfide scrubbed
from biogas
In period 3A (days 434–448), the H2S was absorbed from the
biogas using an alkaline scrubbing solution prepared with tap
water. The scrubbing operation was terminated at pH of
around 8.2, where 92 % of the total sulfide was in the form
of HS−
, not to strip the scrubbed sulfide out. Above 95 % of
the H2S was absorbed from the biogas. The 62 % CH4 and
38 % CO2 in the biogas were determined as 73 ± 3 % and
27 ± 4 % after scrubbing, respectively. It shows that about
29 % of CO2 was absorbed in the scrubbing liquid.
In this period, the nitrogen and sulfide loading rates were
98.28 mg N/L/day and 541 mg S/L/day, respectively. Almost
Fig. 3 Sulfide and nitrogen
removal efficiencies
Fig. 4 a Influent and effluent
sulfide and sulfate concentrations.
b Theoretical and measured gas
production
944 Appl Microbiol Biotechnol (2016) 100:939–948
no nitrite and nitrate were determined in the effluent. The
nitrogen and sulfide removal efficiencies were 97 ± 1 % and
98 ± 1 %, respectively (Fig. 3). In addition, 89 ± 6 % of the
electrons liberated from the sulfide and elemental sulfur oxi-
dations were used for denitrification and 94 ± 3 % of the
removed sulfide oxidized to elemental sulfur. The effluent
sulfate concentration was 5.6 ± 0.8 mg S/L (Fig. 4a).
The pH in the bottom of the UFBR was 8.2 ± 0.1, and it
was maintained without using any external buffer. According
to our calculations, 1.5 % of the absorbed CO2 from biogas
was absorbed as carbonic acid (H2CO3) and 98 % as bicar-
bonate (HCO3
−
) at pH 8.2 and provided a strong buffer. Al-
though no external pH buffer was used and the influent pH of
8.2 was higher than in periods 1 and 2, the effluent pH sharply
dropped from about 9.2 to 8.8 with the beginning of period
3A. Astonishingly, no serious clogging problem was encoun-
tered during periods 3A and B.
In period 3B (days 448–470), the effluent of UFBR was
used for preparing scrubbing liquid instead of tap water. In
practice, the use of UFBR effluent may considerably decrease
the water consumption for desulfurization of biogas.
A small amount of nitrite was determined in the influent
just after starting to use the UFBR effluent in scrubbing and
feeding the scrubbing liquid to the reactor. Meanwhile, the
effluent nitrite concentration increased day by day as the ef-
fluent was repeatedly used (Fig. 2a). At last, it was ascertained
that the ammonium added in excess amount to the feed solu-
tion exits the UFBR and is partially nitrified in the effluent
bottle. Because of the unexpected nitrogen load coming along
with the UFBR effluent, the influent sulfide concentration,
which was adjusted according to S/N ratio of 2.5, did not
provide enough electrons for complete denitrification. There-
fore, the effluent nitrite concentration elevated up to 6.1 mg N/
L on day 455 (Fig. 2a). As a solution, NH4Cl was excluded
from the feed from day 455. Subsequently, the partial nitrifi-
cation was avoided in the effluent bottle. In the meantime, the
total alkalinity gradually increased within 23 days in the ef-
fluent of UFBR which was repeatedly used as scrubbing liq-
uid (Fig. 2b). However, no adverse effect of increasing alka-
linity up to 20 g/L was experienced on the performance of
UFBR.
In period 3B, the amount of the biogas used in the scrub-
bing experiments decreased because of an operational prob-
lem in the chicken manure digester. In this period, the amount
of H2S absorbed from the biogas was not adequate to provide
100 mg/L HS−
concentration in the feed solution; therefore,
some amount of sodium sulfide was added externally. As a
result, the final pH of the scrubbing liquid and thus the feed
solution increased to about 9.
Some portion of the CO2 absorbed by scrubbing liquid was
released to the headspace of UFBR when the influent pH was
8 in period 3A (Fig. 4b). Therefore, the daily measured gas
production was 5.5 mL higher than the theoretical gas
production in this period. In period 3B, where the influent
pH was 9, less CO2 was released to the headspace and thus
the average amount of calculated and measured N2 gas were
30.6 ± 4 mL/day and 29.8 ± 5.5 mL/day, respectively
(Fig. 4b).
To prove that the only source of N2 was the denitrification
process, not the N2 dissolved in the feed solution, an abiotic
control test was conducted by feeding the UFBR under the
same conditions. The amount of N2 released to the headspace
of the reactor was negligible.
In period 3B, the sulfide and nitrogen removal efficiencies
were 97 ± 2 % and 96 ± 6 % while the nitrogen and sulfide
removal rates were 116 mg N/L/day and 528 mg S/L/day,
respectively. The number of electrons consumed in denitrifi-
cation was higher than the one donated by sulfide and elemen-
tal sulfur (Table 2). It indicates that there were some other
electron donors such as thiosulfate, sulfite, and polysulfide
in the system. Using the UFBR effluent recurrently as scrub-
bing liquid might result in accumulation of reduced sulfur
species in the reactor.
Discussion
Performance of UFBR with synthetic feed solution
In period 1, although no nitrate was observed in the effluent,
complete denitrification was not achieved at 9 h HRT and
nitrite concentrations were above 3 mg N/L in the effluent.
Lee and Rittmann (2003) reported that nitrite tends to accu-
mulate in denitrification systems at alkaline pH values (pH
9). In this period, the effluent pH values were generally
above 9 due to the partial oxidation of sulfide to elemental
sulfur (Fig. 2b). It was reported that the oxidation of sulfide to
elemental sulfur produces alkalinity (Moraes et al. 2012;
Sahinkaya et al. 2011). In period 1, the average nitrogen re-
moval efficiency was 88 ± 7.5 % (Table 2). However, this
result contradicts with the finding of Oh et al. (2000) which
shows the complete inhibition of denitrification at pH of 9. On
the other hand, the results were consistent with the conclu-
sions of Mahmood et al. (2008) about the complete autotro-
phic denitrification at a wide range of pH values (5–11).
In period 2, sulfide and nitrogen loading rates increased to
582 mg S/L/day and 102 mg N/L/day, respectively, by de-
creasing the HRT from 9 to 4 h. The sulfide oxidation and
denitrification efficiencies dropped immediately when nitro-
gen and sulfide loading rates increased. However, both sulfide
oxidation and denitrification efficiencies restored back within
8 days. In addition, the effluent pH decreased to 8.5 (Fig. 2b).
Likewise, Cai et al. (2008) found that a shock load, which
halved the HRT, considerably affected the reactor pH and
sulfide oxidation efficiency its detrimental effect did not last
very long.
Appl Microbiol Biotechnol (2016) 100:939–948 945
During periods 1 and 2, the denitrification efficiency was
highly affected by clogging problems related to accumulated
sulfur particles at the bottom of the UFBR. The sulfur particles
were cleaned each time by emptying the inlet of the reactor.
Although the denitrification efficiency dropped after each
cleaning procedure, the sulfide oxidation performance was
not affected due to the intrusion of oxygen, which is a
stronger electron acceptor than nitrate. Similarly, clogging
problem was also reported by Fortuny et al. (2008) in a sulfide
oxidizing biotrickling reactor supplied with oxygen instead of
nitrate as electron acceptor. In another study, significant
amounts of elemental sulfur settled and recovered from an
expanded granular sludge bed reactor (Dinamarca 2014).
Therefore, suspended growth type reactors may be a good
alternative to avoid the clogging problem and separate the
produced elemental sulfur from the reactor. In this period,
the main product of sulfide oxidation was elemental sulfur.
Only about 7 % of the sulfide was oxidized to sulfate. In
another study in which the S/N ratio was 2.5, similarly
8.6 % of the incoming sulfide was oxidized to sulfate (Cai
et al. 2008).
Performance of UFBR with scrubbed sulfide
In periods 3A and B, hydrogen sulfide, produced by a labora-
tory scale anaerobic chicken manure digester, was scrubbed and
then the scrubbing liquid was fed to the UFBR. Above 95 % of
the hydrogen sulfide was absorbed from the biogas in batch
scrubbing tests by keeping the final pH of the scrubbing liquid
at around 8.2. Almost complete H2S absorption was reported
by Krischan et al. (2012) by maintaining the pH above 7.7.
In our scrubbing tests, similar to the finding of Baciocchi
et al. 2013 about 29 % of the CO2 in biogas was absorbed in
the scrubbing liquid. In periods 3A and B, the average nitrate
and sulfide removal efficiencies were above 96 % and
97 ± 1 %, respectively (Fig. 3).
The high denitrification efficiencies achieved in periods 3A
and B were attributed to the suitable pH level in the UFBR
and/or diminishing clogging problem due to the solubilization
of biologically produced elemental sulfur. In period 3, al-
though the influent pH was higher than in periods 1 and 2,
the lowest effluent pH values below 9 were observed except
the days in which extra sodium sulfide was added to the feed-
ing solution. It is known that sulfide oxidation-based denitri-
fication takes place at a pH in the range of 5–11, but some
disturbances occur above pH 9 (Mahmood et al. 2008).
In periods 3A and B, less clogging was experienced be-
cause the solubility of biologically produced sulfur particles
increased when the scrubbing liquid having a pH above 8 was
fed to the UFBR. It was reported that the solubility of biolog-
ically produced sulfur particles increases along with the rising
pH in the presence of sulfide due to the formation of soluble
polysulfides (Findlay et al. 2014).
In period 3B, the number of electrons donated by
sulfide and elemental sulfur was less than the electrons
consumed in denitrification (Table 2). The reason of the
gap in the electron balance might be related to other
intermediate sulfur species such as thiosulfate, sulfite,
and polysulfides, which might be generated in the
UFBR and repeatedly recirculated when the effluent
was used as scrubbing liquid and fed back to the
reactor. Kleinjan et al. (2005) reported that the polysul-
fide ions might cause the dissolution of elemental sulfur
into an aqueous sulfide solution. In another study, it
was reported that polysulfide can be used as electron
donor and oxidized to thiosulfate, which was not mon-
itored in our study (Bosch et al. 2007).
Comparable measured and theoretical gas production
values and no ammonia generation (data not shown)
throughout the study proved that nitrate was removed
by autotrophic denitrification, not via dissimilatory ni-
trate reduction. These results, obtained at 2.5 mol/mol
S/N ratio, contradict with the findings of Dolejs et al.
(2014). They reported that dissimilatory nitrate reduction
to ammonia occurred when S/N ratio was higher than
1.3 mol/mol. It is known that sulfide ions interfere with
nesslerization method used in the determination of am-
monia (Hach 8038). Therefore, the ammonia production ob-
served by Dolejs et al. (2014) might be related to the interfer-
ence of the residual sulfide on ammonia analyses.
In the literature, there are similar studies for simultaneous
removal of hydrogen sulfide and nitrate in single-stage
biotrickling filters and bioscrubbers (Baspinar et al. 2011;
FernĂĄndez et al. 2014). In these single-stage processes, scrub-
bing of H2S and biodesulfurization take place in the same
reactor. Although the process tested in this study consists of
two stages, it has some advantages over single-stage processes
mentioned above. In single-stage biodesulfurization process-
es, as electron acceptor if nitrate is used, the nitrogen gas is
produced during denitrification and if air is used, unconsumed
oxygen and inert nitrogen gas leaving the reactor may cause
the dilution of the biogas and decrease its calorific value.
Besides, if the sulfide bio-oxidation process is inhibited for
any reason, because there is no separate scrubber unit, the H2S
removal is not achieved efficiently.
Finally, it is concluded that above 98 % sulfide and 97 %
nitrate were removed simultaneously in an upflow fixed bed
autotrophic denitrification reactor fed with the H2S absorbed
from the biogas of an anaerobic digester. The optimum oper-
ation pH of the reactor was determined in the range of 8–9
while severe clogging problems because of elemental sulfur
accumulation were observed at lower pH levels. The effluent
of UFBR was repeatedly used as scrubbing liquid without any
problem up to 20 g CaCO3/L total alkalinity. By using the
effluent of the UFBR, a significant reduction may be achieved
in the alkaline consumption in the scrubber.
946 Appl Microbiol Biotechnol (2016) 100:939–948
Acknowledgments This work was financially supported by Marmara
University Scientific Research Committee BAPKO (Project No. FEN-A-
100713-0323).
Compliance with ethical standards
Funding This study was funded by Marmara University Scientific Re-
search Committee BAPKO (Project No. FEN-A-100713-0323).
Conflict of interest The authors declare that they have no competing
interests.
Ethical approval This article does not contain any studies with human
participants or animals performed by any of the authors.
References
APHA (2005) Standard methods for the examination of water and waste-
water. APHA-AWWA-WEF, Washington, D.C.
Baciocchi R, Carnevale E, Corti A, Costa G, Lombardi L, Olivieri T,
Zanchi L, Zingaretti D (2013) Innovative process for biogas
upgrading with CO2 storage: results from pilot plant opera-
tion. Biomass Bioenergy 53(0):128–137. doi:10.1016/j.
biombioe.2012.11.016
Baspinar AB, Turker M, Hocalar A, Ozturk I (2011) Biogas
desulphurization at technical scale by lithotrophic denitrification:
integration of sulphide and nitrogen removal. Process Biochem
46(4):916–922. doi:10.1016/j.procbio.2011.01.001
Bosch PLF, Beusekom OC, Buisman CJN, Janssen AJH (2007) Sulfide
oxidation at halo-alkaline conditions in a fed-batch bioreactor.
Biotechnol Bioeng 97(5):1053–1063
Cai J, Zheng P, Mahmood Q (2008) Effect of sulfide to nitrate ratios on
the simultaneous anaerobic sulfide and nitrate removal. Bioresour
Technol 99(13):5520–5527. doi:10.1016/j.biortech.2007.10.053
Chen L, Huang J, Yang C-L (2001) Absorption of H2S in NaOCl caustic
aqueous solution. Environ Prog 20(3):175–181. doi:10.1002/ep.
670200313
Chen Y, Fan Z, Ma L, Yin J, Luo M, Cai W (2014) Performance of three
pilot-scale immobilized-cell biotrickling filters for removal of hy-
drogen sulfide from a contaminated air steam. Saudi J Biol Sci (0)
doi:10.1016/j.sjbs.2014.05.008
Cirne DG, Van Der Zee FP, Fernandez-Polanco M, Fernandez-Polanco F
(2008) Control of sulphide during anaerobic treatment of S-
containing wastewaters by adding limited amounts of oxygen or
nitrate. Rev Environ Sci Biotechnology 7(2):93–105
Cord-Ruwisch R (1985) A quick method for the determination of dis-
solved and precipitated sulfides in cultures of sulfate-reducing bac-
teria. J Microbiol Methods 4(1):33–36. doi:10.1016/0167-7012(85)
90005-3
Deublein D, Steinhauser A (2011) Biogas from waste and renewable
resources: an introduction. John Wiley  Sons
DĂ­az I, Lopes AC, PĂ©rez SI, Fdz-Polanco M (2010) Performance evalu-
ation of oxygen, air and nitrate for the microaerobic removal of
hydrogen sulphide in biogas from sludge digestion. Bioresour
Technol 101(20):7724–7730. doi:10.1016/j.biortech.2010.04.062
Dinamarca C (2014) Anaerobic expanded granular sludge bed (EGSB)
reactor for the removal of sulphide by autotrophic denitrification.
Journal Homepage: www IJEE IEEFoundation org 5(1):111–118
Dolejs P, PaclĂ­k L, Maca J, Pokorna D, Zabranska J, Bartacek J (2014)
Effect of S/N ratio on sulfide removal by autotrophic denitrification.
Appl Microbiol Biotechnol: 1-10
FernĂĄndez-RodrĂ­guez J, PĂ©rez M, Romero L (2015) Temperature-phased
anaerobic digestion of industrial organic fraction of municipal solid
waste: a batch study. Chem Eng J 270:597–604
FernĂĄndez M, RamĂ­rez M, GĂłmez JM, Cantero D (2014) Biogas
biodesulfurization in an anoxic biotrickling filter packed with
open-pore polyurethane foam. J Hazard Mater 264(0):529–535.
doi:10.1016/j.jhazmat.2013.10.046
FernĂĄndez N, Sierra-Alvarez R, Field JA, Amils R, Sanz JL (2008)
Microbial community dynamics in a chemolithotrophic deni-
trification reactor inoculated with methanogenic granular
sludge. Chemosphere 70(3):462–474. doi:10.1016/j.
chemosphere.2007.06.062
Findlay AJ, Gartman A, MacDonald DJ, Hanson TE, Shaw TJ, Luther
GW (2014) Distribution and size fractionation of elemental
sulfur in aqueous environments: the Chesapeake Bay and
Mid-Atlantic Ridge. Geochim Cosmochim Acta (0) doi:10.
1016/j.gca.2014.07.032
Fonoll X, Astals S, Dosta J, Mata-Alvarez J (2015) Anaerobic co-
digestion of sewage sludge and fruit wastes: evaluation of the tran-
sitory states when the co-substrate is changed. Chem Eng J 262:
1268–1274
Fortuny M, Baeza JA, Gamisans X, Casas C, Lafuente J, Deshusses MA,
Gabriel D (2008) Biological sweetening of energy gases mimics in
biotrickling filters. Chemosphere 71(1):10–17. doi:10.1016/j.
chemosphere.2007.10.072
Guerrero RB, Bevilaqua D (2015) Biotrickling filtration of biogas pro-
duced from the wastewater treatment plant of a brewery. J Environ
Eng
Kleinjan WE, de Keizer A, Janssen AJH (2005) Kinetics of the reaction
between dissolved sodium sulfide and biologically produced sulfur.
Ind Eng Chem Res 44(2):309–317. doi:10.1021/ie049579q
Ko JH, Xu Q, Jang Y-C (2015) Emissions and control of hydrogen sulfide
at landfills: a review. Critical Reviews in Environmental Science and
Technology (just-accepted):00–00
Krischan J, Makaruk A, Harasek M (2012) Design and scale-up of an
oxidative scrubbing process for the selective removal of hydrogen
sulfide from biogas. J Hazard Mater 215–216(0):49–56. doi:10.
1016/j.jhazmat.2012.02.028
Lee K-C, Rittmann BE (2003) Effects of pH and precipitation on
autohydrogenotrophic denitrification using the hollow-fiber mem-
brane-biofilm reactor. Water Res 37(7):1551–1556. doi:10.1016/
S0043-1354(02)00519-5
LĂłpez ME, Rene ER, Veiga MC, Kennes C (2012) Biogas technologies
and cleaning techniques environmental chemistry for a sustainable
world. Springer, pp 347-377
Mahmood Q, Zheng P, Hayat Y, Islam E, Wu D, Ren-cun J (2008) Effect
of pH on anoxic sulfide oxidizing reactor performance. Bioresour
Technol 99(8):3291–3296. doi:10.1016/j.biortech.2007.07.006
Montebello AM, FernĂĄndez M, Almenglo F, RamĂ­rez M, Cantero D,
Baeza M, Gabriel D (2012) Simultaneous methylmercaptan and
hydrogen sulfide removal in the desulfurization of biogas in aerobic
and anoxic biotrickling filters. Chem Eng J 200–202(0):237–246.
doi:10.1016/j.cej.2012.06.043
Moraes BS, Souza TSO, Foresti E (2012) Effect of sulfide concentration
on autotrophic denitrification from nitrate and nitrite in vertical
fixed-bed reactors. Process Biochem 47(9):1395–1401. doi:10.
1016/j.procbio.2012.05.008
Nowicki P, Skibiszewska P, Pietrzak R (2014) Hydrogen sulphide re-
moval on carbonaceous adsorbents prepared from coffee in-
dustry waste materials. Chem Eng J 248(0):208–215. doi:10.
1016/j.cej.2014.03.052
Oh S, Kim K, Choi H, Cho J, Kim I (2000) Kinetics and physiological
characteristics of autotrophic dentrification by denitrifying sulfur
bacteria. Water Sci Technol 42(3–4):59–68
Petersson A, WeLLInGer A (2009) Biogas upgrading technologies—de-
velopments and innovations. IEA Bioenergy 20
Appl Microbiol Biotechnol (2016) 100:939–948 947
Potivichayanon S, Pokethitiyook P, Kruatrachue M (2006) Hydrogen
sulfide removal by a novel fixed-film bioscrubber system. Process
Biochem 41(3):708–715. doi:10.1016/j.procbio.2005.09.006
Ramos I, Fdz-Polanco M (2014) Microaerobic control of biogas sulphide
content during sewage sludge digestion by using biogas production
and hydrogen sulphide concentration. Chem Eng J 250(0):303–311.
doi:10.1016/j.cej.2014.04.027
Rodriguez G, Dorado AD, Fortuny M, Gabriel D, Gamisans X (2014)
Biotrickling filters for biogas sweetening: oxygen transfer improve-
ment for a reliable operation. Process Saf Environ Prot 92(3):261–
268. doi:10.1016/j.psep.2013.02.002
Sahinkaya E, Hasar H, Kaksonen AH, Rittmann BE (2011) Performance
of a sulfide-oxidizing, sulfur-producing membrane biofilm reactor
treating sulfide-containing bioreactor effluent. Environ Sci Technol
45(9):4080–4087. doi:10.1021/es200140c
Sahinkaya E, Kilic A, Duygulu B (2014) Pilot and full scale applications
of sulfur-based autotrophic denitrification process for nitrate remov-
al from activated sludge process effluent. Water Res 60(0):210–217.
doi:10.1016/j.watres.2014.04.052
Sahinkaya E, Yurtsever A, AktaƟ Ö, Ucar D, Wang Z (2015) Sulfur-based
autotrophic denitrification of drinking water using a membrane bio-
reactor. Chem Eng J 268(0):180–186. doi:10.1016/j.cej.2015.01.
045
Shang G, Shen G, Liu L, Chen Q, Xu Z (2013) Kinetics and mechanisms
of hydrogen sulfide adsorption by biochars. Bioresour Technol
133(0):495–499. doi:10.1016/j.biortech.2013.01.114
Syed M, Soreanu G, Falletta P, BĂ©land M (2006) Removal of hydrogen
sulfide from gas streams using biological processes—a review. Can
Biosyst Eng 48:2
Tafdrup S (1995) Viable energy production and waste recycling from
anaerobic digestion of manure and other biomass materials.
Biomass Bioenergy 9(1):303–314
Tang K, Baskaran V, Nemati M (2009) Bacteria of the sulphur cycle: an
overview of microbiology, biokinetics and their role in petroleum
and mining industries. Biochem Eng J 44(1):73–94
Üresin E, Saraç HÄ°, Sarıoğlan A, Ay ƞ, AkgĂŒn F (2014) An experimental
study for H2S and CO2 removal via caustic scrubbing system.
Process Safety and Environmental Protection (0) doi:10.1016/j.
psep.2014.06.013
YĂŒcel M, Konovalov SK, Moore TS, Janzen CP, Luther Iii GW (2010)
Sulfur speciation in the upper black sea sediments. Chem Geol
269(3–4):364–375. doi:10.1016/j.chemgeo.2009.10.010
Zhang TC, Lampe DG (1999) Sulfur:limestone autotrophic denitrifica-
tion processes for treatment of nitrate-contaminated water: batch
experiments. Water Res 33(3):599–608. doi:10.1016/S0043-
1354(98)00281-4
948 Appl Microbiol Biotechnol (2016) 100:939–948

More Related Content

What's hot

Novak2012
Novak2012Novak2012
Novak2012tho hoang
 
A05401010
A05401010A05401010
A05401010inventy
 
Oily wastewater treatment using polyamide thin film composite membrane
Oily wastewater treatment using polyamide thin film composite membraneOily wastewater treatment using polyamide thin film composite membrane
Oily wastewater treatment using polyamide thin film composite membraneMedhat Elzahar
 
29103278 water-treatment-technology-tas-3010-lecture-notes-3-water-chemistry
29103278 water-treatment-technology-tas-3010-lecture-notes-3-water-chemistry29103278 water-treatment-technology-tas-3010-lecture-notes-3-water-chemistry
29103278 water-treatment-technology-tas-3010-lecture-notes-3-water-chemistryStephen Siwila
 
Hydrochar for-industrial-wastewater-treatment-an-overview-on-its-advantages-a...
Hydrochar for-industrial-wastewater-treatment-an-overview-on-its-advantages-a...Hydrochar for-industrial-wastewater-treatment-an-overview-on-its-advantages-a...
Hydrochar for-industrial-wastewater-treatment-an-overview-on-its-advantages-a...Ahmed Hasham
 
Developed method for treatment of industrial wastewater from edible oil indus...
Developed method for treatment of industrial wastewater from edible oil indus...Developed method for treatment of industrial wastewater from edible oil indus...
Developed method for treatment of industrial wastewater from edible oil indus...Medhat Elzahar
 
Study of abiotic factors across the brahmaputra belt in relation to its suita...
Study of abiotic factors across the brahmaputra belt in relation to its suita...Study of abiotic factors across the brahmaputra belt in relation to its suita...
Study of abiotic factors across the brahmaputra belt in relation to its suita...eSAT Journals
 
G04813741
G04813741G04813741
G04813741IOSR-JEN
 
Development of an experimental rig for bioremediation studies
Development of an experimental rig for bioremediation studiesDevelopment of an experimental rig for bioremediation studies
Development of an experimental rig for bioremediation studiesAlexander Decker
 
Existing biological nitrogen removal processes and current scope of advancement
Existing biological nitrogen removal processes and current scope of advancementExisting biological nitrogen removal processes and current scope of advancement
Existing biological nitrogen removal processes and current scope of advancementSandip Magdum
 
Ammonia Recovery using membrane distillation
Ammonia Recovery using membrane distillationAmmonia Recovery using membrane distillation
Ammonia Recovery using membrane distillationChristos Charisiadis
 
Ab04603165169
Ab04603165169Ab04603165169
Ab04603165169IJERA Editor
 
74.three digestion methods to determine concentrations of cu, zn, cd, ni, pb,...
74.three digestion methods to determine concentrations of cu, zn, cd, ni, pb,...74.three digestion methods to determine concentrations of cu, zn, cd, ni, pb,...
74.three digestion methods to determine concentrations of cu, zn, cd, ni, pb,...Alexandra Vasile
 
DNAPL Remediation with ClO2_UV-published paper
DNAPL Remediation with ClO2_UV-published paperDNAPL Remediation with ClO2_UV-published paper
DNAPL Remediation with ClO2_UV-published paperDarcy Bye
 
Sludge Volume Index (SVI)
Sludge Volume Index (SVI)Sludge Volume Index (SVI)
Sludge Volume Index (SVI)Vishal Chaudhari
 
Chemical Oxygen Demand
Chemical Oxygen DemandChemical Oxygen Demand
Chemical Oxygen DemandMuhd Effandi
 

What's hot (20)

Novak2012
Novak2012Novak2012
Novak2012
 
A05401010
A05401010A05401010
A05401010
 
Ijciet 10 01_050
Ijciet 10 01_050Ijciet 10 01_050
Ijciet 10 01_050
 
Oily wastewater treatment using polyamide thin film composite membrane
Oily wastewater treatment using polyamide thin film composite membraneOily wastewater treatment using polyamide thin film composite membrane
Oily wastewater treatment using polyamide thin film composite membrane
 
Practical on BOD
Practical on BOD Practical on BOD
Practical on BOD
 
29103278 water-treatment-technology-tas-3010-lecture-notes-3-water-chemistry
29103278 water-treatment-technology-tas-3010-lecture-notes-3-water-chemistry29103278 water-treatment-technology-tas-3010-lecture-notes-3-water-chemistry
29103278 water-treatment-technology-tas-3010-lecture-notes-3-water-chemistry
 
Hydrochar for-industrial-wastewater-treatment-an-overview-on-its-advantages-a...
Hydrochar for-industrial-wastewater-treatment-an-overview-on-its-advantages-a...Hydrochar for-industrial-wastewater-treatment-an-overview-on-its-advantages-a...
Hydrochar for-industrial-wastewater-treatment-an-overview-on-its-advantages-a...
 
Developed method for treatment of industrial wastewater from edible oil indus...
Developed method for treatment of industrial wastewater from edible oil indus...Developed method for treatment of industrial wastewater from edible oil indus...
Developed method for treatment of industrial wastewater from edible oil indus...
 
Phosphate
PhosphatePhosphate
Phosphate
 
Study of abiotic factors across the brahmaputra belt in relation to its suita...
Study of abiotic factors across the brahmaputra belt in relation to its suita...Study of abiotic factors across the brahmaputra belt in relation to its suita...
Study of abiotic factors across the brahmaputra belt in relation to its suita...
 
G04813741
G04813741G04813741
G04813741
 
20120140503008 2
20120140503008 220120140503008 2
20120140503008 2
 
Development of an experimental rig for bioremediation studies
Development of an experimental rig for bioremediation studiesDevelopment of an experimental rig for bioremediation studies
Development of an experimental rig for bioremediation studies
 
Existing biological nitrogen removal processes and current scope of advancement
Existing biological nitrogen removal processes and current scope of advancementExisting biological nitrogen removal processes and current scope of advancement
Existing biological nitrogen removal processes and current scope of advancement
 
Ammonia Recovery using membrane distillation
Ammonia Recovery using membrane distillationAmmonia Recovery using membrane distillation
Ammonia Recovery using membrane distillation
 
Ab04603165169
Ab04603165169Ab04603165169
Ab04603165169
 
74.three digestion methods to determine concentrations of cu, zn, cd, ni, pb,...
74.three digestion methods to determine concentrations of cu, zn, cd, ni, pb,...74.three digestion methods to determine concentrations of cu, zn, cd, ni, pb,...
74.three digestion methods to determine concentrations of cu, zn, cd, ni, pb,...
 
DNAPL Remediation with ClO2_UV-published paper
DNAPL Remediation with ClO2_UV-published paperDNAPL Remediation with ClO2_UV-published paper
DNAPL Remediation with ClO2_UV-published paper
 
Sludge Volume Index (SVI)
Sludge Volume Index (SVI)Sludge Volume Index (SVI)
Sludge Volume Index (SVI)
 
Chemical Oxygen Demand
Chemical Oxygen DemandChemical Oxygen Demand
Chemical Oxygen Demand
 

Similar to Article 4.pdf

Sipma, 2004, Effect Of Carbon Monoxide, Hydrogen And Sulfate On Thermophilic ...
Sipma, 2004, Effect Of Carbon Monoxide, Hydrogen And Sulfate On Thermophilic ...Sipma, 2004, Effect Of Carbon Monoxide, Hydrogen And Sulfate On Thermophilic ...
Sipma, 2004, Effect Of Carbon Monoxide, Hydrogen And Sulfate On Thermophilic ...roelmeulepas
 
Optimization of Na-Alginate Immobilization Method for Sulfide Oxidation Using...
Optimization of Na-Alginate Immobilization Method for Sulfide Oxidation Using...Optimization of Na-Alginate Immobilization Method for Sulfide Oxidation Using...
Optimization of Na-Alginate Immobilization Method for Sulfide Oxidation Using...Premier Publishers
 
A green synthesis of isatoic anhydrides from isatins with urea–hydrogen perox...
A green synthesis of isatoic anhydrides from isatins with urea–hydrogen perox...A green synthesis of isatoic anhydrides from isatins with urea–hydrogen perox...
A green synthesis of isatoic anhydrides from isatins with urea–hydrogen perox...fer18400
 
Choi2016
Choi2016Choi2016
Choi2016Hameed66
 
Msc thesis defence power point
Msc thesis defence power pointMsc thesis defence power point
Msc thesis defence power pointISHAQ SULAIMAN MUKTAR
 
International Journal of Engineering and Science Invention (IJESI)
International Journal of Engineering and Science Invention (IJESI)International Journal of Engineering and Science Invention (IJESI)
International Journal of Engineering and Science Invention (IJESI)inventionjournals
 
Novel approach to synthesis of pentofurano nucleoside assisted natural phosph...
Novel approach to synthesis of pentofurano nucleoside assisted natural phosph...Novel approach to synthesis of pentofurano nucleoside assisted natural phosph...
Novel approach to synthesis of pentofurano nucleoside assisted natural phosph...Alexander Decker
 
COD reduction of aromatic polluted waste water by Advanced Oxidation Process ...
COD reduction of aromatic polluted waste water by Advanced Oxidation Process ...COD reduction of aromatic polluted waste water by Advanced Oxidation Process ...
COD reduction of aromatic polluted waste water by Advanced Oxidation Process ...Wade Bitaraf
 
Naphtha paper MMM 2011 vol 146
Naphtha paper MMM 2011 vol 146Naphtha paper MMM 2011 vol 146
Naphtha paper MMM 2011 vol 146vasudha agnihotri
 
Project Work
Project WorkProject Work
Project Workxiaobai xue
 
Study of the Sulfur Trioxide Generation Mechanism and Control Method Using We...
Study of the Sulfur Trioxide Generation Mechanism and Control Method Using We...Study of the Sulfur Trioxide Generation Mechanism and Control Method Using We...
Study of the Sulfur Trioxide Generation Mechanism and Control Method Using We...inventionjournals
 
Characterization of Rubber Seed Shell and Kernel (Hevea brasiliensis) as Raw ...
Characterization of Rubber Seed Shell and Kernel (Hevea brasiliensis) as Raw ...Characterization of Rubber Seed Shell and Kernel (Hevea brasiliensis) as Raw ...
Characterization of Rubber Seed Shell and Kernel (Hevea brasiliensis) as Raw ...CrimsonPublishersACSR
 
Granular Activated Crbon From Activated Sludge
Granular  Activated Crbon From Activated SludgeGranular  Activated Crbon From Activated Sludge
Granular Activated Crbon From Activated SludgePT Carbon Indonesia
 
SULFONATION OF BY SO3
SULFONATION OF BY SO3SULFONATION OF BY SO3
SULFONATION OF BY SO3IJARIIE JOURNAL
 

Similar to Article 4.pdf (20)

Sipma, 2004, Effect Of Carbon Monoxide, Hydrogen And Sulfate On Thermophilic ...
Sipma, 2004, Effect Of Carbon Monoxide, Hydrogen And Sulfate On Thermophilic ...Sipma, 2004, Effect Of Carbon Monoxide, Hydrogen And Sulfate On Thermophilic ...
Sipma, 2004, Effect Of Carbon Monoxide, Hydrogen And Sulfate On Thermophilic ...
 
Optimization of Na-Alginate Immobilization Method for Sulfide Oxidation Using...
Optimization of Na-Alginate Immobilization Method for Sulfide Oxidation Using...Optimization of Na-Alginate Immobilization Method for Sulfide Oxidation Using...
Optimization of Na-Alginate Immobilization Method for Sulfide Oxidation Using...
 
A green synthesis of isatoic anhydrides from isatins with urea–hydrogen perox...
A green synthesis of isatoic anhydrides from isatins with urea–hydrogen perox...A green synthesis of isatoic anhydrides from isatins with urea–hydrogen perox...
A green synthesis of isatoic anhydrides from isatins with urea–hydrogen perox...
 
Study of Pollutant Removal in Activated Sludge Process Using Lab Scale Plant ...
Study of Pollutant Removal in Activated Sludge Process Using Lab Scale Plant ...Study of Pollutant Removal in Activated Sludge Process Using Lab Scale Plant ...
Study of Pollutant Removal in Activated Sludge Process Using Lab Scale Plant ...
 
408madunavalkaj
408madunavalkaj408madunavalkaj
408madunavalkaj
 
E0262027035
E0262027035E0262027035
E0262027035
 
E0262027035
E0262027035E0262027035
E0262027035
 
Choi2016
Choi2016Choi2016
Choi2016
 
Msc thesis defence power point
Msc thesis defence power pointMsc thesis defence power point
Msc thesis defence power point
 
International Journal of Engineering and Science Invention (IJESI)
International Journal of Engineering and Science Invention (IJESI)International Journal of Engineering and Science Invention (IJESI)
International Journal of Engineering and Science Invention (IJESI)
 
Published paper
Published paperPublished paper
Published paper
 
Novel approach to synthesis of pentofurano nucleoside assisted natural phosph...
Novel approach to synthesis of pentofurano nucleoside assisted natural phosph...Novel approach to synthesis of pentofurano nucleoside assisted natural phosph...
Novel approach to synthesis of pentofurano nucleoside assisted natural phosph...
 
COD reduction of aromatic polluted waste water by Advanced Oxidation Process ...
COD reduction of aromatic polluted waste water by Advanced Oxidation Process ...COD reduction of aromatic polluted waste water by Advanced Oxidation Process ...
COD reduction of aromatic polluted waste water by Advanced Oxidation Process ...
 
Naphtha paper MMM 2011 vol 146
Naphtha paper MMM 2011 vol 146Naphtha paper MMM 2011 vol 146
Naphtha paper MMM 2011 vol 146
 
Project Work
Project WorkProject Work
Project Work
 
MAKENDRAN C
MAKENDRAN CMAKENDRAN C
MAKENDRAN C
 
Study of the Sulfur Trioxide Generation Mechanism and Control Method Using We...
Study of the Sulfur Trioxide Generation Mechanism and Control Method Using We...Study of the Sulfur Trioxide Generation Mechanism and Control Method Using We...
Study of the Sulfur Trioxide Generation Mechanism and Control Method Using We...
 
Characterization of Rubber Seed Shell and Kernel (Hevea brasiliensis) as Raw ...
Characterization of Rubber Seed Shell and Kernel (Hevea brasiliensis) as Raw ...Characterization of Rubber Seed Shell and Kernel (Hevea brasiliensis) as Raw ...
Characterization of Rubber Seed Shell and Kernel (Hevea brasiliensis) as Raw ...
 
Granular Activated Crbon From Activated Sludge
Granular  Activated Crbon From Activated SludgeGranular  Activated Crbon From Activated Sludge
Granular Activated Crbon From Activated Sludge
 
SULFONATION OF BY SO3
SULFONATION OF BY SO3SULFONATION OF BY SO3
SULFONATION OF BY SO3
 

Recently uploaded

Call Girls In Nihal Vihar Delhi ❀8860477959 Looking Escorts In 24/7 Delhi NCR
Call Girls In Nihal Vihar Delhi ❀8860477959 Looking Escorts In 24/7 Delhi NCRCall Girls In Nihal Vihar Delhi ❀8860477959 Looking Escorts In 24/7 Delhi NCR
Call Girls In Nihal Vihar Delhi ❀8860477959 Looking Escorts In 24/7 Delhi NCRlizamodels9
 
BUMI DAN ANTARIKSA PROJEK IPAS SMK KELAS X.pdf
BUMI DAN ANTARIKSA PROJEK IPAS SMK KELAS X.pdfBUMI DAN ANTARIKSA PROJEK IPAS SMK KELAS X.pdf
BUMI DAN ANTARIKSA PROJEK IPAS SMK KELAS X.pdfWildaNurAmalia2
 
Analytical Profile of Coleus Forskohlii | Forskolin .pptx
Analytical Profile of Coleus Forskohlii | Forskolin .pptxAnalytical Profile of Coleus Forskohlii | Forskolin .pptx
Analytical Profile of Coleus Forskohlii | Forskolin .pptxSwapnil Therkar
 
LIGHT-PHENOMENA-BY-CABUALDIONALDOPANOGANCADIENTE-CONDEZA (1).pptx
LIGHT-PHENOMENA-BY-CABUALDIONALDOPANOGANCADIENTE-CONDEZA (1).pptxLIGHT-PHENOMENA-BY-CABUALDIONALDOPANOGANCADIENTE-CONDEZA (1).pptx
LIGHT-PHENOMENA-BY-CABUALDIONALDOPANOGANCADIENTE-CONDEZA (1).pptxmalonesandreagweneth
 
FREE NURSING BUNDLE FOR NURSES.PDF by na
FREE NURSING BUNDLE FOR NURSES.PDF by naFREE NURSING BUNDLE FOR NURSES.PDF by na
FREE NURSING BUNDLE FOR NURSES.PDF by naJASISJULIANOELYNV
 
Grafana in space: Monitoring Japan's SLIM moon lander in real time
Grafana in space: Monitoring Japan's SLIM moon lander  in real timeGrafana in space: Monitoring Japan's SLIM moon lander  in real time
Grafana in space: Monitoring Japan's SLIM moon lander in real timeSatoshi NAKAHIRA
 
(9818099198) Call Girls In Noida Sector 14 (NOIDA ESCORTS)
(9818099198) Call Girls In Noida Sector 14 (NOIDA ESCORTS)(9818099198) Call Girls In Noida Sector 14 (NOIDA ESCORTS)
(9818099198) Call Girls In Noida Sector 14 (NOIDA ESCORTS)riyaescorts54
 
OECD bibliometric indicators: Selected highlights, April 2024
OECD bibliometric indicators: Selected highlights, April 2024OECD bibliometric indicators: Selected highlights, April 2024
OECD bibliometric indicators: Selected highlights, April 2024innovationoecd
 
Analytical Profile of Coleus Forskohlii | Forskolin .pdf
Analytical Profile of Coleus Forskohlii | Forskolin .pdfAnalytical Profile of Coleus Forskohlii | Forskolin .pdf
Analytical Profile of Coleus Forskohlii | Forskolin .pdfSwapnil Therkar
 
zoogeography of pakistan.pptx fauna of Pakistan
zoogeography of pakistan.pptx fauna of Pakistanzoogeography of pakistan.pptx fauna of Pakistan
zoogeography of pakistan.pptx fauna of Pakistanzohaibmir069
 
Volatile Oils Pharmacognosy And Phytochemistry -I
Volatile Oils Pharmacognosy And Phytochemistry -IVolatile Oils Pharmacognosy And Phytochemistry -I
Volatile Oils Pharmacognosy And Phytochemistry -INandakishor Bhaurao Deshmukh
 
Twin's paradox experiment is a meassurement of the extra dimensions.pptx
Twin's paradox experiment is a meassurement of the extra dimensions.pptxTwin's paradox experiment is a meassurement of the extra dimensions.pptx
Twin's paradox experiment is a meassurement of the extra dimensions.pptxEran Akiva Sinbar
 
Pests of castor_Binomics_Identification_Dr.UPR.pdf
Pests of castor_Binomics_Identification_Dr.UPR.pdfPests of castor_Binomics_Identification_Dr.UPR.pdf
Pests of castor_Binomics_Identification_Dr.UPR.pdfPirithiRaju
 
The dark energy paradox leads to a new structure of spacetime.pptx
The dark energy paradox leads to a new structure of spacetime.pptxThe dark energy paradox leads to a new structure of spacetime.pptx
The dark energy paradox leads to a new structure of spacetime.pptxEran Akiva Sinbar
 
THE ROLE OF PHARMACOGNOSY IN TRADITIONAL AND MODERN SYSTEM OF MEDICINE.pptx
THE ROLE OF PHARMACOGNOSY IN TRADITIONAL AND MODERN SYSTEM OF MEDICINE.pptxTHE ROLE OF PHARMACOGNOSY IN TRADITIONAL AND MODERN SYSTEM OF MEDICINE.pptx
THE ROLE OF PHARMACOGNOSY IN TRADITIONAL AND MODERN SYSTEM OF MEDICINE.pptxNandakishor Bhaurao Deshmukh
 
Call Girls in Mayapuri Delhi 💯Call Us 🔝9953322196🔝 💯Escort.
Call Girls in Mayapuri Delhi 💯Call Us 🔝9953322196🔝 💯Escort.Call Girls in Mayapuri Delhi 💯Call Us 🔝9953322196🔝 💯Escort.
Call Girls in Mayapuri Delhi 💯Call Us 🔝9953322196🔝 💯Escort.aasikanpl
 
STOPPED FLOW METHOD & APPLICATION MURUGAVENI B.pptx
STOPPED FLOW METHOD & APPLICATION MURUGAVENI B.pptxSTOPPED FLOW METHOD & APPLICATION MURUGAVENI B.pptx
STOPPED FLOW METHOD & APPLICATION MURUGAVENI B.pptxMurugaveni B
 
Artificial Intelligence In Microbiology by Dr. Prince C P
Artificial Intelligence In Microbiology by Dr. Prince C PArtificial Intelligence In Microbiology by Dr. Prince C P
Artificial Intelligence In Microbiology by Dr. Prince C PPRINCE C P
 
RESPIRATORY ADAPTATIONS TO HYPOXIA IN HUMNAS.pptx
RESPIRATORY ADAPTATIONS TO HYPOXIA IN HUMNAS.pptxRESPIRATORY ADAPTATIONS TO HYPOXIA IN HUMNAS.pptx
RESPIRATORY ADAPTATIONS TO HYPOXIA IN HUMNAS.pptxFarihaAbdulRasheed
 
SOLUBLE PATTERN RECOGNITION RECEPTORS.pptx
SOLUBLE PATTERN RECOGNITION RECEPTORS.pptxSOLUBLE PATTERN RECOGNITION RECEPTORS.pptx
SOLUBLE PATTERN RECOGNITION RECEPTORS.pptxkessiyaTpeter
 

Recently uploaded (20)

Call Girls In Nihal Vihar Delhi ❀8860477959 Looking Escorts In 24/7 Delhi NCR
Call Girls In Nihal Vihar Delhi ❀8860477959 Looking Escorts In 24/7 Delhi NCRCall Girls In Nihal Vihar Delhi ❀8860477959 Looking Escorts In 24/7 Delhi NCR
Call Girls In Nihal Vihar Delhi ❀8860477959 Looking Escorts In 24/7 Delhi NCR
 
BUMI DAN ANTARIKSA PROJEK IPAS SMK KELAS X.pdf
BUMI DAN ANTARIKSA PROJEK IPAS SMK KELAS X.pdfBUMI DAN ANTARIKSA PROJEK IPAS SMK KELAS X.pdf
BUMI DAN ANTARIKSA PROJEK IPAS SMK KELAS X.pdf
 
Analytical Profile of Coleus Forskohlii | Forskolin .pptx
Analytical Profile of Coleus Forskohlii | Forskolin .pptxAnalytical Profile of Coleus Forskohlii | Forskolin .pptx
Analytical Profile of Coleus Forskohlii | Forskolin .pptx
 
LIGHT-PHENOMENA-BY-CABUALDIONALDOPANOGANCADIENTE-CONDEZA (1).pptx
LIGHT-PHENOMENA-BY-CABUALDIONALDOPANOGANCADIENTE-CONDEZA (1).pptxLIGHT-PHENOMENA-BY-CABUALDIONALDOPANOGANCADIENTE-CONDEZA (1).pptx
LIGHT-PHENOMENA-BY-CABUALDIONALDOPANOGANCADIENTE-CONDEZA (1).pptx
 
FREE NURSING BUNDLE FOR NURSES.PDF by na
FREE NURSING BUNDLE FOR NURSES.PDF by naFREE NURSING BUNDLE FOR NURSES.PDF by na
FREE NURSING BUNDLE FOR NURSES.PDF by na
 
Grafana in space: Monitoring Japan's SLIM moon lander in real time
Grafana in space: Monitoring Japan's SLIM moon lander  in real timeGrafana in space: Monitoring Japan's SLIM moon lander  in real time
Grafana in space: Monitoring Japan's SLIM moon lander in real time
 
(9818099198) Call Girls In Noida Sector 14 (NOIDA ESCORTS)
(9818099198) Call Girls In Noida Sector 14 (NOIDA ESCORTS)(9818099198) Call Girls In Noida Sector 14 (NOIDA ESCORTS)
(9818099198) Call Girls In Noida Sector 14 (NOIDA ESCORTS)
 
OECD bibliometric indicators: Selected highlights, April 2024
OECD bibliometric indicators: Selected highlights, April 2024OECD bibliometric indicators: Selected highlights, April 2024
OECD bibliometric indicators: Selected highlights, April 2024
 
Analytical Profile of Coleus Forskohlii | Forskolin .pdf
Analytical Profile of Coleus Forskohlii | Forskolin .pdfAnalytical Profile of Coleus Forskohlii | Forskolin .pdf
Analytical Profile of Coleus Forskohlii | Forskolin .pdf
 
zoogeography of pakistan.pptx fauna of Pakistan
zoogeography of pakistan.pptx fauna of Pakistanzoogeography of pakistan.pptx fauna of Pakistan
zoogeography of pakistan.pptx fauna of Pakistan
 
Volatile Oils Pharmacognosy And Phytochemistry -I
Volatile Oils Pharmacognosy And Phytochemistry -IVolatile Oils Pharmacognosy And Phytochemistry -I
Volatile Oils Pharmacognosy And Phytochemistry -I
 
Twin's paradox experiment is a meassurement of the extra dimensions.pptx
Twin's paradox experiment is a meassurement of the extra dimensions.pptxTwin's paradox experiment is a meassurement of the extra dimensions.pptx
Twin's paradox experiment is a meassurement of the extra dimensions.pptx
 
Pests of castor_Binomics_Identification_Dr.UPR.pdf
Pests of castor_Binomics_Identification_Dr.UPR.pdfPests of castor_Binomics_Identification_Dr.UPR.pdf
Pests of castor_Binomics_Identification_Dr.UPR.pdf
 
The dark energy paradox leads to a new structure of spacetime.pptx
The dark energy paradox leads to a new structure of spacetime.pptxThe dark energy paradox leads to a new structure of spacetime.pptx
The dark energy paradox leads to a new structure of spacetime.pptx
 
THE ROLE OF PHARMACOGNOSY IN TRADITIONAL AND MODERN SYSTEM OF MEDICINE.pptx
THE ROLE OF PHARMACOGNOSY IN TRADITIONAL AND MODERN SYSTEM OF MEDICINE.pptxTHE ROLE OF PHARMACOGNOSY IN TRADITIONAL AND MODERN SYSTEM OF MEDICINE.pptx
THE ROLE OF PHARMACOGNOSY IN TRADITIONAL AND MODERN SYSTEM OF MEDICINE.pptx
 
Call Girls in Mayapuri Delhi 💯Call Us 🔝9953322196🔝 💯Escort.
Call Girls in Mayapuri Delhi 💯Call Us 🔝9953322196🔝 💯Escort.Call Girls in Mayapuri Delhi 💯Call Us 🔝9953322196🔝 💯Escort.
Call Girls in Mayapuri Delhi 💯Call Us 🔝9953322196🔝 💯Escort.
 
STOPPED FLOW METHOD & APPLICATION MURUGAVENI B.pptx
STOPPED FLOW METHOD & APPLICATION MURUGAVENI B.pptxSTOPPED FLOW METHOD & APPLICATION MURUGAVENI B.pptx
STOPPED FLOW METHOD & APPLICATION MURUGAVENI B.pptx
 
Artificial Intelligence In Microbiology by Dr. Prince C P
Artificial Intelligence In Microbiology by Dr. Prince C PArtificial Intelligence In Microbiology by Dr. Prince C P
Artificial Intelligence In Microbiology by Dr. Prince C P
 
RESPIRATORY ADAPTATIONS TO HYPOXIA IN HUMNAS.pptx
RESPIRATORY ADAPTATIONS TO HYPOXIA IN HUMNAS.pptxRESPIRATORY ADAPTATIONS TO HYPOXIA IN HUMNAS.pptx
RESPIRATORY ADAPTATIONS TO HYPOXIA IN HUMNAS.pptx
 
SOLUBLE PATTERN RECOGNITION RECEPTORS.pptx
SOLUBLE PATTERN RECOGNITION RECEPTORS.pptxSOLUBLE PATTERN RECOGNITION RECEPTORS.pptx
SOLUBLE PATTERN RECOGNITION RECEPTORS.pptx
 

Article 4.pdf

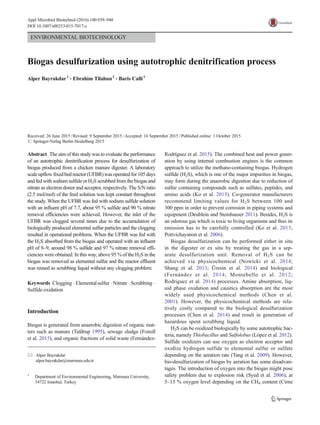
  • 1. ENVIRONMENTAL BIOTECHNOLOGY Biogas desulfurization using autotrophic denitrification process Alper Bayrakdar1 & Ebrahim Tilahun1 & Baris Calli1 Received: 26 June 2015 /Revised: 9 September 2015 /Accepted: 16 September 2015 /Published online: 1 October 2015 # Springer-Verlag Berlin Heidelberg 2015 Abstract The aim of this study was to evaluate the performance of an autotrophic denitrification process for desulfurization of biogas produced from a chicken manure digester. A laboratory scaleupflowfixedbedreactor (UFBR)wasoperatedfor 105days and fed with sodium sulfide or H2S scrubbed from the biogas and nitrate as electron donor and acceptor, respectively. The S/N ratio (2.5 mol/mol) of the feed solution was kept constant throughout the study. When the UFBR was fed with sodium sulfide solution with an influent pH of 7.7, about 95 % sulfide and 90 % nitrate removal efficiencies were achieved. However, the inlet of the UFBR was clogged several times due to the accumulation of biologically produced elemental sulfur particles and the clogging resulted in operational problems. When the UFBR was fed with the H2S absorbed from the biogas and operated with an influent pH of 8–9, around 98 % sulfide and 97 % nitrate removal effi- ciencies were obtained. In this way, above 95 % of the H2S in the biogas was removed as elemental sulfur and the reactor effluent was reused as scrubbing liquid without any clogging problem. Keywords Clogging .Elementalsulfur .Nitrate .Scrubbing . Sulfide oxidation Introduction Biogas is generated from anaerobic digestion of organic mat- ters such as manure (Tafdrup 1995), sewage sludge (Fonoll et al. 2015), and organic fractions of solid waste (FernĂĄndez- RodrĂ­guez et al. 2015). The combined heat and power gener- ation by using internal combustion engines is the common approach to utilize the methane-containing biogas. Hydrogen sulfide (H2S), which is one of the major impurities in biogas, may form during the anaerobic digestion due to reduction of sulfur containing compounds such as sulfates, peptides, and amino acids (Ko et al. 2015). Co-generator manufacturers recommend limiting values for H2S between 100 and 300 ppm in order to prevent corrosion in piping systems and equipment (Deublein and Steinhauser 2011). Besides, H2S is an odorous gas which is toxic to living organisms and thus its emission has to be carefully controlled (Ko et al. 2015; Potivichayanon et al. 2006). Biogas desulfurization can be performed either in situ in the digester or ex situ by treating the gas in a sep- arate desulfurization unit. Removal of H2S can be achieved via physicochemical (Nowicki et al. 2014; Shang et al. 2013; Üresin et al. 2014) and biological (FernĂĄndez et al. 2014; Montebello et al. 2012; Rodriguez et al. 2014) processes. Amine absorption, liq- uid phase oxidation and caustics absorption are the most widely used physicochemical methods (Chen et al. 2001). However, the physicochemical methods are rela- tively costly compared to the biological desulfurization processes (Chen et al. 2014) and result in generation of hazardous spent scrubbing liquid. H2S can be oxidized biologically by some autotrophic bac- teria, namely Thiobacillus and Sulfolobus (LĂłpez et al. 2012). Sulfide oxidizers can use oxygen as electron acceptor and oxidize hydrogen sulfide to elemental sulfur or sulfate depending on the aeration rate (Tang et al. 2009). However, bio-desulfurization of biogas by aeration has some disadvan- tages. The introduction of oxygen into the biogas might pose safety problem due to explosion risk (Syed et al. 2006), at 5–15 % oxygen level depending on the CH4 content (Cirne * Alper Bayrakdar alper.bayrakdar@marmara.edu.tr 1 Department of Environmental Engineering, Marmara University, 34722 Istanbul, Turkey Appl Microbiol Biotechnol (2016) 100:939–948 DOI 10.1007/s00253-015-7017-z
  • 2. et al. 2008; Ramos and Fdz-Polanco 2014). Another disad- vantage is the difficulty in monitoring the hydrogen sulfide concentration and controlling the amount of air or oxygen supplied. Moreover, inert N2 and excess O2 supplied to the system in the form of air may cause the dilution of biogas. Diaz et al. (2010) reported that 30–40 % of oxygen introduced to the system was consumed in sulfide oxidation and the re- maining oxygen left the digester with the biogas. The dilution of the biogas may result in combustibility problems and de- crease the biogas’ calorific value. Therefore, bio- desulfurization of the biogas by using air may not be suitable if the biogas is to be used as vehicle fuel or for grid injection due to the remaining traces of especially O2 (Petersson and WeLLInGer 2009). The removal of nitrogen from the industrial and/or domestic wastewater is obligatory because of stringent discharge standards, especially in coastal areas sensitive to eutrophication. Although classical heterotrophic deni- trification processes are rather effective in removing ni- trate, always a sufficient amount of organic matter is required (Lee and Rittmann 2003). If an extended aera- tion activated sludge process is used for wastewater treatment, additional organic matter or process modifica- tions are required to remove nitrate produced in the aeration basin (Sahinkaya et al. 2014). The autotrophic denitrification processes receive more attention due to its two major advantages than the heterotrophic denitrification processes: (1) no need for an external organic carbon source (methanol or ethanol) and (2) less sludge production that minimizes the chemical and sludge management cost (Zhang and Lampe 1999). In this context, reduced forms of sulfur species such as elemental sulfur and sulfide can be used as an electron source (FernĂĄndez et al. 2008). Although sulfur is a cheap electron donor for autotro- phic denitrification process, sulfate production and al- kalinity requirement are the main drawbacks of using sulfur as electron donor (Sahinkaya et al. 2015). The autotrophic denitrification process provide an opportu- nity for simultaneous removal of sulfide and nitrate in the wastewater treatment plants having anaerobic sludge digester (Baspinar et al. 2011). Additionally, it may be much easier to control the final reaction by- products compared to aerobic sulfide oxidation by adjusting the ratio of electron donor to acceptor (H2S/ NO3 − ). H2S can be scrubbed from the biogas by chemical absorp- tion using hydroxide solutions (Baciocchi et al. 2013) (Eq.1). Inorganic carbon required for autotrophic denitrifiers could also be absorbed in this way (Eq.2). However, when the spent absorption solution is discharged or mixed with other waste streams, scrubbed H2S may easily release to the atmosphere. Hence, the spent scrubbing solutions are classified as hazardous substances (Chen et al. 2001). The scrubbed H2S can be used as electron donor in an autotrophic denitrification process (Eq.3) (Baspinar et al. 2011; FernĂĄndez et al. 2014; Guerrero and Bevilaqua 2015). In this way, the sulfide in the spent scrubbing liquid is desulfurized while the nitrate and/or nitrite ions in wastewater are denitrified. H2S ĂŸ OH− ↔HS− ĂŸ H2O Ă°1Þ CO2 ĂŸ NaOH↔NaHCO3 Ă°2Þ 5HS− ĂŸ 2NO3 − ĂŸ 7HĂŸ →5S0 ĂŸ N2 ĂŸ 6H2O Ă°3Þ In this study, for the removal of H2S produced from a laboratory scale anaerobic chicken manure digester, a two- stage chemical H2S absorption plus bio-desulfurization pro- cess was investigated. Firstly, the H2S was absorbed from the biogas using a scrubber filled with alkaline solution. Then the scrubbing liquid was fed as electron source to an autotrophic denitrifying upflow fixed bed reactor (UFBR). The perfor- mance of the UFBR was investigated for 105 days under varying hydraulic retention times (HRTs), sulfide loading rates, and influent pH values. Material and methods Sulfide oxidizing autotrophic denitrification reactor In this study, an upflow fixed bed reactor (UFBR) (Fig. 1b) having a working volume of 250 mL was operated under anoxic conditions. The diameter and total height of the reactor were 4 and 20 cm, respectively. The reactor had been operated for around a year before the initiation of this study with an HRT of 9 h and influent pH of 7.5 to determine the optimum operational conditions for sulfide-based autotrophic denitrifi- cation. Acid washed and rinsed 50 g of granular activated carbon (GAC) (Norit GAC 1240) was used as packing mate- rial. The inoculum taken from the denitrification tank of a local sewage treatment plant was mixed with the activated carbon granules before being filled into the UFBR. S/N ratio was kept at 2.5 (mol/mol) to prevent the complete oxidation of sulfide to sulfate, mainly to produce elemental sulfur as final product (Eq.3). The UFBR was placed in a water jacket and operated at 35 ± 1 °C. Operation of UFBR and H2S scrubber The operational plan and conditions of the UFBR are given in Table 1. In the first two periods (periods 1 and 2), the UFBR was fed with a synthetic solution containing NaNO3 (17 mg N/L), Na2S.9H2O (97 mg S/L), and NaHCO3 as 940 Appl Microbiol Biotechnol (2016) 100:939–948
  • 3. electron acceptor, donor, and carbon source, respectively. 3.016 g/L K2HPO4 and 0.364 g/L KH2PO4 (20 mM phos- phate buffer) were added to the synthetic feed after the adjust- ment of pH to 7.7 with 1 N HCl. The synthetic feed containing 750 mg/L Na2S.9H2O, 100 mg/L NaNO3, 150 mg/L NaHCO3, 110 mg/L NH4Cl, 10 mg/L MgCl2.6H2O, 10 mg/L CaCl2.2H2O, 3 mg/L yeast extract, and 5 mg/L ascorbic acid was prepared daily and kept in refrigerator, while it is continuously fed to the reactor using a peristaltic pump (Watson-Marlow 323). HRT was 9 h in period 1 and it was decreased to 4 h in period 2. In periods 3A and 3B, sulfide and carbon dioxide scrubbed from biogas of a lab-scale chicken manure digester were fed to the UFBR, as electron donor and carbon source, respectively. The biogas of manure digester containing 0.7 ± 0.1 % H2S, 40 ± 3 % CO2, and 60 ± 4 % CH4 was first collected in a 25-L aluminum foil gas collection bag. Afterwards, it was intro- duced to a scrubbing column having 350 mL of 2.5 % NaOH solution (Fig. 1a) for the absorption of the H2S and CO2 from the biogas. A second scrubber filled with 2.5 % NaOH was connected to the first one in series to capture the H2S leaving the first scrubber and to determine the H2S absorption efficiency. The hydrogen sulfide removal efficiency was cal- culated according to Eq. 4. H2S removal eff: % Ă° Þ ÂŒ HS− 1st scrubber= HS− 1st scrubber ĂŸ HS− 2nd scrubber Ă° Þ 100 Ă°4Þ In period 3A (days 434–448), the scrubbing liquid was prepared using tap water, but in period 3B (days 448–470), the effluent of UFBR was used instead of tap water. The H2S scrubber was made up off a Plexiglas column and has 4 cm diameter and 50 cm height. The biogas was introduced to the alkaline solution through a diffuser from the bottom of the scrubber using a pump (KNF N86KT.18). Since the absorp- tion of H2S and CO2 is an alkalinity-consuming process, the pH decreased during the scrubbing operation. Therefore, pH was continuously monitored in the first scrubber and the time to stop pumping biogas was decided based on the pH of the solution (pH 8–9 in period 3A). The scrubbing operation was terminated at pH 9. In order to adjust the sulfide concentration in the feed to 97 mg S/L, some additional sodium sulfide was supplemented on the days in which there was not enough biogas generation or the biogas does not contain enough H2S. Fig. 1 a Biogas scrubbing system (stage 1). b Upflow fixed bed reactor (stage 2) Table 1 Operational conditions of UFBR Period Day Sulfide (e− donor) source Carbon source Scrubbing liquid HRT (h) 1 365–398 Na2S.9H2O NaHCO3 – 9 2 398–434 Na2S.9H2O NaHCO3 – 4 3A 434–448 HS− scrubbed from biogas HCO3 − from biogas Tap water 4 3B 448–470 HS− scrubbed from biogas HCO3 − from biogas UFBR effluent 4 Appl Microbiol Biotechnol (2016) 100:939–948 941
  • 4. After batch scrubbing operations, the scrubbing liquid was immediately transferred into the feeding tank and supplement- ed with the nutrients listed above, excluding sulfide and bicar- bonate. Then the headspace of the feeding tank was flushed with nitrogen gas to provide anaerobic conditions. Sulfur recovery and electron balance calculations The amount of daily elemental sulfur production was calcu- lated by using Eq. 5 assuming that the only products of sulfide oxidation were elemental sulfur and sulfate. S0 ÂŒ HS−S Âœ inf:– HS−S Âœ eff:– SO4−S Âœ prod: Ă°5Þ where S0 is the elemental sulfur, [HS − S]inf. is the equivalent sulfur input as sulfide, [HS − S]eff. is the equivalent sulfur output as sulfide, and [SO4 − S]prod. is the equivalent sulfur output as produced sulfate. The sulfur consumed by microor- ganisms and polysulfide, which is intermediate product of sulfide oxidation, was neglected in this calculation. In addition, the electron balance of the system was also calculated as a portion of electron accepted by denitrification and electron donated by sulfide and sulfur oxidations accord- ing to Eq. 6. %e− ÂŒ mole of electron accepted by denitrification mole of electron donated by sulfur and sulfide oxidations 100 Ă°6Þ Analytical methods Samples were filtered using cellulose acetate syringe filters (pore size of 0.45 ÎŒm) before nitrate, nitrite, ammonia, and sulfate analyses. Nitrate and nitrite were analyzed using an HPLC (Shimadzu Prominence LC-20A) equipped with UV detector at 210 nm and 30 °C. Samples were injected onto a C18 column (Eurosil Bioselect 300-5, 4 × 120 mm) with the mobile phase of 0.01 M n-Octylamine (pH 4–4.5) and 1 mL/ min flow rate. Sulfate (4500-SO4 2− E) and total alkalinity (2320) were measured according to standard methods (APHA 2005). Sulfide was analyzed spectrometrically (WTW PhotoLab 6100VIS) following the method described by Cord-Ruwisch (1985). Biologically produced sulfur particles taken from the UFBR were extracted and determined accord- ing to the method described by YĂŒcel et al. (2010). Influent and effluent ammonia concentrations were analyzed accord- ing to nesslerization method (Hach 8038) by using a spectro- photometer (DR2500, Hach Lange GmbH, Germany). Before the ammonia analysis, samples were distilled by using an au- tomated distillation system (Vapodest 30, Gerhardt) in order to eliminate the interference of the sulfide present in the sample. The methane and carbon dioxide contents of raw and treat- ed biogas and the nitrogen content of the gas generated by UFBR were analyzed using a GC equipped with TCD and Carboxen-1000, 60/80 mesh, 15 ft × 1/8 in. stainless steel column. The temperature of the column was initially 35 °C for 5 min and then rose to 225 °C at 20 °C/min. The amount of nitrogen gas produced from the UFBR was measured daily by using water displacement method and the theoretical gas production was calculated according to the ideal gas law. Results Performance of UFBR fed with sodium sulfide solution This experiment was conducted to evaluate the simultaneous sulfide oxidation and denitrification performance of an UFBR. The UFBR was operated with NO3 − and HS− loading rates of 44 mg N/L/day and 252 mg S/L/day, respectively, in period 1 (days 365–398). The HRTwas 9 h. Although almost no nitrate was observed, nitrite concentration sometimes exceeded 3 mg N/L (Fig. 2a) in the effluent. While the influent and effluent total alkalinity concentrations were comparable, the influent and effluent pH values were about 7.7 and 9.5, re- spectively, until day 400 (Fig. 2b). The average nitrogen re- moval efficiency between days 365 and 400 was about 88 ± 7.5 % (Table 2). On day 390, the influent part of the reactor was clogged due to the accumulation of sulfur particles generated as a result of sulfide oxidation in the reactor. The accumulated sulfur particles were removed by withdrawing 30 ml of the reactor’s content from the bottom. The white and pale yellow elemental sulfur particles were qualitatively analyzed and compared with commercial sulfur pellets. The results showed that they have same UV spectra (data not shown). In the subsequent days, the nitrogen removal efficien- cy decreased to 69 % (Fig. 3) and the effluent nitrite concen- tration increased up to 5.23 mg N/L (Fig. 2a) presumably due to the oxygen penetration to the reactor and the loss of some active biomass along with removed sulfur particles. In period 1, the average sulfide removal rate and efficiency were 244 mg S/L/day and 97 ± 2 %, respectively (Table 2). The average nitrogen removal rate was 39 mg N/L/day. In addition, only 6 ± 1.8 % of the sulfide was oxidized to sulfate. It proved that the major product of the denitrifying sulfide oxidation process in the UFBR was elemental sulfur. In period 1, the effluent sulfide concentration was usually below 5 mg S/L and 94 ± 1.9 % of the influent sulfide was oxidized to elemental sulfur (Fig. 4a). Furthermore, it was calculated that about 80 ± 5 % of the electrons released from sulfide and sulfur oxidations were consumed in denitrification process. The electron balance, nitrogen, and sulfide removal efficien- cies are given in Table 2. The theoretical gas production was comparable to the measured gas production and the average daily gas production rate was 8.8 ± 0.7 mL (Fig. 4b). 942 Appl Microbiol Biotechnol (2016) 100:939–948
  • 5. In period 2 (days 398–434), the flow rate was increased and thus the HRT decreased from 9 to 4 h. The sulfide and nitro- gen loading rates increased to 582 mg S/L/day and 102 mg N/ L/day, respectively. After this alteration, the nitrogen removal efficiency suddenly dropped from 98 to 45 %. Subsequently, within 2 days, it restored back to 82 % and within 8 days exceeded 95 % (Fig. 3). Similarly, the pH also responded quickly to decreasing HRT and dropped from 9.5 to 8.5 (Fig. 2b). On day 409, the feeding was stopped and the inlet of the reactor was cleaned once again because of clogging. Besides, on the next day the UFBR could not be fed due to a mechan- ical problem related to the feeding pump. Therefore, the nitro- gen removal efficiency sharply dropped from 97 to 34 % (Fig. 3). Effluent NO3 and NO2 increased up to 6 and 5 mg N/L, respectively, on day 411 (Fig. 2a). Similar but less serious clogging problems were encountered again on days 417 and 430, which resulted in fluctuating nitrogen removal efficiencies (63–78 %) (Fig. 3). In periods 1 and 2, although the effluent sulfide concentra- tion was usually below 5 mg S/L (Fig. 4a) with removal effi- ciency above 95 %, the nitrogen removal efficiency fluctuated at lower levels and sometimes dropped sharply because of clogging-related problems caused by the accumulation of in- soluble sulfur particles at the bottom of UFBR. The inlet of UFBR was emptied partially several times to remove the ac- cumulated sulfur particles. During each cleaning, oxygen, which is an alternative electron acceptor, was introduced to the system. Consequently, sulfide-based denitrification effi- ciency dropped for a few days until appropriate conditions were re-maintained. In period 2, the average nitrogen and sulfide removal efficiencies were 78 ± 18 % and 90 ± 11 %, respectively (Fig. 3). The nitrogen and sulfide removal rates were 80 mg N/L/day and 531 mg S/L/day, respectively. Con- sidering the amount of sulfate generated, it was calculated that about 91 % of the removed sulfide was oxidized to elemental sulfur and 74 ± 11 % of the electrons donated by sulfide and elemental sulfur were accepted by the autotrophic denitrifica- tion process (Table 2). The theoretically calculated and Table 2 Average removal efficiencies and electron balance of UFBR Period Day %N removal % HS− removal %Electron balance 1 365–398 88 ± 7.5 97 ± 2 80 ± 5 2 398–434 78 ± 18.8 90 ± 11 74 ± 11 3A 434–448 97 ± 1 98 ± 1 89 ± 6 3B 448–470 96 ± 6.5 97 ± 2 108 ± 13 Fig. 2 a Influent and effluent NO3 − and NO2 − concentrations. b Influent and effluent pH and alkalinity Appl Microbiol Biotechnol (2016) 100:939–948 943
  • 6. measured gas production values did not overlap perfectly be- cause of the frequent clogging problem in this period (Fig. 4b). Performance of UFBR fed with sulfide scrubbed from biogas In period 3A (days 434–448), the H2S was absorbed from the biogas using an alkaline scrubbing solution prepared with tap water. The scrubbing operation was terminated at pH of around 8.2, where 92 % of the total sulfide was in the form of HS− , not to strip the scrubbed sulfide out. Above 95 % of the H2S was absorbed from the biogas. The 62 % CH4 and 38 % CO2 in the biogas were determined as 73 ± 3 % and 27 ± 4 % after scrubbing, respectively. It shows that about 29 % of CO2 was absorbed in the scrubbing liquid. In this period, the nitrogen and sulfide loading rates were 98.28 mg N/L/day and 541 mg S/L/day, respectively. Almost Fig. 3 Sulfide and nitrogen removal efficiencies Fig. 4 a Influent and effluent sulfide and sulfate concentrations. b Theoretical and measured gas production 944 Appl Microbiol Biotechnol (2016) 100:939–948
  • 7. no nitrite and nitrate were determined in the effluent. The nitrogen and sulfide removal efficiencies were 97 ± 1 % and 98 ± 1 %, respectively (Fig. 3). In addition, 89 ± 6 % of the electrons liberated from the sulfide and elemental sulfur oxi- dations were used for denitrification and 94 ± 3 % of the removed sulfide oxidized to elemental sulfur. The effluent sulfate concentration was 5.6 ± 0.8 mg S/L (Fig. 4a). The pH in the bottom of the UFBR was 8.2 ± 0.1, and it was maintained without using any external buffer. According to our calculations, 1.5 % of the absorbed CO2 from biogas was absorbed as carbonic acid (H2CO3) and 98 % as bicar- bonate (HCO3 − ) at pH 8.2 and provided a strong buffer. Al- though no external pH buffer was used and the influent pH of 8.2 was higher than in periods 1 and 2, the effluent pH sharply dropped from about 9.2 to 8.8 with the beginning of period 3A. Astonishingly, no serious clogging problem was encoun- tered during periods 3A and B. In period 3B (days 448–470), the effluent of UFBR was used for preparing scrubbing liquid instead of tap water. In practice, the use of UFBR effluent may considerably decrease the water consumption for desulfurization of biogas. A small amount of nitrite was determined in the influent just after starting to use the UFBR effluent in scrubbing and feeding the scrubbing liquid to the reactor. Meanwhile, the effluent nitrite concentration increased day by day as the ef- fluent was repeatedly used (Fig. 2a). At last, it was ascertained that the ammonium added in excess amount to the feed solu- tion exits the UFBR and is partially nitrified in the effluent bottle. Because of the unexpected nitrogen load coming along with the UFBR effluent, the influent sulfide concentration, which was adjusted according to S/N ratio of 2.5, did not provide enough electrons for complete denitrification. There- fore, the effluent nitrite concentration elevated up to 6.1 mg N/ L on day 455 (Fig. 2a). As a solution, NH4Cl was excluded from the feed from day 455. Subsequently, the partial nitrifi- cation was avoided in the effluent bottle. In the meantime, the total alkalinity gradually increased within 23 days in the ef- fluent of UFBR which was repeatedly used as scrubbing liq- uid (Fig. 2b). However, no adverse effect of increasing alka- linity up to 20 g/L was experienced on the performance of UFBR. In period 3B, the amount of the biogas used in the scrub- bing experiments decreased because of an operational prob- lem in the chicken manure digester. In this period, the amount of H2S absorbed from the biogas was not adequate to provide 100 mg/L HS− concentration in the feed solution; therefore, some amount of sodium sulfide was added externally. As a result, the final pH of the scrubbing liquid and thus the feed solution increased to about 9. Some portion of the CO2 absorbed by scrubbing liquid was released to the headspace of UFBR when the influent pH was 8 in period 3A (Fig. 4b). Therefore, the daily measured gas production was 5.5 mL higher than the theoretical gas production in this period. In period 3B, where the influent pH was 9, less CO2 was released to the headspace and thus the average amount of calculated and measured N2 gas were 30.6 ± 4 mL/day and 29.8 ± 5.5 mL/day, respectively (Fig. 4b). To prove that the only source of N2 was the denitrification process, not the N2 dissolved in the feed solution, an abiotic control test was conducted by feeding the UFBR under the same conditions. The amount of N2 released to the headspace of the reactor was negligible. In period 3B, the sulfide and nitrogen removal efficiencies were 97 ± 2 % and 96 ± 6 % while the nitrogen and sulfide removal rates were 116 mg N/L/day and 528 mg S/L/day, respectively. The number of electrons consumed in denitrifi- cation was higher than the one donated by sulfide and elemen- tal sulfur (Table 2). It indicates that there were some other electron donors such as thiosulfate, sulfite, and polysulfide in the system. Using the UFBR effluent recurrently as scrub- bing liquid might result in accumulation of reduced sulfur species in the reactor. Discussion Performance of UFBR with synthetic feed solution In period 1, although no nitrate was observed in the effluent, complete denitrification was not achieved at 9 h HRT and nitrite concentrations were above 3 mg N/L in the effluent. Lee and Rittmann (2003) reported that nitrite tends to accu- mulate in denitrification systems at alkaline pH values (pH 9). In this period, the effluent pH values were generally above 9 due to the partial oxidation of sulfide to elemental sulfur (Fig. 2b). It was reported that the oxidation of sulfide to elemental sulfur produces alkalinity (Moraes et al. 2012; Sahinkaya et al. 2011). In period 1, the average nitrogen re- moval efficiency was 88 ± 7.5 % (Table 2). However, this result contradicts with the finding of Oh et al. (2000) which shows the complete inhibition of denitrification at pH of 9. On the other hand, the results were consistent with the conclu- sions of Mahmood et al. (2008) about the complete autotro- phic denitrification at a wide range of pH values (5–11). In period 2, sulfide and nitrogen loading rates increased to 582 mg S/L/day and 102 mg N/L/day, respectively, by de- creasing the HRT from 9 to 4 h. The sulfide oxidation and denitrification efficiencies dropped immediately when nitro- gen and sulfide loading rates increased. However, both sulfide oxidation and denitrification efficiencies restored back within 8 days. In addition, the effluent pH decreased to 8.5 (Fig. 2b). Likewise, Cai et al. (2008) found that a shock load, which halved the HRT, considerably affected the reactor pH and sulfide oxidation efficiency its detrimental effect did not last very long. Appl Microbiol Biotechnol (2016) 100:939–948 945
  • 8. During periods 1 and 2, the denitrification efficiency was highly affected by clogging problems related to accumulated sulfur particles at the bottom of the UFBR. The sulfur particles were cleaned each time by emptying the inlet of the reactor. Although the denitrification efficiency dropped after each cleaning procedure, the sulfide oxidation performance was not affected due to the intrusion of oxygen, which is a stronger electron acceptor than nitrate. Similarly, clogging problem was also reported by Fortuny et al. (2008) in a sulfide oxidizing biotrickling reactor supplied with oxygen instead of nitrate as electron acceptor. In another study, significant amounts of elemental sulfur settled and recovered from an expanded granular sludge bed reactor (Dinamarca 2014). Therefore, suspended growth type reactors may be a good alternative to avoid the clogging problem and separate the produced elemental sulfur from the reactor. In this period, the main product of sulfide oxidation was elemental sulfur. Only about 7 % of the sulfide was oxidized to sulfate. In another study in which the S/N ratio was 2.5, similarly 8.6 % of the incoming sulfide was oxidized to sulfate (Cai et al. 2008). Performance of UFBR with scrubbed sulfide In periods 3A and B, hydrogen sulfide, produced by a labora- tory scale anaerobic chicken manure digester, was scrubbed and then the scrubbing liquid was fed to the UFBR. Above 95 % of the hydrogen sulfide was absorbed from the biogas in batch scrubbing tests by keeping the final pH of the scrubbing liquid at around 8.2. Almost complete H2S absorption was reported by Krischan et al. (2012) by maintaining the pH above 7.7. In our scrubbing tests, similar to the finding of Baciocchi et al. 2013 about 29 % of the CO2 in biogas was absorbed in the scrubbing liquid. In periods 3A and B, the average nitrate and sulfide removal efficiencies were above 96 % and 97 ± 1 %, respectively (Fig. 3). The high denitrification efficiencies achieved in periods 3A and B were attributed to the suitable pH level in the UFBR and/or diminishing clogging problem due to the solubilization of biologically produced elemental sulfur. In period 3, al- though the influent pH was higher than in periods 1 and 2, the lowest effluent pH values below 9 were observed except the days in which extra sodium sulfide was added to the feed- ing solution. It is known that sulfide oxidation-based denitri- fication takes place at a pH in the range of 5–11, but some disturbances occur above pH 9 (Mahmood et al. 2008). In periods 3A and B, less clogging was experienced be- cause the solubility of biologically produced sulfur particles increased when the scrubbing liquid having a pH above 8 was fed to the UFBR. It was reported that the solubility of biolog- ically produced sulfur particles increases along with the rising pH in the presence of sulfide due to the formation of soluble polysulfides (Findlay et al. 2014). In period 3B, the number of electrons donated by sulfide and elemental sulfur was less than the electrons consumed in denitrification (Table 2). The reason of the gap in the electron balance might be related to other intermediate sulfur species such as thiosulfate, sulfite, and polysulfides, which might be generated in the UFBR and repeatedly recirculated when the effluent was used as scrubbing liquid and fed back to the reactor. Kleinjan et al. (2005) reported that the polysul- fide ions might cause the dissolution of elemental sulfur into an aqueous sulfide solution. In another study, it was reported that polysulfide can be used as electron donor and oxidized to thiosulfate, which was not mon- itored in our study (Bosch et al. 2007). Comparable measured and theoretical gas production values and no ammonia generation (data not shown) throughout the study proved that nitrate was removed by autotrophic denitrification, not via dissimilatory ni- trate reduction. These results, obtained at 2.5 mol/mol S/N ratio, contradict with the findings of Dolejs et al. (2014). They reported that dissimilatory nitrate reduction to ammonia occurred when S/N ratio was higher than 1.3 mol/mol. It is known that sulfide ions interfere with nesslerization method used in the determination of am- monia (Hach 8038). Therefore, the ammonia production ob- served by Dolejs et al. (2014) might be related to the interfer- ence of the residual sulfide on ammonia analyses. In the literature, there are similar studies for simultaneous removal of hydrogen sulfide and nitrate in single-stage biotrickling filters and bioscrubbers (Baspinar et al. 2011; FernĂĄndez et al. 2014). In these single-stage processes, scrub- bing of H2S and biodesulfurization take place in the same reactor. Although the process tested in this study consists of two stages, it has some advantages over single-stage processes mentioned above. In single-stage biodesulfurization process- es, as electron acceptor if nitrate is used, the nitrogen gas is produced during denitrification and if air is used, unconsumed oxygen and inert nitrogen gas leaving the reactor may cause the dilution of the biogas and decrease its calorific value. Besides, if the sulfide bio-oxidation process is inhibited for any reason, because there is no separate scrubber unit, the H2S removal is not achieved efficiently. Finally, it is concluded that above 98 % sulfide and 97 % nitrate were removed simultaneously in an upflow fixed bed autotrophic denitrification reactor fed with the H2S absorbed from the biogas of an anaerobic digester. The optimum oper- ation pH of the reactor was determined in the range of 8–9 while severe clogging problems because of elemental sulfur accumulation were observed at lower pH levels. The effluent of UFBR was repeatedly used as scrubbing liquid without any problem up to 20 g CaCO3/L total alkalinity. By using the effluent of the UFBR, a significant reduction may be achieved in the alkaline consumption in the scrubber. 946 Appl Microbiol Biotechnol (2016) 100:939–948
  • 9. Acknowledgments This work was financially supported by Marmara University Scientific Research Committee BAPKO (Project No. FEN-A- 100713-0323). Compliance with ethical standards Funding This study was funded by Marmara University Scientific Re- search Committee BAPKO (Project No. FEN-A-100713-0323). Conflict of interest The authors declare that they have no competing interests. Ethical approval This article does not contain any studies with human participants or animals performed by any of the authors. References APHA (2005) Standard methods for the examination of water and waste- water. APHA-AWWA-WEF, Washington, D.C. Baciocchi R, Carnevale E, Corti A, Costa G, Lombardi L, Olivieri T, Zanchi L, Zingaretti D (2013) Innovative process for biogas upgrading with CO2 storage: results from pilot plant opera- tion. Biomass Bioenergy 53(0):128–137. doi:10.1016/j. biombioe.2012.11.016 Baspinar AB, Turker M, Hocalar A, Ozturk I (2011) Biogas desulphurization at technical scale by lithotrophic denitrification: integration of sulphide and nitrogen removal. Process Biochem 46(4):916–922. doi:10.1016/j.procbio.2011.01.001 Bosch PLF, Beusekom OC, Buisman CJN, Janssen AJH (2007) Sulfide oxidation at halo-alkaline conditions in a fed-batch bioreactor. Biotechnol Bioeng 97(5):1053–1063 Cai J, Zheng P, Mahmood Q (2008) Effect of sulfide to nitrate ratios on the simultaneous anaerobic sulfide and nitrate removal. Bioresour Technol 99(13):5520–5527. doi:10.1016/j.biortech.2007.10.053 Chen L, Huang J, Yang C-L (2001) Absorption of H2S in NaOCl caustic aqueous solution. Environ Prog 20(3):175–181. doi:10.1002/ep. 670200313 Chen Y, Fan Z, Ma L, Yin J, Luo M, Cai W (2014) Performance of three pilot-scale immobilized-cell biotrickling filters for removal of hy- drogen sulfide from a contaminated air steam. Saudi J Biol Sci (0) doi:10.1016/j.sjbs.2014.05.008 Cirne DG, Van Der Zee FP, Fernandez-Polanco M, Fernandez-Polanco F (2008) Control of sulphide during anaerobic treatment of S- containing wastewaters by adding limited amounts of oxygen or nitrate. Rev Environ Sci Biotechnology 7(2):93–105 Cord-Ruwisch R (1985) A quick method for the determination of dis- solved and precipitated sulfides in cultures of sulfate-reducing bac- teria. J Microbiol Methods 4(1):33–36. doi:10.1016/0167-7012(85) 90005-3 Deublein D, Steinhauser A (2011) Biogas from waste and renewable resources: an introduction. John Wiley Sons DĂ­az I, Lopes AC, PĂ©rez SI, Fdz-Polanco M (2010) Performance evalu- ation of oxygen, air and nitrate for the microaerobic removal of hydrogen sulphide in biogas from sludge digestion. Bioresour Technol 101(20):7724–7730. doi:10.1016/j.biortech.2010.04.062 Dinamarca C (2014) Anaerobic expanded granular sludge bed (EGSB) reactor for the removal of sulphide by autotrophic denitrification. Journal Homepage: www IJEE IEEFoundation org 5(1):111–118 Dolejs P, PaclĂ­k L, Maca J, Pokorna D, Zabranska J, Bartacek J (2014) Effect of S/N ratio on sulfide removal by autotrophic denitrification. Appl Microbiol Biotechnol: 1-10 FernĂĄndez-RodrĂ­guez J, PĂ©rez M, Romero L (2015) Temperature-phased anaerobic digestion of industrial organic fraction of municipal solid waste: a batch study. Chem Eng J 270:597–604 FernĂĄndez M, RamĂ­rez M, GĂłmez JM, Cantero D (2014) Biogas biodesulfurization in an anoxic biotrickling filter packed with open-pore polyurethane foam. J Hazard Mater 264(0):529–535. doi:10.1016/j.jhazmat.2013.10.046 FernĂĄndez N, Sierra-Alvarez R, Field JA, Amils R, Sanz JL (2008) Microbial community dynamics in a chemolithotrophic deni- trification reactor inoculated with methanogenic granular sludge. Chemosphere 70(3):462–474. doi:10.1016/j. chemosphere.2007.06.062 Findlay AJ, Gartman A, MacDonald DJ, Hanson TE, Shaw TJ, Luther GW (2014) Distribution and size fractionation of elemental sulfur in aqueous environments: the Chesapeake Bay and Mid-Atlantic Ridge. Geochim Cosmochim Acta (0) doi:10. 1016/j.gca.2014.07.032 Fonoll X, Astals S, Dosta J, Mata-Alvarez J (2015) Anaerobic co- digestion of sewage sludge and fruit wastes: evaluation of the tran- sitory states when the co-substrate is changed. Chem Eng J 262: 1268–1274 Fortuny M, Baeza JA, Gamisans X, Casas C, Lafuente J, Deshusses MA, Gabriel D (2008) Biological sweetening of energy gases mimics in biotrickling filters. Chemosphere 71(1):10–17. doi:10.1016/j. chemosphere.2007.10.072 Guerrero RB, Bevilaqua D (2015) Biotrickling filtration of biogas pro- duced from the wastewater treatment plant of a brewery. J Environ Eng Kleinjan WE, de Keizer A, Janssen AJH (2005) Kinetics of the reaction between dissolved sodium sulfide and biologically produced sulfur. Ind Eng Chem Res 44(2):309–317. doi:10.1021/ie049579q Ko JH, Xu Q, Jang Y-C (2015) Emissions and control of hydrogen sulfide at landfills: a review. Critical Reviews in Environmental Science and Technology (just-accepted):00–00 Krischan J, Makaruk A, Harasek M (2012) Design and scale-up of an oxidative scrubbing process for the selective removal of hydrogen sulfide from biogas. J Hazard Mater 215–216(0):49–56. doi:10. 1016/j.jhazmat.2012.02.028 Lee K-C, Rittmann BE (2003) Effects of pH and precipitation on autohydrogenotrophic denitrification using the hollow-fiber mem- brane-biofilm reactor. Water Res 37(7):1551–1556. doi:10.1016/ S0043-1354(02)00519-5 LĂłpez ME, Rene ER, Veiga MC, Kennes C (2012) Biogas technologies and cleaning techniques environmental chemistry for a sustainable world. Springer, pp 347-377 Mahmood Q, Zheng P, Hayat Y, Islam E, Wu D, Ren-cun J (2008) Effect of pH on anoxic sulfide oxidizing reactor performance. Bioresour Technol 99(8):3291–3296. doi:10.1016/j.biortech.2007.07.006 Montebello AM, FernĂĄndez M, Almenglo F, RamĂ­rez M, Cantero D, Baeza M, Gabriel D (2012) Simultaneous methylmercaptan and hydrogen sulfide removal in the desulfurization of biogas in aerobic and anoxic biotrickling filters. Chem Eng J 200–202(0):237–246. doi:10.1016/j.cej.2012.06.043 Moraes BS, Souza TSO, Foresti E (2012) Effect of sulfide concentration on autotrophic denitrification from nitrate and nitrite in vertical fixed-bed reactors. Process Biochem 47(9):1395–1401. doi:10. 1016/j.procbio.2012.05.008 Nowicki P, Skibiszewska P, Pietrzak R (2014) Hydrogen sulphide re- moval on carbonaceous adsorbents prepared from coffee in- dustry waste materials. Chem Eng J 248(0):208–215. doi:10. 1016/j.cej.2014.03.052 Oh S, Kim K, Choi H, Cho J, Kim I (2000) Kinetics and physiological characteristics of autotrophic dentrification by denitrifying sulfur bacteria. Water Sci Technol 42(3–4):59–68 Petersson A, WeLLInGer A (2009) Biogas upgrading technologies—de- velopments and innovations. IEA Bioenergy 20 Appl Microbiol Biotechnol (2016) 100:939–948 947
  • 10. Potivichayanon S, Pokethitiyook P, Kruatrachue M (2006) Hydrogen sulfide removal by a novel fixed-film bioscrubber system. Process Biochem 41(3):708–715. doi:10.1016/j.procbio.2005.09.006 Ramos I, Fdz-Polanco M (2014) Microaerobic control of biogas sulphide content during sewage sludge digestion by using biogas production and hydrogen sulphide concentration. Chem Eng J 250(0):303–311. doi:10.1016/j.cej.2014.04.027 Rodriguez G, Dorado AD, Fortuny M, Gabriel D, Gamisans X (2014) Biotrickling filters for biogas sweetening: oxygen transfer improve- ment for a reliable operation. Process Saf Environ Prot 92(3):261– 268. doi:10.1016/j.psep.2013.02.002 Sahinkaya E, Hasar H, Kaksonen AH, Rittmann BE (2011) Performance of a sulfide-oxidizing, sulfur-producing membrane biofilm reactor treating sulfide-containing bioreactor effluent. Environ Sci Technol 45(9):4080–4087. doi:10.1021/es200140c Sahinkaya E, Kilic A, Duygulu B (2014) Pilot and full scale applications of sulfur-based autotrophic denitrification process for nitrate remov- al from activated sludge process effluent. Water Res 60(0):210–217. doi:10.1016/j.watres.2014.04.052 Sahinkaya E, Yurtsever A, AktaƟ Ö, Ucar D, Wang Z (2015) Sulfur-based autotrophic denitrification of drinking water using a membrane bio- reactor. Chem Eng J 268(0):180–186. doi:10.1016/j.cej.2015.01. 045 Shang G, Shen G, Liu L, Chen Q, Xu Z (2013) Kinetics and mechanisms of hydrogen sulfide adsorption by biochars. Bioresour Technol 133(0):495–499. doi:10.1016/j.biortech.2013.01.114 Syed M, Soreanu G, Falletta P, BĂ©land M (2006) Removal of hydrogen sulfide from gas streams using biological processes—a review. Can Biosyst Eng 48:2 Tafdrup S (1995) Viable energy production and waste recycling from anaerobic digestion of manure and other biomass materials. Biomass Bioenergy 9(1):303–314 Tang K, Baskaran V, Nemati M (2009) Bacteria of the sulphur cycle: an overview of microbiology, biokinetics and their role in petroleum and mining industries. Biochem Eng J 44(1):73–94 Üresin E, Saraç HÄ°, Sarıoğlan A, Ay ƞ, AkgĂŒn F (2014) An experimental study for H2S and CO2 removal via caustic scrubbing system. Process Safety and Environmental Protection (0) doi:10.1016/j. psep.2014.06.013 YĂŒcel M, Konovalov SK, Moore TS, Janzen CP, Luther Iii GW (2010) Sulfur speciation in the upper black sea sediments. Chem Geol 269(3–4):364–375. doi:10.1016/j.chemgeo.2009.10.010 Zhang TC, Lampe DG (1999) Sulfur:limestone autotrophic denitrifica- tion processes for treatment of nitrate-contaminated water: batch experiments. Water Res 33(3):599–608. doi:10.1016/S0043- 1354(98)00281-4 948 Appl Microbiol Biotechnol (2016) 100:939–948