2. However, the performance of HFMC declines when it is used for long
operational periods, owing to penetration of solvent through the pores
of wetted membranes (Table S1, Supplementary materials). By selecting
non-porous dense polymeric membranes, these problems can be
eliminated.
Accordingly, in this study a PDMS membrane gas purification and
bio-oxidation processes were combined. During the process, H2S is first
dissolved in an aqueous absorption liquid according to reaction 1, fol-
lowed by two dissociation reactions 2 and 3. In order to maintain a high
H2S diffusion rate, mildly alkaline solution is generally used. Then, bio-
oxidation of H2S occurs in the bioreactor according to reactions 4 and 5.
The route of H2S oxidation is dependent on the concentration of
oxygen, i.e., it is oxidized to elemental sulfur (So
) or sulfate under
oxygen limiting and non-limiting conditions, respectively.
↔
H S H S
2 gas 2 aq (1)
+ − ↔ + =
− − +
H S OH HS H (pKa 7.0)
2 aq (2)
+ ↔ + =
− − −
HS OH S H O (pKa 12.9)
2
2 (3)
+ ↔ + = −
− − −
Δ
HS 0.5O S OH ( G 169.35 kJ.mol )
2
o o 1
(4)
+ ↔ + = −
− − + −
Δ
HS 2O SO H ( G 732.58 kJ.mol )
2 4
2 o 1
(5)
It is clear that the concentration of CO2 in biogas is much higher
than H2S, and both have similar acidic behavior. CO2 and H2S can both
be absorbed in an alkaline solution (Miltner et al., 2017; Ryckebosch
et al., 2011). Absorption, hydrolysis and dissociation of CO2 in alkaline
solutions are indicated in reactions 6–9. Hence the removal of CO2
generates additional H+
, which can decrease the pH of the absorption
liquid according to reactions 8 and 9. In order to maintain a high H2S
removal efficiency, pH of the absorption liquid needs to be high;
therefore, extra alkali should be supplemented, which increases the
operational costs.
↔
CO CO
2gas 2aq (6)
+ ↔
CO H O H CO
2aq 2 2 3aq (7)
↔ + =
− +
H CO HCO H (pKa 6.4)
2 3aq 3 (8)
+ ↔ + =
− − −
HCO OH CO H O (pKa 10.3)
3 3
2
2 (9)
The CO2 removal should be minimized to reduce the alkali chemical
consumption, which can be achieved by using non-porous dense PDMS
membranes due to its higher selectivity towards H2S compared to CO2
(Montoya, 2010; Tilahun et al., 2017). The objective of this study was
to evaluate the performance of a novel hybrid membrane bio-scrubber
(MBS) process for selective H2S removal from a simulated biogas. In
addition, the effects of the absorption liquid pH, gas flowrate (loading)
and DO concentration on biogas desulfurization performance were
discussed.
2. Materials and methods
2.1. Experimental set-up and operation
The laboratory scale hybrid membrane bio-scrubber contactor setup
used in this study was shown in Fig. 1. It was consisted of a cylindrical
glass reactor with 120 mm of diameter and 200 mm of depth and a
working volume of 1.5 l. The glass reactor was filled completely with
tap water to minimize the volatilization of the sulfur compounds. Be-
sides, it was operated by feeding with a simulated biogas (Hat Industrial
Gases PLC, Kocaeli, Turkey) containing 60% (v/v) CH4, 39% (v/v) CO2,
and 1% (v/v) (10,000 ppmv) H2S through the PDMS tubular mem-
brane. The membrane was folded and fully submerged into the ab-
sorption liquid. The flowrate of the biogas was adjusted and controlled
by using mass flow controller at outlet of the gas cylinder and measured
by gas counters (MGC, Ritter) both in the influent and effluent of the
membrane contactor. The commercial tubular PDMS membrane
(EUROFLEX GmbH, Germany) had an internal diameter of 7.0 mm, wall
thickness of 1.0 mm and length of 3.25 m, corresponding to a total
surface area of 9.2 dm2
. The reactor was inoculated with the sludge
taken from a laboratory scale aerobic membrane bioreactor treating
sulfide containing textile wastewater. The inoculum consisted of two
dominating sulfide oxidizing bacteria, Thiobacillus spp. and Thioalk-
alivibrio sulfidiphilus (Yurtsever et al., 2017). The liquid medium was
composed of (g/l): K2HPO4 2.0, NH4Cl 0.4, MgCl2·6H2O 0.2 and tap
water. Due to low cost and its effectiveness, NaOH was used as alkaline
chemical (Jegatheesan et al., 2015). Conductivity of the absorption li-
quid in the bioreactor increased during the operation due to NaOH
addition and sulfate generation. Hence, around 2/3 of the absorption
liquid was periodically removed from the bioreactor not to disturb the
bacterial activity when conductivity raised over 7 mS/cm. During the
operation, the absorption liquid was aerated to supply oxygen to sulfide
oxidizing bacteria as electron acceptor. The reactor content was con-
tinuously stirred with a magnetic stirrer at 550 rpm to achieve complete
mixing and to control the attachment of biomass on the membrane
surface. The pH of the absorption liquid was controlled automatically
by addition of NaOH (1N) with a pH transmitter and a dosing pump
(Seko, PR 40/Q). The temperature was kept at 30 ± 1 °C using an
electric heating pad wrapped around the bioreactor. During the ex-
periments, conductivity, oxidation reduction potential (ORP) and dis-
solved oxygen (DO) were monitored online using a digital multimeter
(Multi 9430, WTW GmbH, Germany). The hybrid membrane bio-
scrubber (MBS) operating parameters were shown in Table 1.
2.2. Analytical methods
The CO2, H2S and CH4 compositions in the inlet and outlet of the
membrane contactor were measured using a gas chromatograph
(Shimadzu GC-2014, Japan) equipped with thermal conductivity de-
tector (TCD) (Reddy et al., 2016). Sulfide concentrations in the ab-
sorption liquid were determined spectrometrically (DR/2800, HACH,
USA) following the methylene blue method described by Standard
Methods (APHA/AWWA/WEF, 2012). In the MBS liquor samples, fol-
lowing 0.45 μm filtration, sulfate, thiosulfate and sulfite concentrations
were analyzed daily using an ion chromatography. Biomass con-
centration in the bioreactor was estimated by measuring Total Kjeldahl
(TKN) according to standard methods (APHA/AWWA/WEF, 2012).
Before analyzing TKN, the liquid sample was centrifuged and the bio-
mass was washed 3 times with deionized water to remove dissolved
nitrogen compounds. The presence and crystal structure of elemental
sulfur (So
) and other byproducts from the suspended biofilms of the
MBS reactor was examined using X-Ray diffraction (XRD). The mor-
phology of clean and used membrane surface at the end of the experi-
ment period was examined using an optical microscope and scanning
electron microscopy (SEM) images. In addition, SEM coupled with
Energy Dispersive X-ray Spectroscopy (EDS) analyses were conducted
to determine the inorganic content of the biofilm attached on the ex-
ternal surface area of the membrane.
2.3. Calculations
In this study, the CO2 or H2S gas phase removal efficiencies (R) and
CH4 loss were calculated according to Eq. (10).
=
−
R (%)
(Q in*C in) (Q out*C out)
(Q in*C in)
*100
g g g g
g g (10)
where, R-gas phase removal efficiencies, Qg
in
– inlet biogas flowrate
(m3
/d), Qg
out
– outlet biogas flowrate (m3
/d), Cg
in
- inlet gas con-
centrations (mg/l), Cg
out
- outlet gas concentrations (mg/l). In gas
purification processes the performance of the system can be indicated
also by computing the selectivity factor. Selectivity of the gas-liquid-
E. Tilahun et al. International Biodeterioration & Biodegradation 127 (2018) 69–76
70
3. membrane contacting system for H2S may be defined as the ratio of H2S
over CO2 concentrations in the liquid phase to that in the gas phase (Eq.
(11)). Likewise, the selectivity of H2S over CH4 was calculated ac-
cording to Eq. (12).
=
α(H S/CO )
(xH S/xCO )
(yH S/yCO )
2 2
2 2
2 2 (11)
=
α(H S/CH )
(xH S/xCH )
(yH S/yCH )
2 4
2 4
2 4 (12)
where, α is dimensionless which represents the selectivity factor, x -
denotes the mole fraction of the biogas components absorbed in the
liquid phase and y - denotes the mole fraction of the biogas components
in the feed gas. Surface removal rate or absorption flux (J) of the
membrane contactor is another performance indicator, which can be
estimated as Eq. (13).
=
−
J
(Q in*C in) (Q out*C out)
A
g g g g
(13)
where, J is the flux of the gas components (g/m2
.d) and A is the
membrane surface area (m2
). The total H2S removal efficiency (TSR) of
the system was calculated according to Eq. (14).
=
− −
TSR (%)
(Q in*C in(H S)) (Q out*C out(H S)) (Q out*C out(H S))
(Q in*C in(H S))
*
100
g g 2 g g 2 L L 2
g g 2
(14)
where: QL
out
– outlet liquid flowrate (m3
/d), CL
out
- outlet liquid con-
centrations (mg/l). The process capacity for H2S removal was also
calculated as volumetric removal rate (VSRR) according to Eq. (15).
=
− −
VSRR (g/m . d)
(Q in*C in(H S)) (Q out*C out(H S)) (Q out*C out(H S))
V
3
g g 2 g g 2 L L 2
(15)
where: V is the active volume of the reactor (m3
). The quantity of
elemental sulfur (So
) produced can be estimated theoretically by sub-
tracting the aqueous sulfur species that exist in the absorption liquid.
Since the concentrations of thiosulfate and sulfite were below the de-
tection limit throughout the study, the mass balance calculation was
performed according to Eq. (16).
− = −
+ − + − + −
− −
Q in*C in(S H S) Q out*C out(S H S)
Q out*C out [(S HS ) (S SO ) (S S )]
g g 2 g g 2
L L 4
2 o
(16)
where: (S-So
) is the concentration of So
produced (g So
/1), (S-H2S) is the
concentration of H2S in the gas phase (g S-H2S/l), (S–SO4
−2
) is the
concentration of SO4
−2
generation (g S–SO4
−2
/1) and (S–HS−
) is the
concentration of non-oxidized sulfide ion in the liquid (g S–HS−
/1).
3. Results and discussion
3.1. Desulfurization performance of MBS process
The influence of different operational parameters on the perfor-
mance of the system was investigated with long-term experiments. The
desulfurization of biogas in the hybrid MBS occurred in two steps.
Firstly, the H2S diffused across the membrane and dissolved in the
mildly alkaline absorption liquid. Secondly the dissolved sulfide was
oxidized by the sulfide oxidizing bacteria (SOB) on the membrane
Fig. 1. Schematic diagram of experimental setup: (1) synthetic biogas cylinder, (2) milligas counter, (3) air pump, (4) magnetic stirrer, (5) pH transmitter and temperature sensor, (6)
NaOH dosage pump, (7) NaOH solution, (8) tubular PDMS membrane, (9) effluent biogas bag, (10) heating blanket, (11) Multi probes meter.
Table 1
The MBS operational parameters.
Parameters Unit Period I Period II
Operation duration d 105 75
Biogas flowrate l/d 8–32 14
DO concentration mg/l 4 1–4
ORP mV 80–100 100 to −300
Conductivity mS/cm 2–7 2–7
pH of absorption liquid 7–8.5 7
Inlet surface H2S loading g/m2
.d 1.29–5.1 2.3
Inlet volumetric H2S loading g/m3
.d 79–316 140
Temperature of absorption liquid o
C 30 30
Operating absolute pressure pa ≈105
≈105
E. Tilahun et al. International Biodeterioration & Biodegradation 127 (2018) 69–76
71
4. surface or in the suspension. The DO concentration kept constant (about
4 mg/l) in the first operational period (Table 1). As a general trend the
gas phase H2S removal efficiency (R) was enhanced when the gas
flowrate decreased due to longer contact time between the gas and
membrane (Table 2). Besides, altering the pH of the absorption liquid
affect H2S removal efficiency. Particularly at pH 7 with a gas flowrate of
8 l/d, a gas phase H2S removal efficiency (R) reached above
99.5 ± 0.3%. This efficiency was higher compared to the results we
achieved formerly at pH 7 (94%) using an abiotic membrane scrubber
(AMS) (Tilahun et al., 2017). Moreover, when the gas flowrate was
raised four fold (32 l/d), the biotic MBS removed H2S more effectively
than AMS by about 44%. In the former study, the maximum gas phase
H2S removal, at pH 7 with gas flowrate of 32 l/d, was only 36%. It is
understood that in the abiotic process the diffused H2S accumulated in
the liquid phase, but not oxidized, therefore the liquid becomes satu-
rated. However, in the biotic MBS the diffused H2S immediately oxi-
dized by SOB and kept greater H2S driving force between the gas and
liquid (biofilm) phase. Marzouk et al. (2010) studied on removal of H2S
using hollow fiber membrane contactor and they reported a drop in
removal efficiency from 100 to 74%, when the gas flowrate increased
from 0.576 to 1.44 m3
/d. As shown in Table 2, at about 15 l/d of gas
flowrate, the effluent biogas contained less than 300 ppmv of H2S gas.
The achievement of such relatively low concentration of H2S in the
outlet stream proves the adequacy and applicability of the hybrid MBS
process. In this way, a biogas desulfurized with the hybrid MBS can be
directly used in a co-generation unit without any hesitation (Díaz et al.,
2011; Ramos and Fdz-Polanco, 2014). On the other hand, increasing the
gas flowrate by four times resulted in an increase in H2S and CO2 flux
from 1.29 ± 0.01 to 3.99 ± 0.012 g/m2
.d and from 43 ± 1 to
58 ± 1 g/m2
.d, respectively (Table 2). This result revealed that high
H2S removal capacity was achieved while CO2 removal was kept low,
because H2S could easily diffused through the membrane and became
available for SOB. With AMS we formerly (Tilahun et al., 2017) ob-
served a maximum H2S and CO2 flux capacity of 1.9 g/m2
.d and 58 g/
m2
.d. Hence, in the present study H2S flux was significantly higher than
that obtained in our earlier report. In summary, the preliminary results
indicated that the biotic MBS was more effective than abiotic mem-
brane scrubber (AMS) for desulfurization of biogas and has a great
potential for real scale applications.
In conventional biodesulfurization processes, especially the ni-
trogen in air which introduced into the reactor dilutes the biogas
(Jenicek et al., 2010, 2008; Krayzelova et al., 2015). However, in this
study, the biogas stream was separated from aerated liquid by a
membrane. As a result, dilution problem was not observed here, instead
the CH4 content in the outlet stream increased from 60% to 81 ± 1%
and from 60 to 67 ± 0.5%, when the gas flowrate was 8 and 32 l/d,
respectively. The CH4 content of the biogas increased mainly due to the
reduction in CO2 concentration, because CO2 has significantly higher
permeability across the membrane and higher solubility in water
compared to CH4. The loss of CH4 in this particular study was minimal
(less than 3.4%) due to its lower transfer ability across the PDMS
membrane (Table 2). In general, the results obtained here was able to
conserve the energy content of the biogas. Charnnok et al. (2013) stu-
died on biogas desulfurization using a biofilter process, and they stated
an increase in the CH4 content of the biogas from 80 to 83%. In con-
trast, Chaiprapat et al. (2011) reported a decrease of about 20% in total
CH4 content, due to the dilution of biogas with air that was fed to the
biofilter to maintain the aerobic conditions. Thereby, the process used
here could achieve a high biogas desulfurization performance with a
considerable CH4 enrichment at the outlet stream of the membrane
contactor without any dilution problem.
According to the result shown in Table 2, the higher the gas flow-
rate, the higher the selectivity of H2S/CO2 and H2S/CH4. This phe-
nomenon could be explained by the differences of H2S permeability and
solubility in the membrane and mildly alkali absorption liquid, re-
spectively (Baker, 2004; Kennedy et al., 2015; Tilahun et al., 2017).
Former studies revealed that the dominant mass transfer resistance for
H2S absorption is on the gas side, while CO2 is on the liquid-side, which
means that the dissociation of H2S in the alkali absorption liquid (re-
action 2) is much faster than that of CO2 (reaction 8). In addition, the
biological oxidation of sulfide increases the driving force and allows
gaseous H2S to dissolve more in the aqueous phase. Thus desulfuriza-
tion selectivity could be retained at high level compared to CO2 and
CH4. In this study the highest H2S/CO2 and H2S/CH4 selectivity values
were 3.5 and 63 at the highest gas flowrate (32 l/d) and pH 7, which
was 2 times higher than those reported in our previous study where the
H2S was chemically absorbed by an alkaline solution after being dif-
fused through the PDMS membrane (Tilahun et al., 2017). Similar
conclusions were also drawn by the others indicating that rising the gas
flowrate improved the selective removal of H2S gas (Bontozoglou and
Karabelas, 1993; Lu et al., 2006). On the other hand, the selectivity was
inversely proportional to gas phase H2S removal efficiency. Therefore,
the gas flowrate and pH should be optimized to achieve a selective
biogas desulfurization and to maintain a high gas phase H2S removal
efficiency with minimal caustic consumption.
3.2. The effects of pH and volumetric H2S loading on sulfide oxidation
In this study, the first 23 days of operation were considered as
adaptation period of the SOB. The rest of the period 1 was divided into
three stages, i.e. stages I (pH 7), II (pH 7.75), III (pH 8.5), to evaluate
the impact of operational pH on the total system performance (Fig. 2).
During each of these stages the reactor was subjected to a range of
loading conditions, A (79 g H2S/m3
.d), B (148 g H2S/m3
.d), C (227 g
H2S/m3
.d), D (316 g H2S/m3
.d). The vertical dotted lines in Fig. 2 in-
dicate the days at which the H2S loading rate increased. At this period
Table 2
The effects of different operational parameters on the performance efficiency of the membrane (DO concentration in the absorption liquid was 4 mg/l).
pH Gas flowrate
(l/d)
Gas phase removal (R) (%) Selectivity Gas flux (g/m2
.d)
H2S CO2 CH4 H2S/CH4 H2S/CO2 H2S CO2 CH4
7.0 8 99.5 67.2 2.80 36.0 1.48 1.29 43.6 1.00
15 96.8 44.4 2.00 47.6 2.18 2.28 52.4 1.34
23 84.6 33.2 1.53 55.3 2.55 3.02 59.4 1.53
32 80.4 23.4 1.30 62.9 3.44 4.00 58.1 1.77
7.75 8 99.2 62.8 3.10 32.1 1.58 1.27 40.3 1.11
15 96.2 42.6 2.40 40.5 2.26 2.24 49.8 1.55
23 83.3 33.7 1.80 47.2 2.47 3.03 61.3 1.79
32 79.0 25.4 1.60 50.4 3.11 3.85 61.9 2.13
8.5 8 99.8 65.9 3.38 29.5 1.51 1.30 42.9 1.23
15 96.1 40.9 2.67 36.0 2.35 2.25 47.9 1.74
23 82.5 35.9 2.13 38.8 2.29 2.97 64.9 2.14
32 79.9 27.6 1.69 47.4 2.89 3.92 67.8 2.31
E. Tilahun et al. International Biodeterioration & Biodegradation 127 (2018) 69–76
72
5. the DO concentration inside the reactor was maintained at about 4 mg/l
by controlling the airflow rate.
At all tested pH values, total H2S removal (TSR) efficiency of
97.9 ± 0.7% was observed at volumetric loading rate (VLR) of 79 g
H2S/m3
.d (8 l/d), while the TSR decreased to 78.2 ± 1.2% when the
volumetric loading rate increased to 316 g H2S/m3
.d (32 l/d). The TSR
reduction at higher volumetric loading presumably due to the limita-
tion of the membrane mass transfer capacity. Moreover, the maximum
volumetric H2S removal rate (VSRR) of the system reached up to 251 g
H2S/m3
.d, at the highest VLR (316 g H2S/m3
.d) (Table 3). Other lit-
erature (Kumar et al., 2010) used PDMS/polyacrylonitrile (PAN) com-
posite membrane biofilm reactor for the reduction of dimethyl sulfide
from waste air, and they observed removal rate of 258 g/m3
.h. De Bo
et al. (2003) also studied on removal of dimethyl sulfide using PDMS/
Polyvinylidene Fluoride (PVDF) composite membrane bioreactor, and
they achieved a maximum of 120 g/m3
.h dimethyl sulfide removal rate.
It is clear that, a composite membrane bioreactor combines the best
characteristics of both porous (high mass transfer rate) and dense
nonporous materials (prevent wetting and biofouling problem). The
removal rate reported here was similar to those found in biofilters or
biotrickling filters (Bak et al., 2017; Ma et al., 2006; Ramírez et al.,
2009; Sublette et al., 1994).
Fig. 2 illustrated, under low volumetric H2S loading rate (79 g/
m3
.d) sulfate generation capacity was 233 ± 8 g SO4/m3
.d and it
accounts 75% of the theoretical sulfate generation. The theoretical
sulfate concentrations were calculated based on the assumption of
complete sulfide oxidation to sulfate. It was also displayed in the route
of H2S oxidation that at limited sulfide loading the biological sulfide
oxidation is in favor of reaction 5. When the VLR elevated to 316 g H2S/
m3
.d, the sulfate generation gradually increased up to 524 ± 49 g
SO4/m3
.d, (only 54% of the theoretical sulfate generation) (Fig. 2). The
reduction in the theoretical sulfate generation efficiency was related to
the incomplete oxidation of sulfide due to the decreased oxygen con-
centration in the biofilm or flocs at high loadings and the precipitation
of sulfate ions particularly at higher pH, which was also verified by XRD
analyses. As seen in Fig. 2, at higher pH value, the alkaline consumption
was greater. In addition to this, when the pH raised to 8.5, the corre-
sponding non-oxidized sulfide concentration in the liquid increased up
to 11 mg/l. This happened due to decreased biomass activity at higher
pH values. Ramírez et al. (2009) studied on the elimination of hydrogen
sulfide using a biotrickling filter containing Thiobacillus thioparus spe-
cies, and they described that the biological removal efficiency de-
creased from 88 to 72% when the pH of the liquid increased from 7.5 to
8.5. Specific to the desulfurization system of this work, optimal treat-
ment performance was obtained at a loading rate of approximately
148 g H2S/m3
.d and absorption liquid pH of 7 with TSR of above 97%.
3.3. Fate of sulfide oxidation at different DO concentrations
In period 2, the DO concentration decreased stepwise to investigate
its effects on elemental sulfide (So
) formation, sulfide removal effi-
ciency and caustic consumption. Three stages were established, stage I2
(DO 4 ± 0.5 mg/l), II2 (DO 2 ± 0.3 mg/l) and III2 (DO
0.9 ± 0.15 mg/l) (Fig. 3). Throughout the 75 days of operation, VLR,
gas flowrate and reactor pH were maintained at 140 g H2S/m3
.d, 14 l/
d, 7, respectively. From day 112 to day 126, due to failure of the
temperature control unit the system run at room temperature. Ac-
cordingly, the lower temperature (12–18 °C) adversely affected the
activity of SOB. Starting from day 127, the liquid temperature again
increased to 30 ± 1 °C and the ionic sulfur species in the liquid were
monitored to evaluate the fate of sulfur in the MBS system.
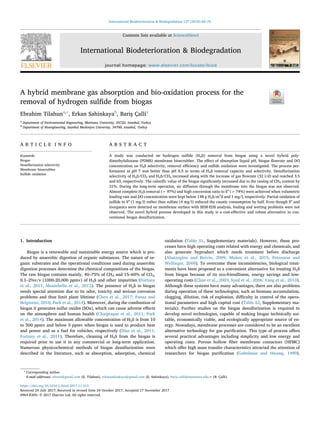
In summary, the results revealed that So
formation was significantly
affected by DO concentrations. Even though the biologically produced
So
was not directly measured, the analyses of the solid deposits by SEM-
EDS confirmed that the deposit was mainly composed of So
and other
inorganic components, such as C, N, O, P, Na, K, Si, Ca and Mg attached
on the external surface of the membrane (Fig. 4). Moreover, the results
of XRD analysis showed the presence of So
and other compounds which
were suspended in the liquid side of the membrane. Although So
and
other inorganics were detected on the membrane surface and sus-
pended in the liquid but not any fouling, clogging and wetting problems
were observed in the long run experiments. This happened possibly
because of two reasons; (i) the hydrophobic nature of the membrane
resists the excess attachment of inorganics, (ii) in nonporous membrane
there is no liquid flow through the membrane. However, in previous
studies due to the blockage and conventional liquid flow through the
membrane pores wetting and fouling were the main drawbacks
(Atchariyawut et al., 2007; Attaway et al., 2002; Wang et al., 2014).
The major sulfur species detected in the absorption liquid were
sulfate and So
, and it accounts more than 97% of the diffused H2S, while
less than 3% of the diffused H2S was found to be in dissolved form. Our
result was in agreement with the earlier study (Buisman et al., 1989).
They observed comparable outcomes as a result of the oxidation of
dissolved sulfide in a continuously stirred tank bioreactor. On other
hand, the production of sulfate and So
were varied significantly de-
pending on the DO concentration in the membrane bio reactor (Fig. 3a
and b). The absorption liquid was replaced (2/3 of the active volume) at
days 134, 143, 151, 158 and 171 in order to remove the accumulated
salts of sulfate and alkalinity, which could negatively affect the activity
of SOB. As seen in Fig. 3b, the So
production increased significantly
(100 mg/d) when the DO concentration decreased to approximately
1 mg/l. Reaction 4 also confirms, the greater the oxygen limitation the
Time (day)
0 20 40 60 80 100
)
d
/
l
/
g
m
(
n
o
i
t
c
u
d
o
r
p
e
t
a
f
l
u
S
0
200
400
600
800
1000
1200
NaOH
consumption
(g/d)
0.0
0.2
0.4
0.6
0.8
1.0
1.2
1.4
1.6
Stage I Stage II Stage III
A B D
C A B C D B D
A C
Measured sulfate
NaOH
Theoretical sulfate
Fig. 2. Sulfate production and NaOH consumption at different absorption liquid pH and
volumetric sulfide loading.
Table 3
The effects of absorption liquid pH and volumetric loading rate on sulfide oxidation.
pH Gas flowrate
(l/d)
Total H2S
removal
efficiency
Volumetric H2S
removal rate
Non-oxidized HS−
in liquid effluent
(mg/l)
TSR (%) VSRR (g/m3
.d)
7.0 8 98.62 77.91 0.7
15 95.78 141.8 1.6
23 83.37 189.3 2.9
32 79.54 251.4 4.8
7.75 8 97.95 77.38 1.0
15 94.92 140.5 2.0
23 81.44 184.9 3.7
32 77.67 245.4 6.2
8.5 8 97.20 76.79 2.1
15 92.84 137.4 4.9
23 78.97 179.3 8.1
32 77.28 244.2 11
E. Tilahun et al. International Biodeterioration & Biodegradation 127 (2018) 69–76
73
6. more the So
and less sulfate formation, because So
formation requires
only one-fourth of oxygen needed for the conversion to sulfate. In ad-
dition, a white to yellowish color was observed in the reactor indicating
the accumulation of biologically produced So
particles. This finding was
in consistent with the observation of other studies (Bayrakdar et al.,
2016; Cardoso et al., 2006). The So
formation was also confirmed with
the measured ORP values which fluctuated in range of −50 to
−300 mV. Low ORP values are usually reported when So
was the main
end product of sulfide oxidation (Khanal and Huang, 2003; Kobayashi
et al., 2012).
As illustrated in Fig. 3b, at DO concentration of about 4 mg/l, the
average caustic consumption was around 0.248 ± 0.012 g/d. De-
creasing the DO concentration to 1 mg/l induced a saving of 0.1 g/d of
NaOH, due to alkalinity generation during the oxidation of HS−
to So
according to reaction 4. Former studies also investigated the advantage
of operating the process with limited oxygen and decreased the ORP
value to minimize the caustic consumption (Janssen et al., 1995;
Kleinjan et al., 2006). A better control of DO concentration should be
applied in order to have steady and cost effective operation. Operating
the MBS at very low DO concentrations may lead to additional mem-
brane resistance due to the attachment of excess biomass on the
membrane surface as a result of limited oxygen. Whereas, supplying
excess DO may lead to sulfate accumulation in the liquid which can
negatively affect the activity of SOB and requires high alkaline con-
sumption for neutralizing the absorption liquid (reaction 5).
4. Conclusions
In this study, almost all of the H2S and half of the CO2 were suc-
cessfully removed and accordingly the calorific value of the biogas in-
creased by about 25%. Partial oxidation of the membrane separated
H2S to So
rather than sulfate decreased the operational cost by reducing
the caustic consumption and aeration requirement. During the long-
term operation fouling, wetting and dilution problems were not
)
d
/
l
/
g
m
(
n
o
i
t
c
u
d
o
r
p
e
t
a
f
l
u
S
0
200
400
600
800
Measured sulfate
Theoretical sulfate
I2 III2
II2
)
d
/
g
(
H
O
a
N
0.0
0.1
0.2
0.3
S
o
Production
(g/d)
0.00
0.05
0.10
0.15
0.20
0.25
0.30
NaOH So Production
Time (day)
120 140 160 180
CH
4
O
C
d
n
a
2
)
%
(
t
n
e
u
l
f
f
e
0
20
40
60
80
H
2
S
effluent
(%)
0.0
0.2
0.4
0.6
0.8
CO2
CH4 H2S
a
b
c
Fig. 3. The effect of DO concentration on (a)
sulfate production, (b) So
production and NaOH
consumption, (c) effluent biogas components. The
dotted lines in this figure indicates the days when
2/3 of the reactor medium was replaced by tap
water due to salinity accumulation.
E. Tilahun et al. International Biodeterioration & Biodegradation 127 (2018) 69–76
74
7. observed. The hybrid membrane bio-scrubbing process developed in
this study is an easy-to-operate and cost-effective alternative than
conventional desulfurization technologies and has a great potential for
real scale applications.
Acknowledgments
This study was financially supported by YTB (Hükümet Bursu-
Doktora-11ET057350) (Presidency for Turks Abroad and Related
Communities) and Marmara University Scientific Research Committee
BAPKO (Project No. FEN-C-DRP-070317-0109).
Appendix A. Supplementary data
Supplementary data related to this article can be found at http://dx.
doi.org/10.1016/j.ibiod.2017.11.015.
References
Abatzoglou, N., Boivin, S., 2009. A review of biogas purification processes. Biofuels,
Bioprod. Biorefining 3, 42–71. http://dx.doi.org/10.1002/bbb.117.
APHA/AWWA/WEF, 2012. Standard methods for the examination of water and waste-
water. Stand. Methods 541 ISBN 9780875532356.
Atchariyawut, S., Jiraratananon, R., Wang, R., 2007. Separation of CO2 from CH4 by
using gas-liquid membrane contacting process. J. Memb. Sci. 304, 163–172. http://
dx.doi.org/10.1016/j.memsci.2007.07.030.
Attaway, H., Gooding, C.H., Schmidt, M.G., 2002. Comparison of microporous and non-
porous membrane bioreactor systems for the treatment of BTEX in vapor streams. J.
Ind. Microbiol. Biotechnol. 28, 245–251. http://dx.doi.org/10.1038/sj/jim/
7000235.
Bak, A., Kozik, V., Dybal, P., Sulowicz, S., Kasperczyk, D., Kus, S., Barbusinski, K., 2017.
Abatement robustness of volatile organic compounds using compact trickle-bed
bioreactor: biotreatment of styrene, ethanol and dimethyl sulfide mixture in
contaminated airstream. Int. Biodeterior. Biodegr. 119, 316–328. http://dx.doi.org/
10.1016/j.ibiod.2016.10.039.
Baker, R.W., 2004. Membrane Technology and Application. John Wiley &Sons, Ltdhttp://
dx.doi.org/10.1016/0301-4215(90)90150-3.
Bayrakdar, A., Tilahun, E., Calli, B., 2016. Biogas desulfurization using autotrophic de-
nitrification process. Appl. Microbiol. Biotechnol. 100. http://dx.doi.org/10.1007/
s00253-015-7017-z.
Bontozoglou, V., Karabelas, A.J., 1993. Simultaneous absorption of hydrogen sulfide and
carbon dioxide in sodium hydroxide solutions: experimental and numerical study of
the performance of a short-time contactor. Ind. Eng. Chem. Res. 32, 165–172. http://
dx.doi.org/10.1021/ie00013a022.
Buisman, C., Post, R., Ijspeert, P., Geraats, G., Lettinga, G., 1989. Biotechnological process
for sulphide removal with sulphur reclamation. Acta Biotechnol. 9, 255–267. http://
dx.doi.org/10.1002/abio.370090313.
Cardoso, R.B., Sierra-Alvarez, R., Rowlette, P., Flores, E.R., Gómez, J., Field, J.A., 2006.
Sulfide oxidation under chemolithoautotrophic denitrifying conditions. Biotechnol.
Bioeng. 95, 1148–1157. http://dx.doi.org/10.1002/bit.21084.
Chaiprapat, S., Mardthing, R., Kantachote, D., Karnchanawong, S., 2011. Removal of
hydrogen sulfide by complete aerobic oxidation in acidic biofiltration. Process
Biochem. 46, 344–352. http://dx.doi.org/10.1016/j.procbio.2010.09.007.
Charnnok, B., Suksaroj, T., Boonswang, P., Chaiprapat, S., 2013. Oxidation of hydrogen
sulfide in biogas using dissolved oxygen in the extreme acidic biofiltration operation.
Bioresour. Technol. 131, 492–499. http://dx.doi.org/10.1016/j.biortech.2012.12.
114.
Chen, S., Frank Cheng, Y., Voordouw, G., 2017. A comparative study of corrosion of 316L
stainless steel in biotic and abiotic sulfide environments. Int. Biodeterior.
Biodegradation 120, 91–96. http://dx.doi.org/10.1016/j.ibiod.2017.02.014.
Cline, C., Hoksberg, A., Abry, R., Janssen, A., 2003. Biological process for H2S removal
from gas streams: the Shell-Paques/Thiopaq ™ gas desulfurization process. Proc.
Laurance Reid Gas. Cond. Conf. 1–18.
De Bo, I., Heyman, J., Vincke, J., Verstraete, W., Van Langenhove, H., 2003. Dimethyl
sulfide removal from synthetic waste gas using a flat poly(dimethylsiloxane)-coated
composite membrane bioreactor. Environ. Sci. Technol. 37, 4228–4234. http://dx.
doi.org/10.1021/es020168f.
Díaz, I., Pérez, S.I., Ferrero, E.M., Fdz-Polanco, M., 2011. Effect of oxygen dosing point
and mixing on the microaerobic removal of hydrogen sulphide in sludge digesters.
Bioresour. Technol. 102, 3768–3775. http://dx.doi.org/10.1016/j.biortech.2010.12.
016.
Fortuny, M., Gamisans, X., Deshusses, M.A., Lafuente, J., Casas, C., Gabriel, D., 2011.
Fig. 4. Membrane analyses results of (a) EDS, (b) SEM photographs before experiment and (c) SEM photographs after experiment.
E. Tilahun et al. International Biodeterioration & Biodegradation 127 (2018) 69–76
75
8. Operational aspects of the desulfurization process of energy gases mimics in bio-
trickling filters. Water Res. 45, 5665–5674. http://dx.doi.org/10.1016/j.watres.
2011.08.029.
Gabelman, A., Hwang, S.-T., 1999. Hollow fiber membrane contactors. J. Memb. Sci. 159,
61–106. http://dx.doi.org/10.1016/S0376-7388(99)00040-X.
Janssen, A.J.H., Sleyster, R., van der Kaa, C., Jochemsen, A., Bontsema, J., Lettinga, G.,
1995. Biological sulphide oxidation in a fed-batch reactor. Biotechnol. Bioeng. 47,
327–333. http://dx.doi.org/10.1002/bit.260470307.
Jegatheesan, V., Abdikheibari, S., Marleni, N., Phelan, S., Park, K., Bagshaw, S., Farago,
L., Shu, L., 2015. Estimating hydrogen sulphide dissipation rate constant under the
influence of different chemical dosing. Int. Biodeterior. Biodegrad. 101, 47–55.
http://dx.doi.org/10.1016/j.ibiod.2015.03.026.
Jenicek, P., Keclik, F., Maca, J., Bindzar, J., 2008. Use of microaerobic conditions for the
improvement of anaerobic digestion of solid wastes. Water Sci. Technol. 58,
1491–1496. http://dx.doi.org/10.2166/wst.2008.493.
Jenicek, P., Koubova, J., Bindzar, J., Zabranska, J., 2010. Advantages of anaerobic di-
gestion of sludge in microaerobic conditions. Water Sci. Technol. 62, 427 LP-434.
Kennedy, N., Zhao, Q.B., Ma, J., Chen, S., Frear, C., 2015. The selective removal of H2S
over CO2 from biogas in a bubble column using pretreated digester effluent. Sep.
Purif. Technol. 144, 240–247. http://dx.doi.org/10.1016/j.seppur.2015.02.046.
Khanal, S.K., Huang, J.C., 2003. ORP-based oxygenation for sulfide control in anaerobic
treatment of high-sulfate wastewater. Water Res. 37, 2053–2062. http://dx.doi.org/
10.1016/S0043-1354(02)00618-8.
Kleinjan, W.E., Lammers, J.N.J.J., de Keizer, A., Janssen, A.J.H., 2006. Effect of biolo-
gically produced sulfur on gas absorption in a biotechnological hydrogen sulfide
removal process. Biotechnol. Bioeng. 94, 633–644. http://dx.doi.org/10.1002/bit.
20855.
Kobayashi, T., Li, Y.Y., Kubota, K., Harada, H., Maeda, T., Yu, H.Q., 2012.
Characterization of sulfide-oxidizing microbial mats developed inside a full-scale
anaerobic digester employing biological desulfurization. Appl. Microbiol. Biotechnol.
93, 847–857. http://dx.doi.org/10.1007/s00253-011-3445-6.
Krayzelova, L., Bartacek, J., Díaz, I., Jeison, D., Volcke, E.I.P., Jenicek, P., 2015.
Microaeration for hydrogen sulfide removal during anaerobic treatment: a review.
Rev. Environ. Sci. Biotechnol. 14, 703–725. http://dx.doi.org/10.1007/s11157-015-
9386-2.
Kumar, A., Chilongo, T., Dewulf, J., Ergas, S.J., Van Langenhove, H., 2010. Gaseous di-
methyl sulphide removal in a membrane biofilm reactor: effect of methanol on re-
actor performance. Bioresour. Technol. 101, 8955–8959. http://dx.doi.org/10.1016/
j.biortech.2010.06.081.
Lu, J.G., Zheng, Y.F., He, D.L., 2006. Selective absorption of H2S from gas mixtures into
aqueous solutions of blended amines of methyldiethanolamine and 2-tertiar-
ybutylamino-2-ethoxyethanol in a packed column. Sep. Purif. Technol. 52, 209–217.
http://dx.doi.org/10.1016/j.seppur.2006.04.003.
Ma, Y., Zhao, J., Yang, B.L., 2006. Removal of H2S in waste gases by an activated carbon
bioreactor. Int. Biodeterior. Biodegr. 57, 93–98. http://dx.doi.org/10.1016/j.ibiod.
2005.10.010.
Marzouk, S.A.M., Al-Marzouqi, M.H., Abdullatif, N., Ismail, Z.M., 2010. Removal of
percentile level of H2S from pressurized H2S-CH4 gas mixture using hollow fiber
membrane contactors and absorption solvents. J. Memb. Sci. 360, 436–441. http://
dx.doi.org/10.1016/j.memsci.2010.05.046.
Miltner, M., Makaruk, A., Harasek, M., 2017. Review on available biogas upgrading
technologies and innovations towards advanced solutions. J. Clean. Prod. 161,
1329–1337. http://dx.doi.org/10.1016/j.jclepro.2017.06.045.
Montebello, A.M., Fernández, M., Almenglo, F., Ramírez, M., Cantero, D., Baeza, M.,
Gabriel, D., 2012. Simultaneous methylmercaptan and hydrogen sulfide removal in
the desulfurization of biogas in aerobic and anoxic biotrickling filters. Chem. Eng. J.
200–202, 237–246. http://dx.doi.org/10.1016/j.cej.2012.06.043.
Montoya, J.P., 2010. Membrane Gas Exchange. MedArray Inc, pp. 1–7.
Muñoz, R., Meier, L., Diaz, I., Jeison, D., 2015. A review on the state-of-the-art of phy-
sical/chemical and biological technologies for biogas upgrading. Rev. Environ. Sci.
Bio/Technology 14, 727–759. http://dx.doi.org/10.1007/s11157-015-9379-1.
Panza, D., Belgiorno, V., 2010. Hydrogen sulphide removal from landfill gas. Process Saf.
Environ. Prot. 88, 420–424. http://dx.doi.org/10.1016/j.psep.2010.07.003.
Park, K., Lee, H., Phelan, S., Liyanaarachchi, S., Marleni, N., Navaratna, D., Jegatheesan,
V., Shu, L., 2014. Mitigation strategies of hydrogen sulphide emission in sewer net-
works – a review. Int. Biodeterior. Biodegrad. 95, 251–261. http://dx.doi.org/10.
1016/j.ibiod.2014.02.013.
Petersson, A., Wellinger, A., 2009. Biogas upgrading technologies–developments and
innovations. IEA Bioenergy 20. http://dx.doi.org/10.1016/j.wasman.2011.09.003.
Ramírez, M., Gómez, J.M., Aroca, G., Cantero, D., 2009. Removal of hydrogen sulfide by
immobilized Thiobacillus thioparus in a biotrickling filter packed with polyurethane
foam. Bioresour. Technol. 100, 4989–4995. http://dx.doi.org/10.1016/j.biortech.
2009.05.022.
Ramos, I., Fdz-Polanco, M., 2014. Microaerobic control of biogas sulphide content during
sewage sludge digestion by using biogas production and hydrogen sulphide con-
centration. Chem. Eng. J. 250, 303–311. http://dx.doi.org/10.1016/j.cej.2014.04.
027.
Reddy, K.S., Aravindhan, S., Mallick, T.K., 2016. Investigation of performance and
emission characteristics of a biogas fuelled electric generator integrated with solar
concentrated photovoltaic system. Renew. Energy 92, 233–243. http://dx.doi.org/
10.1016/j.renene.2016.02.008.
Ryckebosch, E., Drouillon, M., Vervaeren, H., 2011. Techniques for transformation of
biogas to biomethane. Biomass Bioenergy 35, 1633–1645. http://dx.doi.org/10.
1016/j.biombioe.2011.02.033.
Sublette, K.L., Robert, P., Hasan, S., 1994. Microbial Oxidation of Hydrogen Sulfide in a
Pilot-scale Bubble Column 4–7.
Syed, M., Soreanu, G., Falletta, P., Beland, M., 2006. Removal of hydrogen sulfide from
gas streams using biological processes - a review. Can. Biosyst. Eng. 48 2.1-2.14.
Tilahun, E., Bayrakdar, A., Sahinkaya, E., Çalli, B., 2017. Performance of poly-
dimethylsiloxane membrane contactor process for selective hydrogen sulfide removal
from biogas. Waste Manag. 1–8. http://dx.doi.org/10.1016/j.wasman.2017.01.011.
Wang, Z., Fang, M., Ma, Q., Yu, H., Wei, C.C., Luo, Z., 2014. Investigation of membrane
wetting in different absorbents at elevated temperature for carbon dioxide capture. J.
Memb. Sci. 455, 219–228. http://dx.doi.org/10.1016/j.memsci.2013.12.057.
Yang, C., Chen, H., Zeng, G., Yu, G., Luo, S., 2010. Biomass accumulation and control
strategies in gas biofiltration. Biotechnol. Adv. 28, 531–540. http://dx.doi.org/10.
1016/j.biotechadv.2010.04.002.
Yurtsever, A., Calimlioglu, B., Sahinkaya, E., 2017. Impact of SRT on the efficiency and
microbial community of sequential anaerobic and aerobic membrane bioreactors for
the treatment of textile industry wastewater. Chem. Eng. J. 314, 378–387. http://dx.
doi.org/10.1016/j.cej.2016.11.156.
E. Tilahun et al. International Biodeterioration & Biodegradation 127 (2018) 69–76
76