Impact of Urbanization on Water Quality and Microbial Communities
1. Assessing the Impact of Urban Intensification on
Water Quality and Dynamics of Microbial Communities
Zimeng Zhang, Felicia Lim and Jing Zhang
Supervisor: Dr. Sekar Raju
Department of Biological Sciences, Xi’an Jiaotong Liverpool University, Suzhou 215123, China
ABSTRACT
The rapidly increasing urbanization in China has
various impacts on freshwater environments
including eutrophication, chemical and
microbial contamination, and loss of
biodiversity. This study aims to assess the water
quality through organic matter breakdown of
leaf litter and changes in microbial community
in Suzhou canals across a gradient of urban
intensification. The study was carried out in
high, medium, and low population density areas
in summer, and the results were compared with
similar analysis done in spring. The results show
that the concentrations of nutrients, breakdown
of leaf litter and microbial abundance varied
among three intensity areas in different
seasons. The microbial community analysis is
still in progress.
INTRODUCTION
Rapid urbanization along the Yangtze River canals
flowing in Suzhou has led to eutrophication and heavy
metal contamination due to various discharges such as
industrial effluent, domestic sewage, and agricultural
runoff. This pollution may cause further contamination
of the groundwater, which could endanger the local
human population through water and soil
contamination.
This project aims to assess the influence of urban
intensification on water quality and diversity-ecosystem
function relationships. Specifically, the leaf litter
breakdown and changes in microbial diversity will be
assessed along with physicochemical changes of water
in relation to increasing urbanization. Nine sampling
sites within three land-use classes (High, Medium and
Low) were selected for this study and replicated in
different seasons.
Step 1
Preparation of leaf bags
Step 2
Field experiment/sampling
CONCLUSIONS0
The urbanization alters the water quality in Suzhou canals as seen in the nutrient analysis, and this
subsequently alters the microbial abundance in the water and the decomposition rate of the leaves.
Elevated nutrient levels were observed in high intensity areas followed by medium and low intensity areas.
The nutrient content and microbial abundance trends also change in climatic patterns, as we obtain slightly
different trends in both summer and spring.
Organic matter breakdown indeed is higher in summer, as seen in lower organic carbon content in water
samples, as well as lower biomass of the leaf samples.
The HTP sequencing (in progress) might provide a better picture of the impact of urban intensification on
microbial communities.
Acknowledgements
We would like to thank
• Dr. Ying Chang (UPD) and Ms. Jing Lu (Library) for help with
selection of sampling locations based on population density data.
• Ms. Wenting Wu and Ms. Yue Wu (Env. Sci.) for help with field work.
• Mr. Kiran Kumar and Ms. Sijing Meng (BIO) for laboratory support.
• Drs. J Tonkin and J Wang for their support with some experiments.
• USTC and NIGLAS for help with AFDM and nutrient analyses.
• Department of Biological Sciences, XJTLU for providing research
facilities.
• XJTLU and Jiangsu University Natural Science Research Programme
for funding.
Leaf samples
• Dry & AFDM measurements
• Microbial community analysis
via HTP sequencing
• Microbial abundance analysis
via qPCR
Water samples
• Physico- chemical analysis
• Microscopic observation
• Microbial community analysis
via HTP sequencing
• Microbial abundance analysis
via qPCR.
Step 3
Measurement and data analysis
1
High
2
Medium
3
Low
MATERIALS AND METHODS
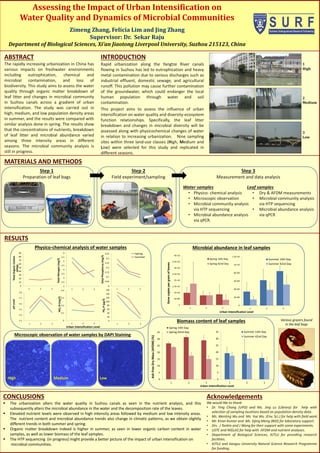
Microscopic observation of water samples by DAPI Staining
High Medium Low
Microbial abundance in leaf samples
Urban Intensification Level
Various grazers found
in the leaf bags
0
5E+09
1E+10
1.5E+10
2E+10
2.5E+10
3E+10
3.5E+10
4E+10
1 2 3
Genecopiespergramofleaves
Spring 14th Day
Spring 42nd Day
0
2E+09
4E+09
6E+09
8E+09
1E+10
1.2E+10
1 2 3
Summer 14th Day
Summer 42nd Day
0
5
10
15
20
25
30
35
1 2 3
AshFreeDryMass(AFDM)(%)
Spring 14th Day
Spring 42nd Day
0
5
10
15
20
25
30
35
1 2 3
Summer 14th Day
Summer 42nd Day
Urban Intensification Level
Biomass content of leaf samples
RESULTS
Physico-chemical analysis of water samples
7.3
7.4
7.5
7.6
7.7
7.8
1 2 3
pHLevel
2
2.5
3
3.5
4
4.5
5
5.5
6
1 2 3
TotalNitrogen(mg/l)
0
0.1
0.2
0.3
0.4
1 2 3
NO2-N(mg/l)
0
20
40
60
80
100
120
140
160
1 2 3
P04-P(μg/l)
0
10
20
30
40
50
60
70
80
90
1 2 3
TotalOrganicCarbon
(PPM)
Urban Intensification Level
0
0.05
0.1
0.15
0.2
0.25
0.3
0.35
1 2 3
TotalPhosphorus(mg/l)
Spring
Summer