1. PVsyst TRIAL
Page 1/513/09/17PVSYST V6.63
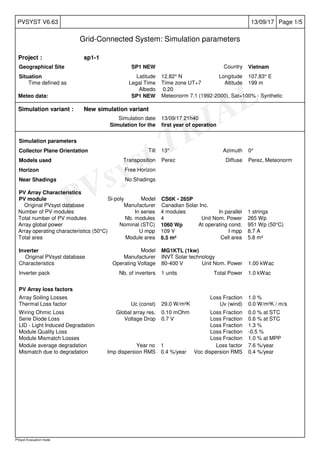
Grid-Connected System: Simulation parameters
PVsyst Evaluation mode
Project : sp1-1
Geographical Site SP1 NEW Country Vietnam
Situation Latitude 12.82° N Longitude 107.83° E
Time defined as Legal Time Time zone UT+7 Altitude 199 m
Albedo 0.20
Meteo data: SP1 NEW Meteonorm 7.1 (1992-2000), Sat=100% - Synthetic
Simulation variant : New simulation variant
Simulation date 13/09/17 21h40
Simulation for the first year of operation
Simulation parameters
Collector Plane Orientation Tilt 13° Azimuth 0°
Models used Transposition Perez Diffuse Perez, Meteonorm
Horizon Free Horizon
Near Shadings No Shadings
PV Array Characteristics
PV module Si-poly Model CS6K - 265P
Manufacturer Canadian Solar Inc.Original PVsyst database
Number of PV modules In series 4 modules In parallel 1 strings
Total number of PV modules Nb. modules 4 Unit Nom. Power 265 Wp
Array global power Nominal (STC) 1060 Wp At operating cond. 951 Wp (50°C)
Array operating characteristics (50°C) U mpp 109 V I mpp 8.7 A
Total area Module area 6.5 m² Cell area 5.8 m²
Inverter Model MG1KTL (1kw)
Manufacturer INVT Solar technologyOriginal PVsyst database
Characteristics Operating Voltage 80-400 V Unit Nom. Power 1.00 kWac
Inverter pack Nb. of inverters 1 units Total Power 1.0 kWac
PV Array loss factors
Array Soiling Losses Loss Fraction 1.0 %
Thermal Loss factor Uc (const) 29.0 W/m²K Uv (wind) 0.0 W/m²K / m/s
Wiring Ohmic Loss Global array res. 0.10 mOhm Loss Fraction 0.0 % at STC
Serie Diode Loss Voltage Drop 0.7 V Loss Fraction 0.6 % at STC
LID - Light Induced Degradation Loss Fraction 1.3 %
Module Quality Loss Loss Fraction -0.5 %
Module Mismatch Losses Loss Fraction 1.0 % at MPP
Module average degradation Year no 1 Loss factor 7.6 %/year
Mismatch due to degradation Imp dispersion RMS 0.4 %/year Voc dispersion RMS 0.4 %/year
2. PVsyst TRIAL
Page 2/513/09/17PVSYST V6.63
Grid-Connected System: Simulation parameters (continued)
PVsyst Evaluation mode
Incidence effect (IAM): User defined IAM profile
10°
0.998
20°
0.998
30°
0.995
40°
0.992
50°
0.986
60°
0.970
70°
0.917
80°
0.763
90°
0.000
System loss factors
AC wire loss inverter to transfo Inverter voltage 220 Vac tri
Wires: 2x30000.0 mm² 40 m Loss Fraction 0.0 % at STC
External transformer Iron loss (24H connexion) 1 W Loss Fraction 0.1 % at STC
Resistive/Inductive losses 471.2 mOhm Loss Fraction 1.0 % at STC
Unavailability of the system 7.3 days, 0 periods Time fraction 2.0 %
User's needs : Unlimited load (grid)
3. PVsyst TRIAL
Page 3/513/09/17PVSYST V6.63
Grid-Connected System: Main results
PVsyst Evaluation mode
Project : sp1-1
Simulation variant : New simulation variant
Simulation for the first year of operation
Main system parameters System type Grid-Connected
PV Field Orientation tilt 13° azimuth 0°
PV modules Model CS6K - 265P Pnom 265 Wp
PV Array Nb. of modules 4 Pnom total 1060 Wp
Inverter Model MG1KTL (1kw) Pnom 1000 W ac
User's needs Unlimited load (grid)
Main simulation results
System Production Produced Energy 1542 kWh/year Specific prod. 1455 kWh/kWp/year
Performance Ratio PR 77.31 %
Jan Feb Mar Apr May Jun Jul Aug Sep Oct Nov Dec
0
1
2
3
4
5
6
7
NormalizedEnergy[kWh/kWp/day]
Normalized productions (per installed kWp): Nominal power 1060 Wp
Yf : Produced useful energy (inverter output) 3.99 kWh/kWp/day
Ls : System Loss (inverter, ...) 0.21 kWh/kWp/day
Lc : Collection Loss (PV-array losses) 0.96 kWh/kWp/day
Jan Feb Mar Apr May Jun Jul Aug Sep Oct Nov Dec
0.0
0.1
0.2
0.3
0.4
0.5
0.6
0.7
0.8
PerformanceRatioPR
Performance Ratio PR
PR : Performance Ratio (Yf / Yr) : 0.773
New simulation variant
Balances and main results
GlobHor DiffHor T Amb GlobInc GlobEff EArray E_Grid PR
kWh/m² kWh/m² °C kWh/m² kWh/m² kWh kWh
January 153.8 61.52 23.48 172.3 167.1 151.0 144.0 0.788
February 159.0 57.27 24.18 172.5 167.5 150.0 142.8 0.781
March 176.8 79.22 25.91 182.2 176.4 157.3 149.5 0.774
April 168.3 80.87 27.55 166.0 160.4 142.5 135.4 0.769
May 176.7 82.28 28.71 167.1 161.0 142.5 135.2 0.763
June 162.5 76.35 28.93 151.3 145.5 129.0 122.4 0.763
July 170.2 80.15 29.24 159.5 153.4 135.8 129.2 0.764
August 157.3 75.18 28.93 152.6 147.1 129.8 123.1 0.761
September 138.7 80.45 27.49 139.7 134.6 120.2 114.0 0.770
October 138.9 82.24 26.64 145.4 140.2 125.8 119.6 0.776
November 121.5 68.05 25.08 132.4 127.8 115.6 109.7 0.781
December 126.3 63.92 24.27 141.1 136.4 123.8 117.5 0.786
Year 1850.0 887.50 26.71 1882.0 1817.4 1623.3 1542.3 0.773
Legends: GlobHor Horizontal global irradiation
DiffHor Horizontal diffuse irradiation
T Amb Ambient Temperature
GlobInc Global incident in coll. plane
GlobEff Effective Global, corr. for IAM and shadings
EArray Effective energy at the output of the array
E_Grid Energy injected into grid
PR Performance Ratio
4. PVsyst TRIAL
Page 4/513/09/17PVSYST V6.63
Grid-Connected System: Loss diagram
PVsyst Evaluation mode
Project : sp1-1
Simulation variant : New simulation variant
Simulation for the first year of operation
Main system parameters System type Grid-Connected
PV Field Orientation tilt 13° azimuth 0°
PV modules Model CS6K - 265P Pnom 265 Wp
PV Array Nb. of modules 4 Pnom total 1060 Wp
Inverter Model MG1KTL (1kw) Pnom 1000 W ac
User's needs Unlimited load (grid)
Loss diagram over the whole year
Horizontal global irradiation1850 kWh/m²
+1.7% Global incident in coll. plane
-2.4% IAM factor on global
-1.0% Soiling loss factor
Effective irradiance on collectors1817 kWh/m² * 7 m² coll.
efficiency at STC = 16.19% PV conversion
Array nominal energy (at STC effic.)1926 kWh
-3.8% Module Degradation Loss ( for year#1)
-0.6% PV loss due to irradiance level
-8.3% PV loss due to temperature
+0.5% Module quality loss
-1.3% LID - Light induced degradation
-2.5% Module array mismatch loss
(including 1.4% for degradation dispersion
-0.7% Ohmic wiring loss
Array virtual energy at MPP1623 kWh
-3.7% Inverter Loss during operation (efficiency)
0.0% Inverter Loss over nominal inv. power
-0.2% Inverter Loss due to power threshold
0.0% Inverter Loss over nominal inv. voltage
0.0% Inverter Loss due to voltage threshold
Available Energy at Inverter Output1559 kWh
0.0% System unavailability
0.0% AC ohmic loss
-1.1% External transfo loss
Energy injected into grid1542 kWh
Tổng tổn thất 21,7%
bức xạ trên tấm pin / 7m2
công suất nhận được
Bảng tổn thất hệ INVERTER 1KW
4 tấm panel 265w góc 13 độ
5. PVsyst TRIAL
Page 5/513/09/17PVSYST V6.63
Grid-Connected System: P50 - P90 evaluation
PVsyst Evaluation mode
Project : sp1-1
Simulation variant : New simulation variant
Simulation for the first year of operation
Main system parameters System type Grid-Connected
PV Field Orientation tilt 13° azimuth 0°
PV modules Model CS6K - 265P Pnom 265 Wp
PV Array Nb. of modules 4 Pnom total 1060 Wp
Inverter Model MG1KTL (1kw) Pnom 1000 W ac
User's needs Unlimited load (grid)
Evaluation of the Production probability forecast
The probability distribution of the system production forecast for different years is mainly dependent
on the meteo data used for the simulation, and depends on the following choices:
Meteo data source Meteonorm 7.1 (1992-2000), Sat=100%
Meteo data Kind Monthly averages Synthetic Multi-year average
Specified Deviation Climate change 0.0 %
Year-to-year variability Variance 2.5 %
The probability distribution variance is also depending on some system parameters uncertainties
Specified Deviation PV module modelling/parameters 2.0 %
Inverter efficiency uncertainty 0.5 %
Soiling and mismatch uncertainties 1.0 %
Degradation uncertainty 1.0 %
Global variability (meteo + system) Variance 3.5 % (quadratic sum)
Annual production probability Variability 55 kWh
P50 1542 kWh
P90 1472 kWh
P95 1453 kWh
1350 1400 1450 1500 1550 1600 1650 1700
E_Grid system production kWh
0.00
0.05
0.10
0.15
0.20
0.25
0.30
0.35
0.40
0.45
0.50
Probability
Probability distribution
P50 = 1542.31 kWh
P90 = 1472.39 kWh
P95 = 1452.72 kWh
E_Grid simul = 1542.31 kWh