Download as PDF, PPTX


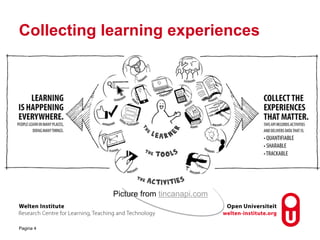


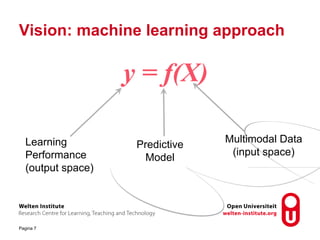


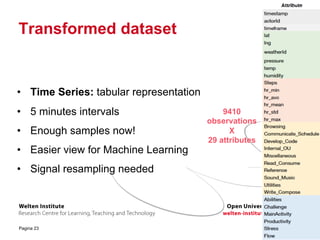


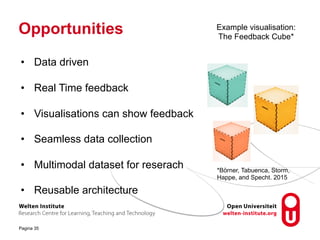

This document presents research on using machine learning to predict student performance in self-regulated learning from multimodal data sources. The researchers collected data from 9 PhD students over 3 weeks using sensors, self-reports, and context data. They developed an architecture to store and analyze the data, addressing challenges in feature extraction, sparsity, and inter-subject variability. Linear mixed models were able to incorporate individual differences but yielded low prediction accuracy. Opportunities exist to provide real-time feedback visualizations to students.


![[Cryptica 22] Deep Learning on Tabular Data, Predicting Profitability - Peiyu...](https://cdn.slidesharecdn.com/ss_thumbnails/peiyuwang-deeplearningontabulardatapredictingprofitability-221129210136-b819c323-thumbnail.jpg?width=640&height=640&fit=bounds)