1. AUM: US$11.7 Billion | March 31, 2013
Event-Driven, Value Investing
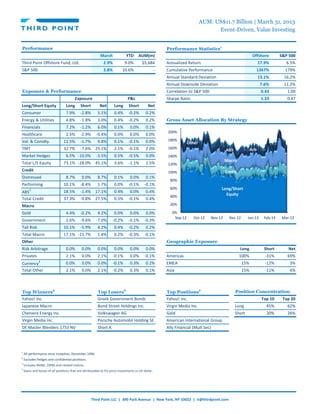
Performance Performance Statistics1
March YTD AUM(m) Offshore S&P 500
Third Point Offshore Fund, Ltd. 2.9% 9.0% $5,684 Annualized Return 17.9% 6.5%
S&P 500 3.8% 10.6% ‐ Cumulative Performance 1367% 179%
Annual Standard Deviation 13.1% 16.2%
Annual Downside Deviation 7.6% 11.2%
Exposure & Performance Correlation to S&P 500 0.43 1.00
Exposure P&L Sharpe Ratio 1.33 0.47
Long/Short Equity Long Short Net Long Short Net
Consumer 7.9% ‐2.8% 5.1% 0.4% ‐0.2% 0.2%
Energy & Utilities 4.8% ‐1.8% 3.0% 0.4% ‐0.2% 0.2% Gross Asset Allocation By Strategy
Financials 7.2% ‐1.2% 6.0% 0.1% 0.0% 0.1%
200%
Healthcare 2.5% ‐2.9% ‐0.4% 0.0% 0.0% 0.0%
Ind. & Comdty. 11.5% ‐1.7% 9.8% 0.1% ‐0.1% 0.0% 180%
Other
TMT 32.7% ‐7.6% 25.1% 2.1% ‐0.1% 2.0% 160% ABS Arb
Market Hedges 6.5% ‐10.0% ‐3.5% 0.5% ‐0.5% 0.0% 140%
Macro
Total L/S Equity 73.1% ‐28.0% 45.1% 3.6% ‐1.1% 2.5% 120%
Credit 100% Credit
Distressed 8.7% 0.0% 8.7% 0.1% 0.0% 0.1%
80%
Performing 10.1% ‐8.4% 1.7% 0.0% ‐0.1% ‐0.1%
60% Long/Short
ABS3 18.5% ‐1.4% 17.1% 0.4% 0.0% 0.4%
Equity
40%
Total Credit 37.3% ‐9.8% 27.5% 0.5% ‐0.1% 0.4%
Macro 20%
Gold 4.4% ‐0.2% 4.2% 0.0% 0.0% 0.0% 0%
Sep‐12 Oct‐12 Nov‐12 Dec‐12 Jan‐13 Feb‐13 Mar‐13
Government 2.6% ‐9.6% ‐7.0% ‐0.2% ‐0.1% ‐0.3%
Tail Risk 10.1% ‐5.9% 4.2% 0.4% ‐0.2% 0.2%
Total Macro 17.1% ‐15.7% 1.4% 0.2% ‐0.3% ‐0.1%
Other Geographic Exposure
Risk Arbitrage 0.0% 0.0% 0.0% 0.0% 0.0% 0.0% Long Short Net
Privates 2.1% 0.0% 2.1% ‐0.1% 0.0% ‐0.1% Americas 100% ‐31% 69%
Currency4 0.0% 0.0% 0.0% ‐0.1% 0.3% 0.2% EMEA 15% ‐12% 3%
Total Other 2.1% 0.0% 2.1% ‐0.2% 0.3% 0.1% Asia 15% ‐11% 4%
Top Winners2 Top Losers2 Top Positions2 Position Concentration
Yahoo! Inc. Greek Government Bonds Yahoo! Inc. Top 10 Top 20
Japanese Macro Bond Street Holdings Inc. Virgin Media Inc. Long 45% 62%
Cheniere Energy Inc. Volkswagen AG Gold Short 20% 26%
Virgin Media Inc. Porsche Automobil Holding SE American International Group
DE Master Blenders 1753 NV Short A Ally Financial (Mult Sec)
1
All performance since inception, December 1996.
2
Excludes hedges and confidential positions.
3
Includes RMBS, CMBS and related indices.
4
Gains and losses of all positions that are attributable to f/x price movements vs US dollar.
Third Point LLC | 390 Park Avenue | New York, NY 10022 | ir@thirdpoint.com
2. March 31, 2013 | Page 2
All information provided herein is for informational purposes only and should not be deemed as a recommendation to buy or sell the securities mentioned. The Third Point Offshore Fund,
Ltd. is a feeder fund in a master feeder structure in which it is limited partner of, and contributes substantially all of its assets to, Third Point Offshore Master Fund L.P. All information
contained herein relates to the TP Offshore Master Fund L.P. unless otherwise specified. P&L and AUM information are presented at the feeder fund level.
The information shown in the section entitled “Historical Performance” and “Comparative Historical Performance” represents that of Third Point Partners L.P., which has been managed by
Third Point, its related persons and/or its predecessors since June 1995. Sector and geographic categories are determined by Third Point in its sole discretion.
All P&L and performance results are based on the net asset value of fee‐paying investors only and are presented net of management fees, brokerage commissions, administrative expenses,
and accrued performance allocation, if any, and include the reinvestment of all dividends, interest, and capital gains. While performance allocations are accrued monthly, they are
deducted from investor balances only annually or upon withdrawal. The performance above represents fund‐level returns, and is not an estimate of any specific investor’s actual
performance, which may be materially different from such performance depending on numerous factors. All performance results are estimates and should not be regarded as final until
audited financial statements are issued.
While the performances of the Funds have been compared here with the performance of well‐known and widely recognized indices, the indices have not been selected to represent an
appropriate benchmark for the Funds whose holdings, performance and volatility may differ significantly from the securities that comprise the indices. The CS and HFRI historical
performance data represent one‐month delayed figures due to reporting lag.
Past performance is not necessarily indicative of future results. All investments involve risk including the loss of principal. This transmission is confidential and may not be redistributed
without the express written consent of Third Point LLC and does not constitute an offer to sell or the solicitation of an offer to purchase any security or investment product. Any such offer
or solicitation may only be made by means of delivery of an approved confidential offering memorandum.
1
Please refer to private placement memorandum for relevant fund terms and fees.
Third Point LLC | 390 Park Avenue | New York, NY 10022 | ir@thirdpoint.com