
Recommended
More Related Content
What's hot
What's hot (20)
Similar to Forestry gis 2021
Similar to Forestry gis 2021 (20)
Recently uploaded
Recently uploaded (20)
Forestry gis 2021
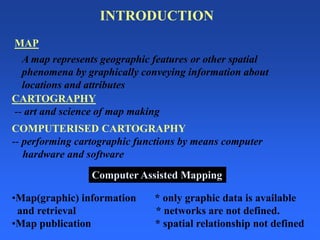
- 1. COMPUTERISED CARTOGRAPHY -- performing cartographic functions by means computer hardware and software CARTOGRAPHY -- art and science of map making A map represents geographic features or other spatial phenomena by graphically conveying information about locations and attributes MAP •Map(graphic) information * only graphic data is available and retrieval * networks are not defined. •Map publication * spatial relationship not defined Computer Assisted Mapping INTRODUCTION
- 2. Graphics are holistic: “a picture says more than a thousand words...” “First road left, then cross the railroad and continue until you cross the river, then the first right and right again on the crossroads...” Introduction Why Use Graphics
- 3. Why GIS? • 70% of the decisions, we make are based on geographical considerations • Ability to assimilate spatial and non- spatial data • Visualisation Impact • Sharing of Information • Analytical Capability in a spatial context
- 4. GIS is a System of computer software, hardware and data, and personnel to help manipulate, analyze and present information that is tied to a spatial location – • spatial location – usually a geographic location • information – visualization of analysis of data • system – linking software, hardware, data • personnel – a thinking explorer who is key to the power of GIS Geographic Information Systems A Definition of GIS
- 8. What is Not GIS ? • GPS – Global Positioning System • A static map – paper or digital – Maps are often a “product” of a GIS – A way to visualize the analysis • A software package
- 9. • GIS handles SPATIAL information – Information referenced by its location in space • GIS makes connections between activities based on spatial proximity 9 Why is GIS unique?
- 10. Components of GIS A working GIS system integrates these five key components: ➢ Hardware ➢ Software ➢ Data ➢ People ➢ Methods
- 11. WHY GIS ? • To inventory and monitor resources • To test the sensitivity of our analysis assumptions • To simulate potential impacts of management alternatives • To make the map the 2nd time, the 50th time, the 100th time...
- 12. • GIS improves efficiency • GIS identifies opportunities • GIS improves decisions by providing needed tools and data How Does GIS Provide Benefit?
- 13. Uses of a GIS • Mapping geographical characteristics for analysis • Modeling alternative processes for management plans • Managing a utility’s assets • Monitoring changes in environmental factors
- 15. Spatial Data • Estimates are that 80% of all data has a spatial component – Data from most sciences can be analyzed “spatially”
- 19. Two Ways to Input and Visualize Data • Raster – Grid – “pixels” – a location and value – Satellite images and aerial photos are already in this format • Vector – Linear – Points, lines & polygons – “Features” (house, lake, etc.) – Attributes – size, type, length, etc. Real world
- 27. • A method to visualize, manipulate, analyze, and display spatial data • “Smart Maps” linking a database to the map
- 28. Data Capture Sources • Digitizing from paper maps • Scanning • Traditional surveying techniques • Paper records & field notes • Photogrammetry • Remote sensing • GPS
- 29. Database “Not Easy to Interpret”
- 30. Visualization “Worth a Thousand Words”
- 34. Combining Data From Many Sources
- 35. States Five Data Layers “Alike” Features Roads Capitals Rivers Lakes
- 36. “Spatial Analysis” – not just a map Turning Data Into Information
- 37. Asking A Question – Interaction
- 38. Maps and Database are “Interactive”
- 39. Multiple Databases can be Linked and Related
- 45. • Emergency Services – Fire & Police • Environmental – Monitoring & Modeling • Business – Site Location, Delivery Systems • Industry – Transportation, Communication, Mining, Pipelines, Healthcare • Government – Local, State, Federal, Military • Education – Research, Teaching Tool, Administration Wherever Spatial Data Analysis is Needed