Interpret the following graphYour answer must include discussion o.pdf
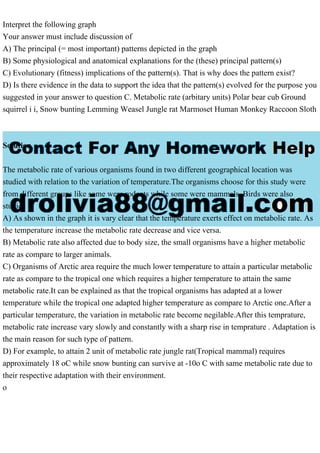
Interpret the following graph Your answer must include discussion of A) The principal (= most important) patterns depicted in the graph B) Some physiological and anatomical explanations for the (these) principal pattern(s) C) Evolutionary (fitness) implications of the pattern(s). That is why does the pattern exist? D) Is there evidence in the data to support the idea that the pattern(s) evolved for the purpose you suggested in your answer to question C. Metabolic rate (arbitary units) Polar bear cub Ground squirrel i i, Snow bunting Lemming Weasel Jungle rat Marmoset Human Monkey Raccoon Sloth Solution The metabolic rate of various organisms found in two different geographical location was studied with relation to the variation of temperature.The organisms choose for this study were from different groups like some were rodents while some were mammals .Birds were also studies A) As shown in the graph it is vary clear that the temperature exerts effect on metabolic rate. As the temperature increase the metabolic rate decrease and vice versa. B) Metabolic rate also affected due to body size, the small organisms have a higher metabolic rate as compare to larger animals. C) Organisms of Arctic area require the much lower temperature to attain a particular metabolic rate as compare to the tropical one which requires a higher temperature to attain the same metabolic rate.It can be explained as that the tropical organisms has adapted at a lower temperature while the tropical one adapted higher temperature as compare to Arctic one.After a particular temperature, the variation in metabolic rate become negilable.After this temprature, metabolic rate increase vary slowly and constantly with a sharp rise in temprature . Adaptation is the main reason for such type of pattern. D) For example, to attain 2 unit of metabolic rate jungle rat(Tropical mammal) requires approximately 18 oC while snow bunting can survive at -10o C with same metabolic rate due to their respective adaptation with their environment. o.
Recommended
Recommended
More Related Content
Similar to Interpret the following graphYour answer must include discussion o.pdf
Similar to Interpret the following graphYour answer must include discussion o.pdf (20)

More from deepaksatrker
More from deepaksatrker (20)
Recently uploaded
Recently uploaded (20)
Interpret the following graphYour answer must include discussion o.pdf
- 1. Interpret the following graph Your answer must include discussion of A) The principal (= most important) patterns depicted in the graph B) Some physiological and anatomical explanations for the (these) principal pattern(s) C) Evolutionary (fitness) implications of the pattern(s). That is why does the pattern exist? D) Is there evidence in the data to support the idea that the pattern(s) evolved for the purpose you suggested in your answer to question C. Metabolic rate (arbitary units) Polar bear cub Ground squirrel i i, Snow bunting Lemming Weasel Jungle rat Marmoset Human Monkey Raccoon Sloth Solution The metabolic rate of various organisms found in two different geographical location was studied with relation to the variation of temperature.The organisms choose for this study were from different groups like some were rodents while some were mammals .Birds were also studies A) As shown in the graph it is vary clear that the temperature exerts effect on metabolic rate. As the temperature increase the metabolic rate decrease and vice versa. B) Metabolic rate also affected due to body size, the small organisms have a higher metabolic rate as compare to larger animals. C) Organisms of Arctic area require the much lower temperature to attain a particular metabolic rate as compare to the tropical one which requires a higher temperature to attain the same metabolic rate.It can be explained as that the tropical organisms has adapted at a lower temperature while the tropical one adapted higher temperature as compare to Arctic one.After a particular temperature, the variation in metabolic rate become negilable.After this temprature, metabolic rate increase vary slowly and constantly with a sharp rise in temprature . Adaptation is the main reason for such type of pattern. D) For example, to attain 2 unit of metabolic rate jungle rat(Tropical mammal) requires approximately 18 oC while snow bunting can survive at -10o C with same metabolic rate due to their respective adaptation with their environment. o