More Related Content
Similar to 1. efecto de los NO hidrocaburos en GN.pdf (20)
1. efecto de los NO hidrocaburos en GN.pdf
- 1. Submit Manuscript | http://medcraveonline.com
Abbreviations: Pc
, critical pressure; Ppr
, pseudo-reduced pres-
sure; Ppc
, pseudo critical pressure; P’pc
, corrected pseudo critical pres-
sure; Tc
, critical temperature; Tpr
, pseudo reduced temperature; Tpc
,
pseudo-critical temperature; T’pc
, corrected pseudo critical tempera-
ture; Ɛ, pseudo-critical temperature adjustment factor; CO2
, carbon
dioxide; SK, standing and Katz; DK, dranchuk- abou- kassem; SBV,
stewart-burkhardt-voo
Introduction
Gas compressibility factor is involved in calculating gas properties
such as formation volume factor, density, compressibility and
viscosity. All these properties are necessary in the oil and gas industry
for evaluating newly discovered gas reservoirs, calculating initial gas
reserves, predicting future gas production and designing production
tubing and pipelines. The accurate measurement of natural gas related
fluids is difficult. The compressibility factor is a ubiquitous concept
in measurement. It arises in many industry practices and standard.
The industry standard is to measure gas properties, pressure-volume-
temperature in the laboratory using reservoir samples. The drawback
is that these isothermally measured PVT data is applicable at measures
pressure and reservoir temperature. Calculation Methods such as
correlations and equation of state are used to predict properties at
other pressure and temperature. Also, laboratory analyses for PVT
behavior are sometimes expensive and time consuming. Correlations,
which are used to predict gas compressibility factor, are much easier
and faster than equation of state. Natural gases frequently contain
material other than hydrocarbon components, such as nitrogen,
carbon dioxide and hydrogen sulfide. Hydrocarbon gases are
classified as sweet or sour depending on the hydrogen sulfide content.
Both sweet and sour gases may contain nitrogen, carbon dioxide or
both. Sometimes these correlations have comparable accuracy to
equation of state. Predicting compressibility factor for gas containing
non-hydrocarbon (impurities) is much difficult than that for sweet
gas. The compositions of most natural gases are hydrocarbon of
the same family (paraffin hydrocarbons), so the correlation of this
type is possible but containing non-hydrocarbon on the gases,
make the prediction difficult. Therefore, several attempts have been
made to predict compressibility factor for sweet gases, Wichert and
Aziz and Carr-Kobayashi-Burrows presented correction for the
presences of hydrogen sulfide and carbon dioxide for determining the
compressibility factor. The objective of this study is evaluating the
pervious correlations which calculate gas compressibility factor for
gases contain non-hydrocarbon component and observe the effect of
these component on Z factor.1–5,8
Correlation
The most common method is to use one of the forms of the principle
of corresponding states. In this form, gas compressibility factor is
expressed as function of pseudo-reduced pressure and temperature
(Ppr
, Tpr
). Compressibility factors are function of composition as well
as temperature and pressure. Standing and Katz (SK) presented a
chart for determining gas compressibility factor based on the principle
of corresponding states. The SK chart was prepared for binary
mixture of low molecular weight sweet gases. Several mathematical
expressions fitting the SK chart have been proposed to calculate
the gas compressibility factor. Dranchuk- Abou- Kassem (DK)
correlation is the most accurate representation of SK chart. When
dealing with gas mixture, the gas mixture is critical pressure (Ppc
) and
J Appl Biotechnol Bioeng. 2017;2(4):124‒134. 124
© 2017 Hamada. This is an open access article distributed under the terms of the Creative Commons Attribution License, which
permits unrestricted use, distribution, and build upon your work non-commercially.
Effect of non-hydrocarbon components on gas
compressibility factor values and correlations
Volume 2 Issue 4 - 2017
Hamada GM
Petroleum Engineering Department, Universiti Technologi
Petronas, Malaysia
Correspondence: GM Hamada, Petroleum Engineering
Department, Faculty of Geosciences and Petroleum Engineering,
Universiti Technologi Petronas, Malaysia,
Email ghareb.mostafa@utp.edu.my
Received: October 24, 2016 | Published: March 06, 2017
Abstract
Gas compressibility factor is necessary in most natural gas engineering calculations.
The most common sources of z-factor values are experimental measurements,
equation of state and empirical correlations. There are more than twenty correlations
available with two variables for calculating the z-factor from fitting Standing-Katz
chart values in EOS or through fitting technique. The theory of corresponding states
dictates that the Z-factor can be uniquely defined as function of reduced pressure
and temperature. Natural gases frequently contain material other than hydrocarbon
components, such as nitrogen, carbon dioxide and hydrogen sulfide. Hydrocarbon
gases are classified as sweet or sour depending on the hydrogen sulfide content. Both
sweet and sour gases may contain nitrogen, carbon dioxide or both. The compositions
of most natural gases are hydrocarbon of the same family (paraffin hydrocarbons),
so the correlation of this type is possible but containing non-hydrocarbon on the
gases, make the prediction difficult. This paper focuses on evaluating the correlations
which calculate gas compressibility factor for natural gas reservoirs contains non-
hydrocarbon components. It is found that gas pseudo-critical temperature decreases
with the increase of N2
and H2
S. Also, it is observed that in the tested gas reservoirs
which contain C7+
by Stewart Mixing Rules and Kay’s there are some deviation on z
factor between two methods that became negligible by using the correction method
for non-hydrocarbon.
Keywords: mole fraction (H2
S+CO2
), mole fraction of H2
S, temperature, pressure,
impurities
Journal of Applied Biotechnology & Bioengineering
Review Article Open Access
- 2. Effect of non-hydrocarbon components on gas compressibility factor values and correlations 125
Copyright:
©2017 Hamada
Citation: Hamada GM. Effect of non-hydrocarbon components on gas compressibility factor values and correlations. J Appl Biotechnol Bioeng.
2017;2(4):124‒134. DOI: 10.15406/jabb.2017.02.00036
temperature (Tpc
) are required. Critical properties of natural gas are
calculated from either gas composition or gas gravity. Several Mixing
rules have been proposed to calculate mixture critical properties of
natural gases. Among these methods, Kay’s mixing rule and stewart-
Burkhardt-Voo (SBV) are the most widely used. Kay’s mixing rule is
simple and provides an accurate determination of gas compressibility
factor for sweet gases of low molecular weight. Satter and Campbell
evaluated several mixing rules for calculating properties of natural
gases.6-8
They concluded that Stewart-Burkhardt-Voo rule known as
SBV provided the most satisfactory results especially for gases of
high molecular weight. Sutton studied the performance of several
mixing rule for calculating compressibility factor for gas condensates
that contain a large amount of heptanes plus fraction. Sutton modified
SBV mixing rule to account for the presence of heptanes plus in
the natural gases. Standard laboratory analysis gives composition
of natural gases through hexane and lump components heavier than
hexane in heptane plus fraction known as C7+
critical properties of
pure components are well documents as shown Table 1. The critical
properties of the C7+
, fraction are calculated from correlations using
molecular weight and specific gravity of the heptanes plus. Standing
presented correlation of pseudo critical properties to gas gravity based
on low molecular weight which are:
2
706 51.7 11.1
P
pc g g
γ γ
= − −
(1)
187 330 71.5
T
pc g g
γ γ
= + −
(2)
Thepreviouscorrelationworkonlywhentherenonon-hydrocarbon
gases present on the gases. Sutton developed the following correlation
work with high molecular weight of gases.
2
756.8 131.0 3.6
P
pc g g
γ γ
= − −
(3)
2
169.2 349.5 74.0
T
pc g g
γ γ
= + −
(4)
The gases which Suttton used to develop previous correlation
were sweet gases with minor amount of carbon dioxide and nitrogen
and no hydrogen sulfide. Then, Elsharkawy et al.1
developed Sutton
correlation but will cover heavier hydrocarbons and minor of
hydrogen sulfide.
2
787.06 147.34 7.916
P
pc g g
γ γ
= − −
(6)
2
149.18 345.14 66.976
T
pc g g
γ γ
= + −
(7)
Methods of Calculating the Pseudo-critical Gas Pro-
perties
The pseudo-critical properties provide a mean to correlate the
physical properties of mixtures with principle of the corresponding
states. The principle of corresponding states suggests that pure but
similar gases have the same gas deviation or Z factor at the same
values of reduced pressure and temperature.The mixture of chemically
similar gases can be correlated with reduced temperature and reduced
pressure.9,10
There are several methods which are:
a. Mixing Rules developed by Stewart et al and Kay’s requires the
gas composition to be known.
b. Estimating pseudo-critical properties when the gas composition
is not known, developed by Sutton.
The theory corresponding states dictates that the Z-factor can be
uniquely defined as function of reduced pressure and temperature.
The reduce pressure and temperatures are:
P
T
pr Ppc
T
P
pr Tpc
=
= (7)
The values of pseudo-critical pressure and temperature can be
estimated from the following equations if the composition of the gas
and the critical properties of the individual component are known
(kay):
1
1
n
T P y
ci i
pc
i
n
P T y
ci
pc i
i
∑
=
=
∑
=
=
(8)
Procedures for Stewart Mixing Rules
i. Estimate the boiling temperature of the C7+
fraction.
0.15178 0.15427 3
(4.5579 )
7 7 7
T M
bc C C
γ
=
+ + + (9)
ii. Estimate the pseudo-critical pressure of the C7+
fraction.
(10)
0.0566 2.2898 0.11857 7
8.3634 0.24244
2 1000
7 7
7
exp
7 3
2
3.648 0.47227 1.6977
7 7
1.4685 0.42019
2 7 2 10
7 10 10
7 7
TbC
C c
C
P
pcC
T
TbC bC
C c C
γ γ γ
γ γ γ
+
− − + + +
+ +
+
=
+
+ +
+ + − +
+
+
+
- 3. Effect of non-hydrocarbon components on gas compressibility factor values and correlations 126
Copyright:
©2017 Hamada
Citation: Hamada GM. Effect of non-hydrocarbon components on gas compressibility factor values and correlations. J Appl Biotechnol Bioeng.
2017;2(4):124‒134. DOI: 10.15406/jabb.2017.02.00036
iii. Estimate the pseudo-critical temperature of the C7+
fraction.
( )
5
10
341.7 811 (0.4244 0.1174 ) (0.4669 3.2623 )
7
7 7 7 7 7
T T
C
pcC C bC C TbC
γ γ γ
= + + + + −
+
+ + + + +
(11)
iv. Determine the correction factor Fj,ξj and ξk for high- molecular
weight component using Sutton’s method.
2
1 2
3 3
7 7
yT y T
c c
F
j P P
c c
C C
= +
+ +
(12)
2 2
0.6081 1.1325 14.004 64.434
7 7
F F F y F y
j j j j C j C
ξ = + − +
+ +
(13)
( )
2 3
0.3129 4.8156 27.3751
7 7 7
7
Tc y y y
C C C
K Pc C
ξ
= − +
+ + +
+
(12)
v. Obtain the critical pressure and temperature of the remaining
component from Table 1.
vi. Determine the pseudo-critical pressure and temperature of the gas
vii. Calculate the parameters J and K
2
1 2
3 3
1 1
nc nc
yT T
c c
J y
P P
c c
i i
i i
∑
= +
∑
=
=
and
1
nc yTc
K
P
i c i
∑
=
=
(13)
viii. Correct the parameters J and K for the C7+
fraction.
'
'
J J
j
K K
K
ξ
ξ
= −
= −
(14)
ix. Calculate the pseudo-critical temperature and pressure
2'
'
'
K
T
pc J
Tpc
P
pc J
=
=
(15)
x. Calculated the Pseudo-reduced pressure and temperature by
using equation7
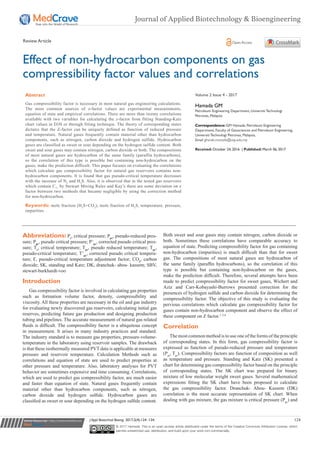
xi. Finding z factor from Standing & Katz compressibility factors
Figure 1.
Table 1 Physical properties of defined component
Component
Molecular
weight
Critical
pressure
(Psia)
Critical
temperature(Ro
)
H2
S 34.08 1300 672.45
CO2
44.01 1071 547.45
N2
28.01 493 227.27
C1
16.04 667.8 343.04
C2
30.07 707.8 549.76
C3
44.01 616.3 665.68
i-C4
58.12 529.1 734.65
n-C4
58.12 550.7 765.32
i-C5
72.15 490.4 828.77
n-C5
72.15 488.6 845.37
C6
86.18 436.9 913.37
Figure 1 Standing and Katz compressibility factors chart.3
Procedures for Sutton’s correlations of sweet gas
I. Estimate the gas gravity of the mixture
II. Calculate the pseudo-critical pressure and temperature for the
hydrocarbon component by using the following equation:
- 4. Effect of non-hydrocarbon components on gas compressibility factor values and correlations 127
Copyright:
©2017 Hamada
Citation: Hamada GM. Effect of non-hydrocarbon components on gas compressibility factor values and correlations. J Appl Biotechnol Bioeng.
2017;2(4):124‒134. DOI: 10.15406/jabb.2017.02.00036
2
756.8 131.0 3.6
2
169.2 349.5 74.0
P
pch h h
T
pch h h
γ γ
γ γ
= − −
= + −
(16)
III. Ignore the nitrogen contamination, then
P P
pc pch
T T
pc pch
=
=
(17)
IV. Calculated the Pseudo-reduced pressure and temperature from
equation 7.
V. Finding z factor from Standing & Katz compressibility factors
chart.
Procedures for Sutton’s correlations of Sour gas
a) Determine the gravity of the hydrocarbon components of the
Mixture
1.1767 1.5196 0.9672 0.6220
2 2 2 2
1 2 2 2 2
y y y y
w H S co N H O
h y y y y
H S Co N H O
γ
γ
− − − −
=
− − − −
(18)
b) Calculate the pseudo-critical pressure and temperature for the
hydrocarbon component by using the following equations.
2
756.8 131.0 3.6
2
169.2 349.5 74.0
P
pch h h
T
pch h h
γ γ
γ γ
= − −
= + −
(19)
c) Calculate the Pesudo-critical properties of the total mixture.
(1 ) 1,306
2 2 2 2 2
1,071 493.1 3200.1
2 2 20
(1 ) 672.35
2 2 2 2 2
547.58 227.16 1164.9
2 2 20
P y y y y P y
pc H S CO N H O pch H S
y y y
CO N H
T y y y y T y
pc H S CO N H O pch H S
y y y
CO N H
=− − − − +
+ + +
=
− − − − +
+ + +
(20)
Methods of correction the pseudo-critical gas proper-
ties for H2
S and CO2
contamination.
Natural gases, which contain H2
S and CO2
frequently, exhibit
different compressibility factor behavior than do sweet gases. Wichert
and Aziz developed a simple, easy to use calculation procedure to
account for these differences.
Wichert-Aziz correction method
This method permits the use of the standing-Katz chart, by using
a pseudo-critical temperature adjustment factor, which is function
of the concentration of CO2
and H2
S in the sour gas. The following
Wichert and Aziz correlation is also can obtain from Figure 2:
( ) ( )
0.9 1.6 0.5 4
120 15
A A B B
ξ
= − + −
(20)
Where the pseudo-critical temperature, T’pc
and pressure P’pc
,
adjusted for CO2
and H2
S contamination are :
'
'
'
(1 )
T T
pc pc
T P
pc pc
P
pc T B B
pc
ξ
ξ
= −
=
+ −
(21)
Where,
A: Sum of the mole fractions of H2
S and CO2
in the gas mixture
B: Mole fraction of H2
S in the gas mixture.
Figure 2 Show the pseudo-critical property correction for H2
S and CO2
.3
Methods of correction the pseudo-critical gas proper-
ties for N2
and H2
O vapor contamination
Carr-Kobayashi and Burrows developed a simple procedure to
adjust the pseudo-critical properties of natural gases when non-
hydrocarbon components are present.
Carr-Kobayashi and burrows correction method
The procedures to obtain the correction are following:
A. Known the specific gravity of the natural gas, calculate the
pseudo-critical temperature and pressure from Figure 3 or by the
following equation:
- 5. Effect of non-hydrocarbon components on gas compressibility factor values and correlations 128
Copyright:
©2017 Hamada
Citation: Hamada GM. Effect of non-hydrocarbon components on gas compressibility factor values and correlations. J Appl Biotechnol Bioeng.
2017;2(4):124‒134. DOI: 10.15406/jabb.2017.02.00036
2
168 325 12.5
2
677 15 37.5
T
pc g g
P
pc g g
γ γ
γ γ
= + −
= + −
(22)
B. Calculate the corrections for nitrogen and water vapor.
246.1 400
, 2 2
162.0 1270
, 2 2
T y y
pc cor N H O
P y y
pc cor N H O
=
− +
=
− +
(23)
C. Calculate the pseudo-critical temperature and pressure for
nitrogen and water vapor.
( )
( )
' (227.2) (1,165)
2 2
''
,
1 2 2
' (493.1) (3,200)
2 2
''
,
1 2 2
T y y
pc N H O
T T
pc pc cor
y y
N H O
P y y
pc N H O
P P
pc pc cor
y y
N H O
− −
+
− −
− −
+
− −
(24)
Where, T’Pc
and P’pc
are the pseudo-critical temperature and pres-
sure corrected for H2
S and CO2
with wichert and Aziz correlation.
If there is no H2
S or CO2
in the gas mixture, then ’
T T
p pc
= and
’
P P
pc pc
=
Figure 3 Show the pseudo-critical property of natural gases.3
Results and discussion
The data are analyzed and Stewart method and Kay’s mixing rules
for predicting pseudo-reduce pressure and temperatures are used for
these data with knowing composition. Moreover, according to present
of non-hydrocarbon on the data I used the correction methods which
are Wichert- Aziz and Carr-Kobayashi and Burrows. The data of three
reservoirs (A,B,C) with water vapor, carbon dioxide and hydrogen
sulfide but with light molecular weight while ,the others (D,E,F) have
C7+
and without water vapor are shown in Table 2, so I used Stewart
Mixing Rules and Kays, The calculation and result for six reservoir
are appear in Tables 3‒14. From calculation, it is found that gas
pseudo-critical temperature decrease with increase of N2
as shown in
Figure 4. Moreover, pseudo-critical temperature with increasing H2
S
is decreases with limitation as shown in Figure 5 then slightly increase
with increase temperature maybe it related to the behavior of H2
S
in reservoir. In addition, gas pseudo-critical pressure increase with
increase N2
and H2
S as shown in Figure 5 & 8. Also, it is observed
that in the tested gas reservoirs which contain C7+
by Stewart Mixing
Rules and Kay’s there are some deviation on z factor between two
methods that became negligible by using the correction method for
non-hydrocarbon as shown in Figure 8 and Table 10 & 14. It is obvious
from the error of Z factor calculated by Stewart for reservoirs D, E and
F (Table 10) is lower than Z error for reservoirs A, B and C (Table 6)
with Kay’s technique, therefore it is recommended to adopt Stewart
Mixing Rules to solve the problem on non-hydrocarbon impurities in
natural gas behavior and more specifically Z factor
Figure 4 Show the mole percent of nitrogen verses pseudo-critical
temperature.
Figure 5 Show the mole percent of H2
S verses pseudo-critical temperature.
- 6. Effect of non-hydrocarbon components on gas compressibility factor values and correlations 129
Copyright:
©2017 Hamada
Citation: Hamada GM. Effect of non-hydrocarbon components on gas compressibility factor values and correlations. J Appl Biotechnol Bioeng.
2017;2(4):124‒134. DOI: 10.15406/jabb.2017.02.00036
Table 2 Six different reservoir in Abu-Dhabi
A B C D E F
Pressure(psia) 6000 5200 5000 4010 2640 2748
Temperature (Ro
) 673.8 657.6 657.6 711.6 672 690
C1
59.59 69.14 71.32 57.95 61.83 40
C2
0.02 2.27 0.1 12.59 7.7 11.93
C3
0.01 1.96 0 7.94 7.63 14
i-C4
0 0.46 0 1.13 1.73 4.7
n-C4
0 1.46 0 3.16 4.38 7.37
i-C5
0 0 0 1.42 2.38 2.38
n-C5
0 0 0 2.01 2.6 5.6
C6
0 0 0 2.18 4.34 7.54
C7+
0 0 0 4.54 6.87 5.93
CO2
12.59 7.9 9.05 3.9 0.3 0.34
N2
11.95 0.1 6.35 0.2 0.24 0.21
H2
S 12.09 13.03 9.44 2.98 0 0
H2
O 3.75 3.68 3.74 0 0 0
Table 3 Reservoir A using Kay’s rule at P=6000psi and T=673.8Ro
Component Yi
Mi
Yi
Mi
Tci
Yi
Tci
Pci
Yi
Pci
CO2
0.1259 44 5.5396 547.6 68.94284 1071 134.8389
N2
0.1198 28 3.3544 239.3 28.66814 507.5 60.7985
H2
S 0.1209 34 4.1106 672.35 81.28712 1306 157.8954
H2
0 0.0375 18 0.675 1164.85 43.68188 3200.1 120.0038
C1
0.5956 16 9.5296 343 204.2908 666.4 396.9078
C2
0.0002 30 0.006 549.6 0.10992 706.5 0.1413
C3
0.0001 45 0.0045 665.7 0.06657 616 0.0616
i-C4
0 58 0 734.1 0 527.9 0
n-C4
0 58 0 765.3 0 550.6 0
Total 1 23.2197 427.0473 870.6473
Table 4 Reservoir B using Kay’s rule at P=5200psi and T=657.6Ro
Component Yi
Mi
Yi
Mi
Tci
Yi
Tci
Pci
Yi
Pci
CO2
0.079 44 3.476 547.6 43.2604 1071 84.609
N2
0.001 28 0.028 239.3 0.2393 507.5 0.5075
H2
S 0.1303 34 4.4302 672.35 87.60721 1306 170.1718
H2
0 0.0368 18 0.6624 1164.85 42.86648 3200.1 117.7637
C1
0.6914 16 11.0624 343 237.1502 666.4 460.749
C2
0.0227 30 0.681 549.6 12.47592 706.5 16.03755
C3
0.0196 45 0.882 665.7 13.04772 616 12.0736
i-C4
0.0046 58 0.2668 734.1 3.37686 527.9 2.42834
n-C4
0.0146 58 0.8468 765.3 11.17338 550.6 8.03876
Total 1 22.3356 451.1975 872.3792
- 7. Effect of non-hydrocarbon components on gas compressibility factor values and correlations 130
Copyright:
©2017 Hamada
Citation: Hamada GM. Effect of non-hydrocarbon components on gas compressibility factor values and correlations. J Appl Biotechnol Bioeng.
2017;2(4):124‒134. DOI: 10.15406/jabb.2017.02.00036
Table 5 Reservoir C using Kay’s rule at P=5000psi and T=657.6Ro
Component Yi
Mi
Yi
Mi
Tci
Yi
Tci
Pci
Yi
Pci
CO2
0.0905 44 3.982 547.6 49.5578 1071 96.9255
N2
0.0635 28 1.778 239.3 15.19555 507.5 32.22625
H2
S 0.0944 34 3.2096 672.35 63.46984 1306 123.2864
H2
0 0.0374 18 0.6732 1164.85 43.56539 3200.1 119.6837
C1
0.7132 16 11.4112 343 244.6276 666.4 475.2765
C2
0.001 30 0.03 549.6 0.5496 706.5 0.7065
C3
0 45 0 665.7 0 616 0
i-C4
0 58 0 734.1 0 527.9 0
C5
0 72 0 828.77 0 490.4 0
Total 1 21.084 416.9658 848.1049
Table 6 Properties and compressibility factor for the three reservoirs
A B C
PPc
870.647 872.379 848.105
TPc
427.047 451.197 416.966
PPr
6.891 5.961 5.895
TPr
1.578 1.457 1.577
Z 0.928 0.848 0.872
Tpc
' 400.563 426.246 394.149
Ppc
' 811.305 819.004 797.964
Tp
'' 376.709 412.673 373.208
PP
'' 778.462 774.854 756.788
Tr
1.789 1.594 1.762
Pr
7.708 6.711 6.607
z 1.004 0.92 0.946
(Z- Error) 0.0089 0.0065 0.0178
Table 7 Reservoir D using Stewart mixing rules
Component Yi
Mi
yi
Mi Tci
(◦R) Pci
(psia) yi
Tci
/Pci
yi
√Tci
/Pci
yi
Tci
/√Pci
N2
0.002 28.01 0.06 227.16 493.1 0 0 0.02
CH4
0.5795 16.04 9.3 343 666.4 0.3 0.42 7.7
C2
H6
0.1259 30.07 3.79 549.59 706.5 0.1 0.11 2.6
C3
H8
0.0794 44.1 3.5 665.73 616 0.09 0.08 2.13
i-C4
H10
0.0113 58.12 0.66 734.13 527.9 0.02 0.01 0.36
n-C4
H10
0.0316 58.12 1.84 765.29 550.6 0.04 0.04 1.03
i-C5
H12
0.0142 72.15 1.02 828.77 490.4 0.02 0.02 0.53
n-C5
H12
0.0201 72.15 1.45 845.47 488.6 0.03 0.03 0.77
C6
H14
0.0218 86.18 1.88 913.27 436.9 0.05 0.03 0.95
C7+
0.0454 114.23 5.19 1005.3 375.5 0.12 0.07 2.36
CO2
0.039 44.01 1.72 547.45 1071 0.02 0.03 0.65
H2
S 0.0298 34 1.01 672.35 1306 0.02 0.02 0.55
∑ 1 30.39 0.8 0.86 19.66
- 8. Effect of non-hydrocarbon components on gas compressibility factor values and correlations 131
Copyright:
©2017 Hamada
Citation: Hamada GM. Effect of non-hydrocarbon components on gas compressibility factor values and correlations. J Appl Biotechnol Bioeng.
2017;2(4):124‒134. DOI: 10.15406/jabb.2017.02.00036
Table 8 Reservoir E using Stewart mixing rules
Component Yi
Mi
yi
Mi Tci
(◦R) Pci
(psia) yi
Tci
/Pci
yi
√Tci
/Pci
yi
Tci
/√Pci
N2
0.0024 28.01 0.07 227.16 493.1 0 0 0.02
CH4
0.6183 16.04 9.92 343 666.4 0.32 0.44 8.22
C2
H6
0.077 30.07 2.32 549.59 706.5 0.06 0.07 1.59
C3
H8
0.0763 44.1 3.36 665.73 616 0.08 0.08 2.05
i-C4
H10
0.0173 58.12 1.01 734.13 527.9 0.02 0.02 0.55
n-C4
H10
0.0438 58.12 2.55 765.29 550.6 0.06 0.05 1.43
i-C5
H12
0.0238 72.15 1.72 828.77 490.4 0.04 0.03 0.89
n-C5
H12
0.026 72.15 1.88 845.47 488.6 0.04 0.03 0.99
C6
H14
0.0434 86.18 3.74 913.27 436.9 0.09 0.06 1.9
C7+
0.0687 114.23 7.85 1005.3 375.5 0.18 0.11 3.56
CO2
0.003 44.01 0.13 547.45 1071 0 0 0.05
∑ 1 34.4 0.91 0.91 21.26
Table 9 Reservoir F using Stewart mixing rule
Component Yi
Mi
yi
Mi Tci
(◦R) Pci
(psia) yi
Tci
/Pci
yi
√Tci
/Pci
yi
Tci
/√Pci
N2
0 28.01 0.06 227.16 493.1 0 0 0.02
CH4
0.4 16.04 6.42 343 666.4 0.21 0.29 5.31
C2
H6
0.12 30.07 3.59 549.59 706.5 0.09 0.11 2.47
C3
H8
0.14 44.1 6.17 665.73 616 0.15 0.15 3.76
i-C4
H10
0.05 58.12 2.73 734.13 527.9 0.07 0.06 1.5
n-C4H10
0.07 58.12 4.28 765.29 550.6 0.1 0.09 2.4
i-C5
H12
0.02 72.15 1.72 828.77 490.4 0.04 0.03 0.89
n-C5
H12
0.06 72.15 4.04 845.47 488.6 0.1 0.07 2.14
C6
H14
0.08 86.18 6.5 913.27 436.9 0.16 0.11 3.29
C7+
0.06 114.23 6.77 1005.3 375.5 0.16 0.1 3.08
CO2
0 44.01 0.15 547.45 1071 0 0 0.06
∑ 1 42.43 1.07 0.99 24.92
Table 10 Properties and compressibility factor for the three reservoirs
D E F
Fj 0.044 0.07 0.059
Ej 0.007 0.002 0.004
Ek 0.355 0.397 0.38
J 0.762 0.851 1.017
K 19.66 21.256 24.924
J' 0.756 0.849 1.013
K' 19.305 20.859 24.544
Tpc
493.256 512.496 594.9
Ppc
652.851 603.662 587.495
Tpc
' 481.534 511.864 594.193
Ppc
' 636.898 602.917 586.797
Tp
'' 493.263 511.958 594.448
- 9. Effect of non-hydrocarbon components on gas compressibility factor values and correlations 132
Copyright:
©2017 Hamada
Citation: Hamada GM. Effect of non-hydrocarbon components on gas compressibility factor values and correlations. J Appl Biotechnol Bioeng.
2017;2(4):124‒134. DOI: 10.15406/jabb.2017.02.00036
D E F
PP
'' 653.206 602.792 586.654
Tr
1.478 1.313 1.161
Pr
6.296 4.379 4.684
Z 0.874 0.69 0.666
Z-Error % 0.0023 0.0056 0.0102
Table 11 Reservoir D using Kay’s mixing rules
Component yi
Mi Tci
(◦R) Pci
(psia) yi
Tci
yi
Pci
N2
0.002 28 227.2 493.1 0.5 1
CH4
0.58 16 343 666.4 198.8 386.2
C2
H6
0.126 30.1 549.6 706.5 69.2 88.9
C3
H8
0.079 44.1 665.7 616 52.9 48.9
i-C4
H10
0.011 58.1 734.1 527.9 8.3 6
n-C4
H10
0.032 58.1 765.3 550.6 24.2 17.4
i-C5
H12
0.014 72.2 828.8 490.4 11.8 7
n-C5
H12
0.02 72.2 845.5 488.6 17 9.8
C6
H14
0.022 86.2 913.3 436.9 19.9 9.5
C7+
0.045 114.2 1005.3 375.5 45.6 17
CO2
0.039 44 547.5 1071 21.4 41.8
H2
S 0.03 34 672.4 1306 20 38.9
∑ 1 8097.5 7728.9 489.5 672.4
Table 12 Reservoir E using Kay’s mixing rules
Component yi
Mi Tci
(◦R) Pci
(psia) yi
Tci
yi
Pci
N2
0.0024 28 227.2 493.1 0.5 1.2
CH4
0.6183 16 343 666.4 212.1 412
C2
H6
0.077 30.1 549.6 706.5 42.3 54.4
C3
H8
0.0763 44.1 665.7 616 50.8 47
i-C4
H10
0.0173 58.1 734.1 527.9 12.7 9.1
n-C4
H10
0.0438 58.1 765.3 550.6 33.5 24.1
i-C5
H12
0.0238 72.2 828.8 490.4 19.7 11.7
n-C5
H12
0.026 72.2 845.5 488.6 22 12.7
C6
H14
0.0434 86.2 913.3 436.9 39.6 19
C7+
0.0687 114.2 1005.3 375.5 69.1 25.8
CO2
0.003 44 547.5 1071 1.6 3.2
∑ 1 7425.2 6422.9 504 620.2
Table 13 Reservoir F using Kay’s mixing rules
Component yi
Mi Tci
(◦R) Pci
(psia) yi
Tci
yi
Pci
N2
0.0021 28 227.2 493.1 0.5 1
CH4
0.4 16 343 666.4 137.2 266.6
C2
H6
0.1193 30.1 549.6 706.5 65.6 84.3
C3
H8
0.14 44.1 665.7 616 93.2 86.2
i-C4
H10
0.047 58.1 734.1 527.9 34.5 24.8
Table Continued..
- 10. Effect of non-hydrocarbon components on gas compressibility factor values and correlations 133
Copyright:
©2017 Hamada
Citation: Hamada GM. Effect of non-hydrocarbon components on gas compressibility factor values and correlations. J Appl Biotechnol Bioeng.
2017;2(4):124‒134. DOI: 10.15406/jabb.2017.02.00036
Component yi
Mi Tci
(◦R) Pci
(psia) yi
Tci
yi
Pci
n-C4
H10
0.0737 58.1 765.3 550.6 56.4 40.6
i-C5H12
0.0238 72.2 828.8 490.4 19.7 11.7
n-C5
H12
0.056 72.2 845.5 488.6 47.3 27.4
C6
H14
0.0754 86.2 913.3 436.9 68.9 32.9
C7+
0.0593 114.2 1005.3 375.5 59.6 22.3
CO2
0.0034 44 547.5 1071 1.9 3.6
∑ 1 6877.7 5351.9 584.8 601.4
Table Continued..
Table 14 Properties and compressibility factor for the three reservoirs
D E F
Tpc
489.453 504.005 584.759
Ppc
672.432 620.215 601.395
Tpc
' 477.731 503.373 584.052
Ppc
' 655.874 619.437 600.668
Tp
'' 477.741 503.446 584.759
PP
'' 655.876 619.352 601.395
Tr
1.49 1.335 1.181
Pr
6.114 4.263 4.576
Z 0.865 0.691 0.663
Figure 6 Show the mole percent of nitrogen verses pseudo-critical Pressure.
Figure 7 Show the Z-factor verses pseudo-reduce temperature & pressure.
Figure 8 Z-factor obtained from Stewart & Kay and correction with
impurities verses pseudo-critical temperature& pressure.
Conclusion
Natural gases, which contain H2
S and CO2
frequently, exhibit
different compressibility factor behavior than do sweet gases.
Wichert and Aziz & Carr-Kobayashi and Burrows developed a simple
procedure to account for these differences and adjust the pseudo-
critical properties of natural gases. During this study, I observe that
pseudo-critical temperature decreases if the mole percent of N2
increase. While, pseudo-critical pressure was increase with increasing
the percentage of nitrogen. Also, the z factor increases with increasing
pseudo- reduce pressure and temperature. In addition, pseudo-critical
temperature decreases if the mole percent of H2
S increase. I also
notice that when I calculate the z-factor for reservoirs which contain
C7+
by Stewart Mixing Rules and Kay’s there are some deviation on z
factor between two methods but it reduce when I used the correction
method for non-hydrocarbon and it is recommended to use Stewart
Mixing Rules to investigate the impact of non-hydrocarbon impurities
on natural gas properties.
Acknowledgements
None.
Conflict of interest
The author declares no conflict of interest.
References
1. Elsharkawy AM, Ali Elkamel. compressibility factor for sour gas reser-
voir. SPE Asia pacific oil and gas conference and Exhibition, Brisbane,
Australia: Society of petroleum engineers; 2000.
- 11. Effect of non-hydrocarbon components on gas compressibility factor values and correlations 134
Copyright:
©2017 Hamada
Citation: Hamada GM. Effect of non-hydrocarbon components on gas compressibility factor values and correlations. J Appl Biotechnol Bioeng.
2017;2(4):124‒134. DOI: 10.15406/jabb.2017.02.00036
2. Savidge JL. Comprssibility of natural gas class 1040 The first require-
ment of gas measurement is accuracy, ISHM Lawrence Reid Award Re-
cipient, USA: CRT 2000.
3. John Lee W, Wattenbarger RA. Gas Reservoir Engineering. Australia:
Society of petroleum engineers; 1996;5:349.
4. Rushing JA, Newsham KE, Van Fraassen KC, et al. Natural Gas z-Factor
at HP/HT reservoir conditions: comparing laboratory measurements with
industry-standard correlations for a Dry Gas. CIPC/SPE gas technology
symposium 2008 joint conference, Alberta, Canada: Society of petro-
leum engineers; 2008.
5. Sutton RP. Fundamental PVT Calculation for Associated and Gas/ Con-
densate natural Gas SystemS. USA: SPE Reservoir Evaluation & Engi-
neering; 2005;10(3).
6. Tarek A. Reservoir engineering Handbook. 3rd ed. USA: Elsevier; 2006.
7. Kareem LA. Z Factor: Implicit correlation, convergence problem and
pseudo-reduced compressibility. SPE Nigeria annual international con-
ference and exhibition, Lagos, Nigeria: Society of petroleum engineers;
2014.
8. Verri G, Sorbie KS, Singleton MA, et al. Iron Sulfide Scale Management
in High H2
S and CO2
Carbonate Reservoirs. Aberdeen, UK: SPE Pro-
duction & Operations; 2016.
9. Ehsan H, Jamshid M, Masoud R. New correlations to predict natural gas
viscosity and compressibility factor. Journal of Petroleum Science and
Engineering. 2010;73(1-2):67–72.
10. Obuba J, Oubaani IC, Ikeki CK, et al. Natural gas compressibili-
ty factor correlation evaluation for niger delta gas fields. IOSR-JEEE.
2013;6(4):1–10.