Downloaded 11 times


![78
stants to obtain better description of both vapor pressure and molar volume.
But these models generally have discontinuities or at least sharp and
unphysical temperature variation around the critical region. Further, this
approach can result in physically unrealistic negative predictions for heat
capacities (Trebble and Bishnoi, 1986).
It is evident that the theoretical deficiency of these models precludes
simultaneous prediction of all thermodynamic properties. We thus propose a
correction term to improve the density predictions of existing models. The
correction is applied to the Peng-Robinson equation of state. In principle, it
is also applicable to any other equation of state.
The density correction term presented in this work is an extension of the
“volume-translation” idea proposed by Peneloux and Rauzy (1982). It is
virtually identical to the Peneloux-Rauzy correction for incompressible
liquids and is a significant improvement near the critical point where liquids
are compressible.
MOLAR VOLUME CORRECTION TERM
According to the Peng-Robinson (1976) equation of state, the pressure of
a pure fluid is given as a function of temperature and molar volume as
follows
RT
p=--
u-b u(u+b):b(u-b)
(1)
where a and b are component-dependent parameters; b is independent of
temperature and a is temperature dependent such that the vapor pressure of
the pure fluid is accurately correlated. Thus,
b = 0.07780 RTJP, (2)
a = d(T) (3)
a, = 0.45724 R2Tc2/Pc (4)
p = [l +c& - T;‘=) + c2(1 - T;12)2 + c&l - Ti’2)3]2
Equation (5), which was proposed by Mathias and Copeman (1983), is
slightly different from that originally proposed by Peng and Robinson
(1976). The original model is obtained when c2 = c3 = 0. The additional
parameters are useful to correlate the vapor pressure data of highly polar
substances like water and methanol.
Equations (l)-(5) provide a good fit of the vapor pressure for most
substances, but the prediction of molar volumes can be seriously in error. In
particular, the prediction of saturated liquid molar volumes can be in error](https://image.slidesharecdn.com/adensitycorrectionforthepeng-robinsonequation-180404143020/85/A-density-correction-for-the-peng-robinson-equation-2-320.jpg)
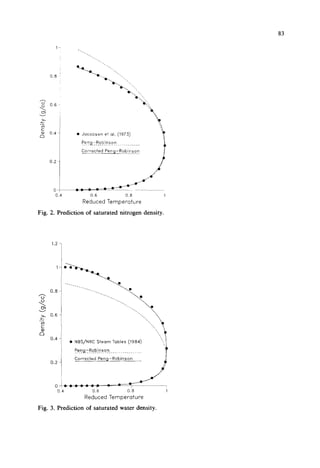
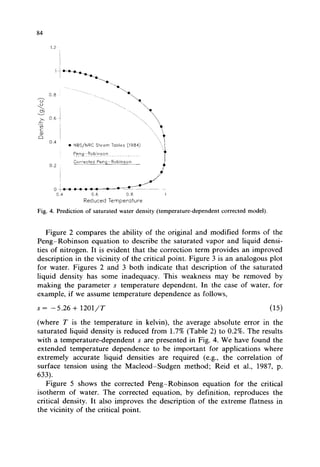


This document presents a density correction for the Peng-Robinson equation of state. The correction involves adding a simple empirical term that requires one parameter per component. It improves the prediction of liquid densities by 2-4% and vapor densities slightly. The correction retains the internal consistency between vapor and liquid properties predicted by equations of state. It provides a reliable way to enhance density predictions without significantly affecting other properties.