Downloaded 169 times
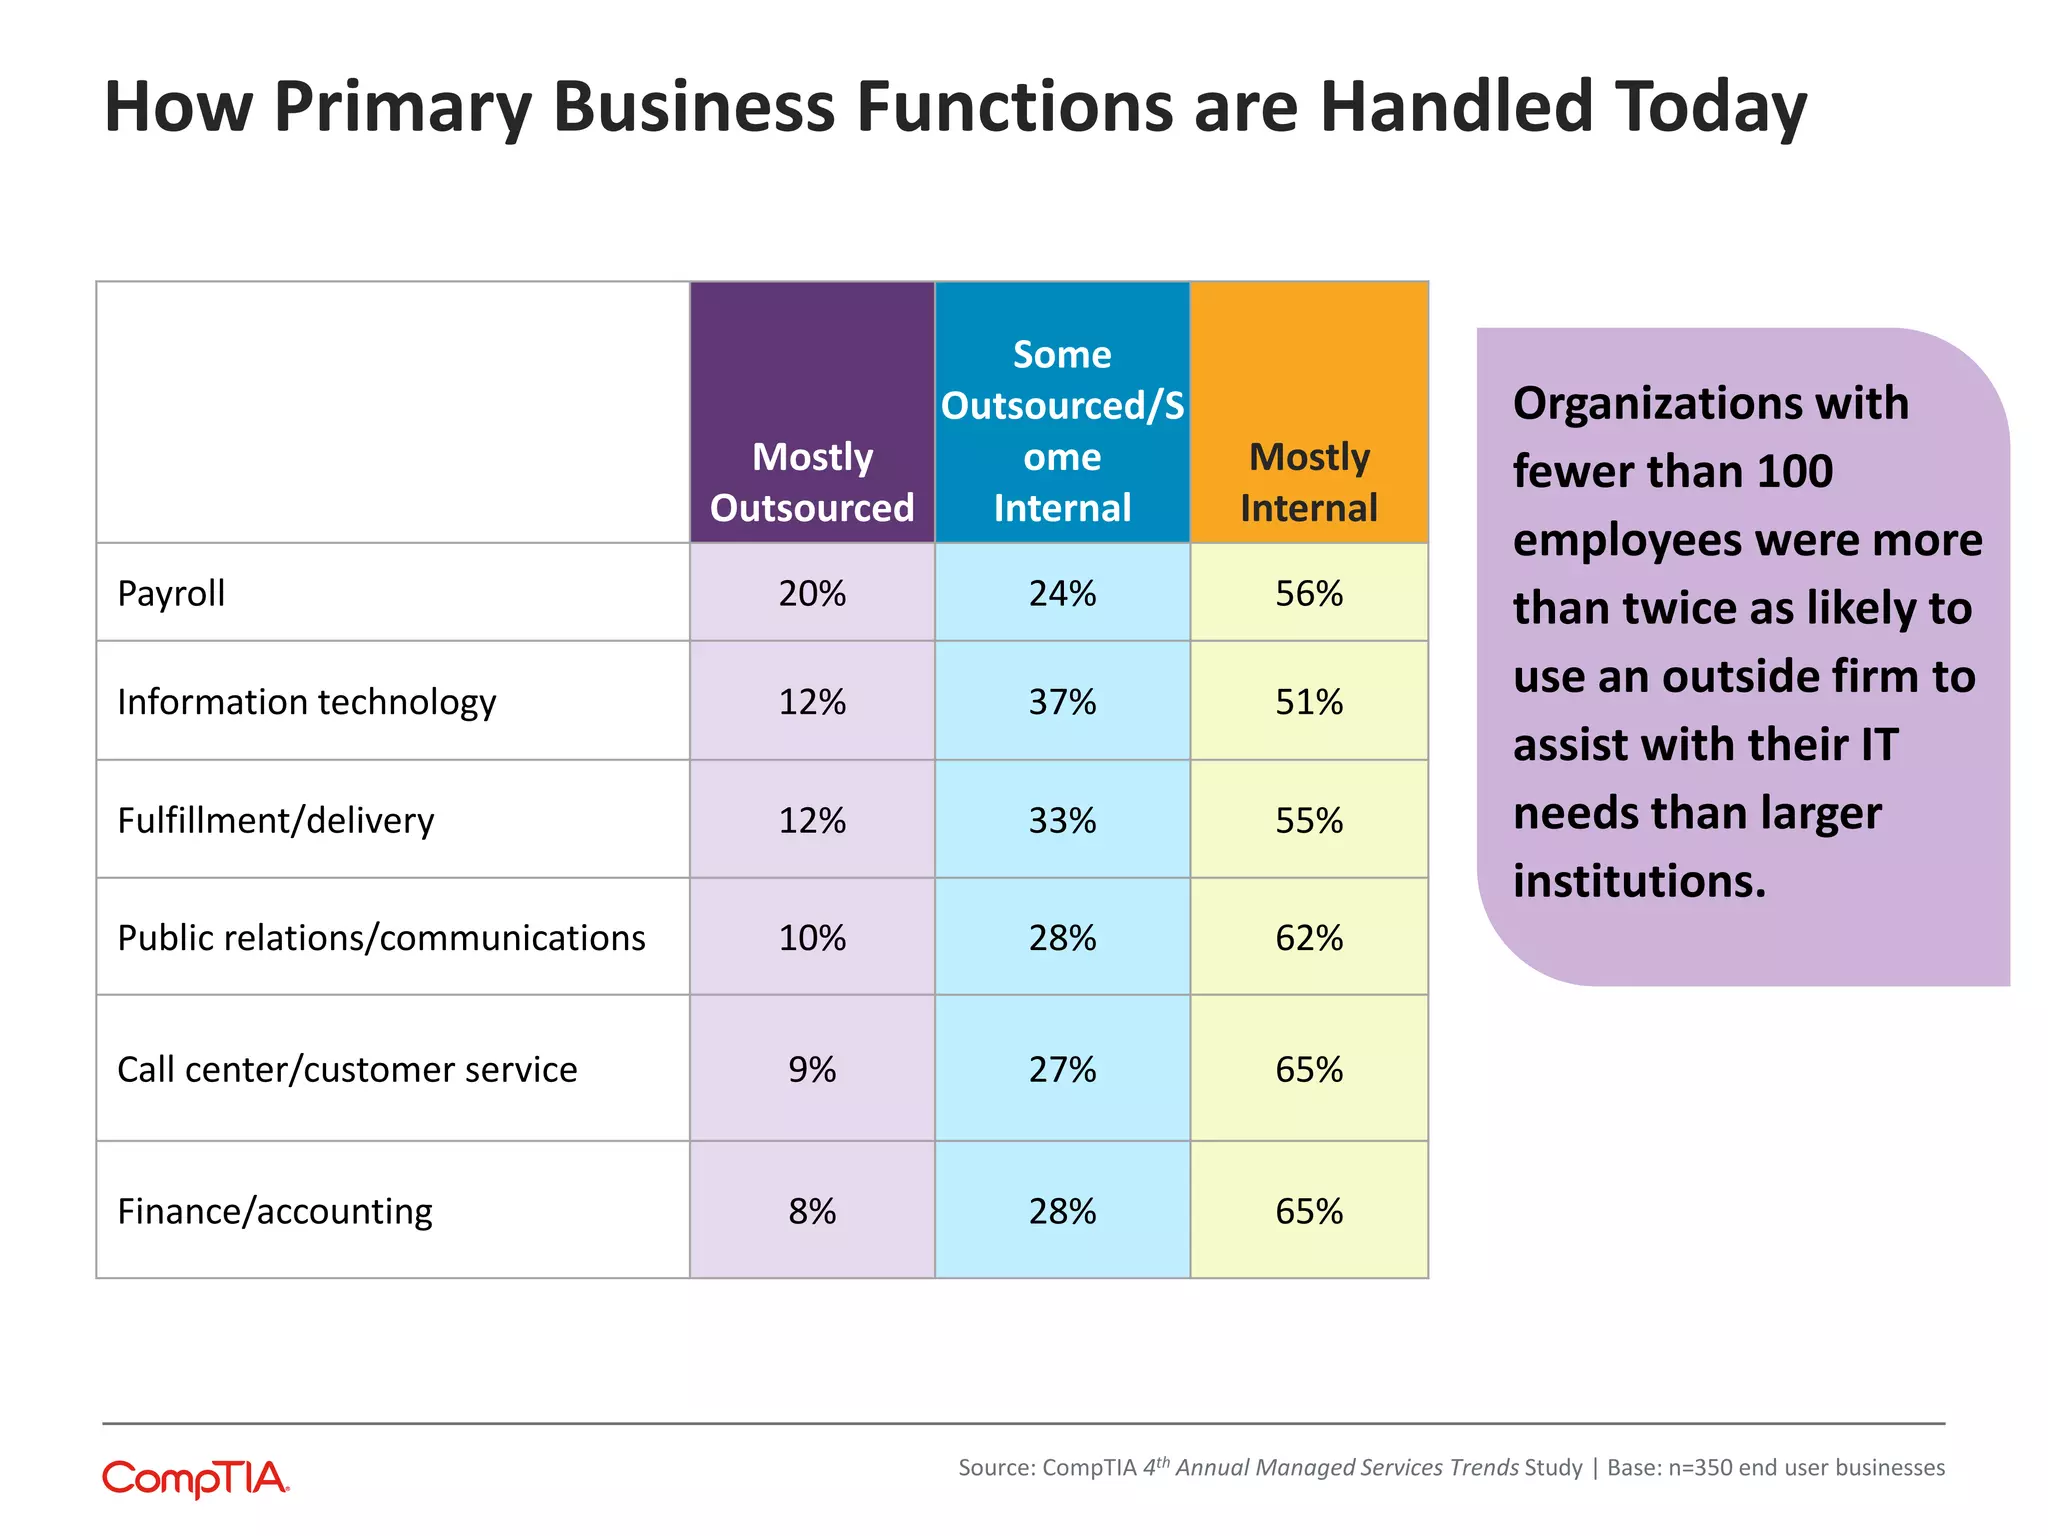

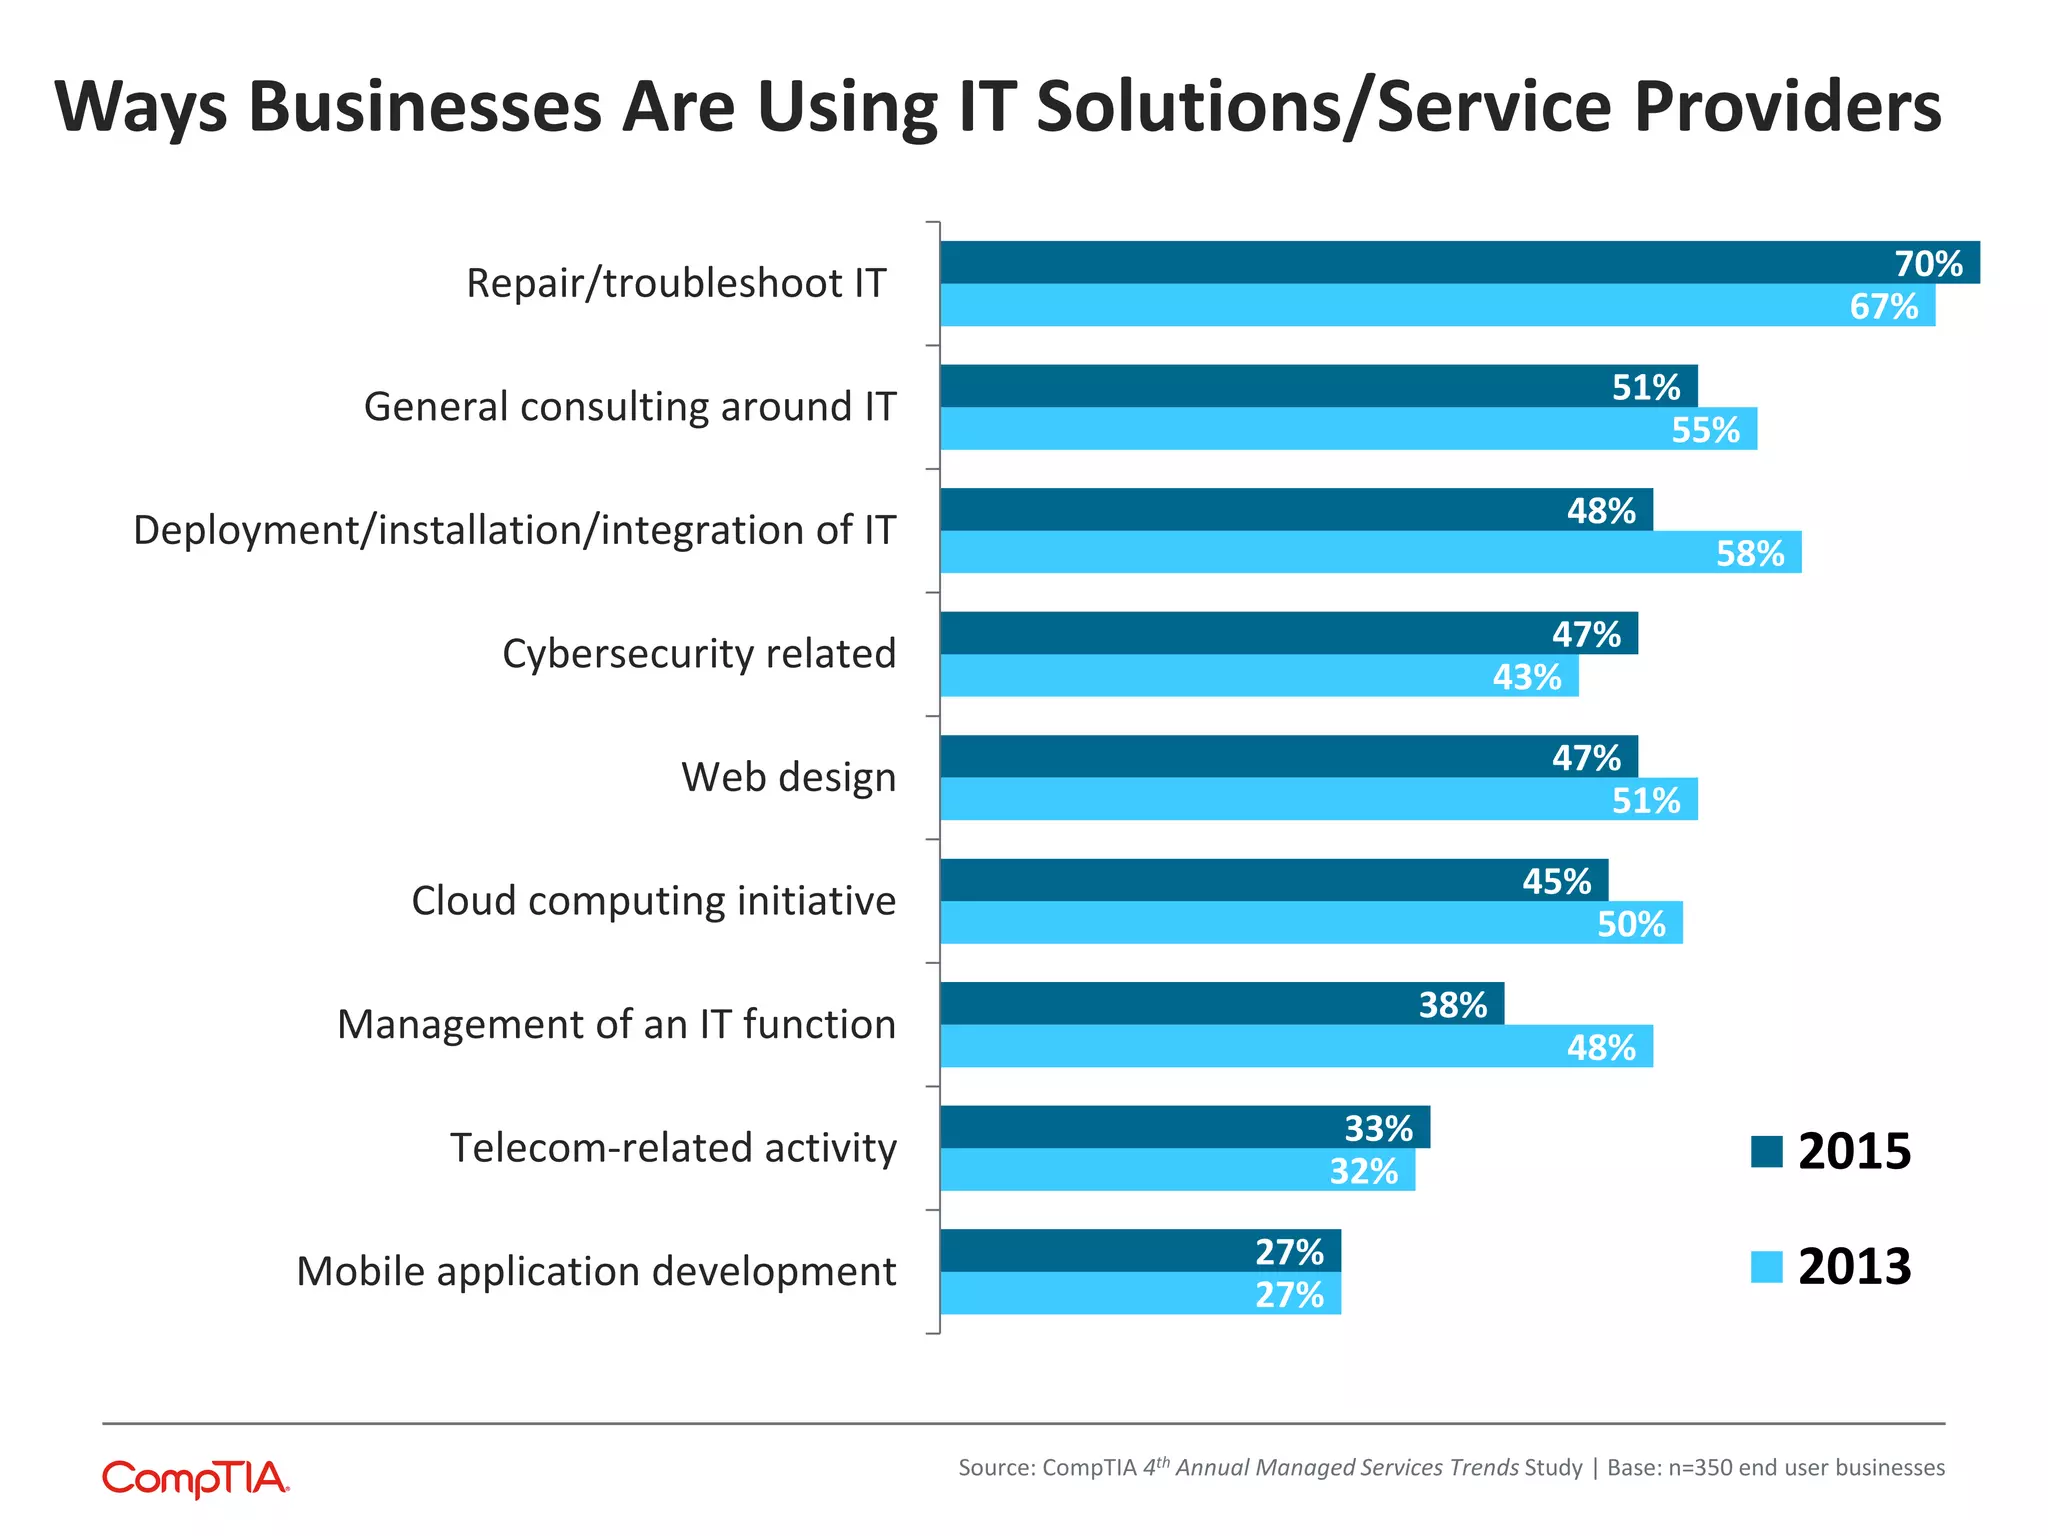
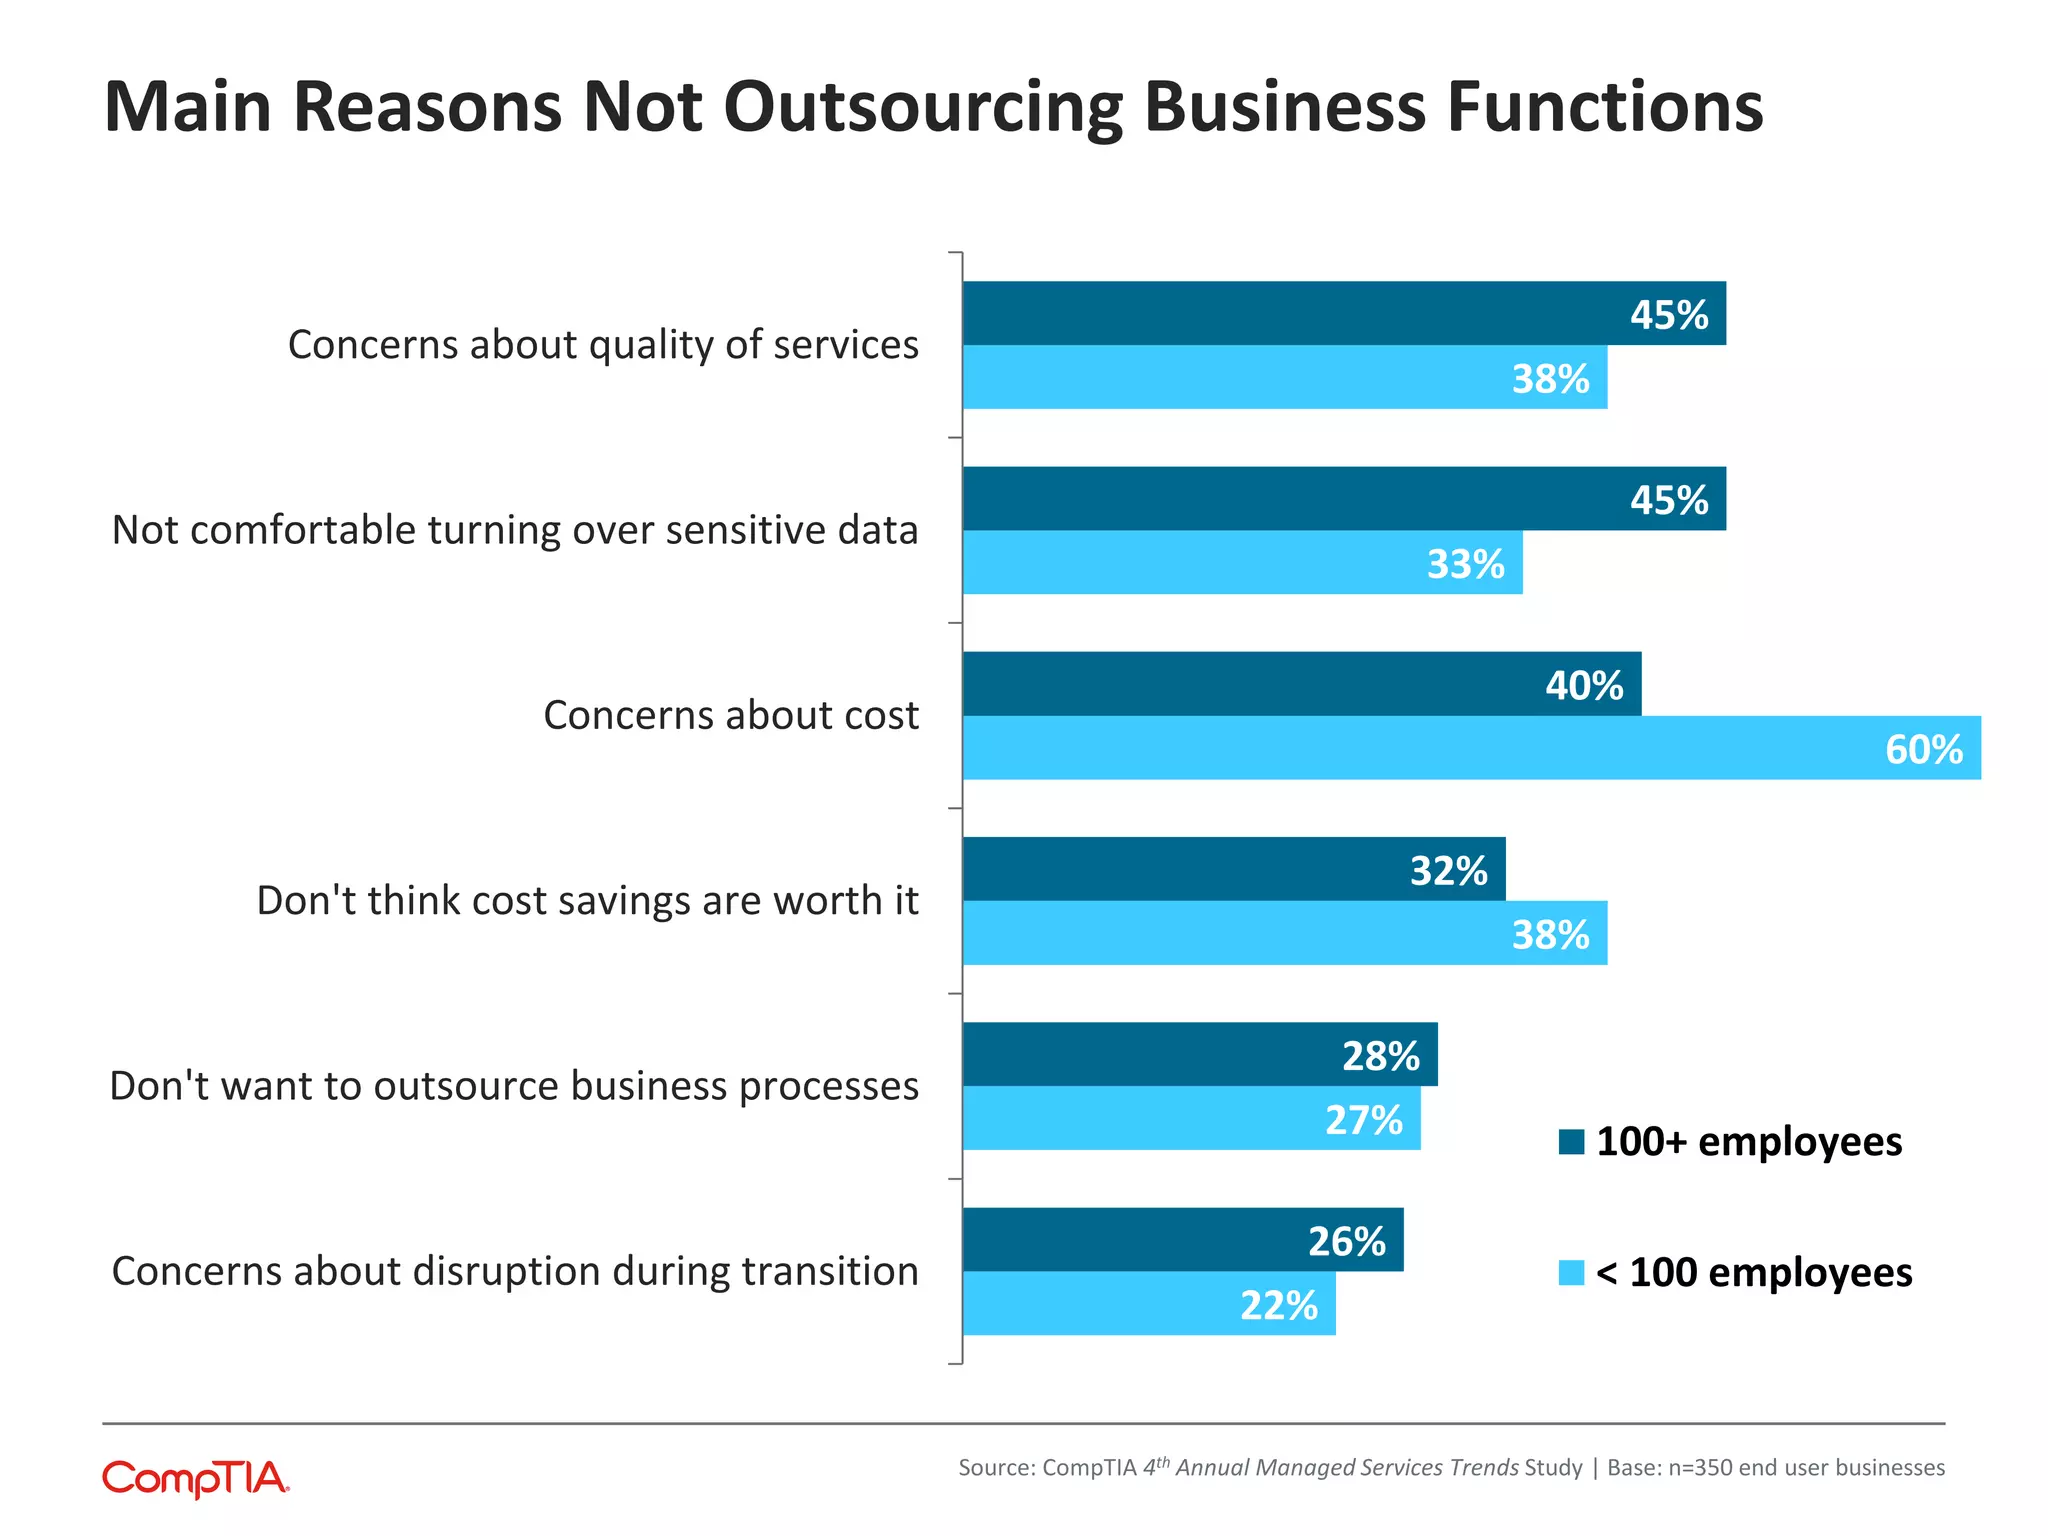
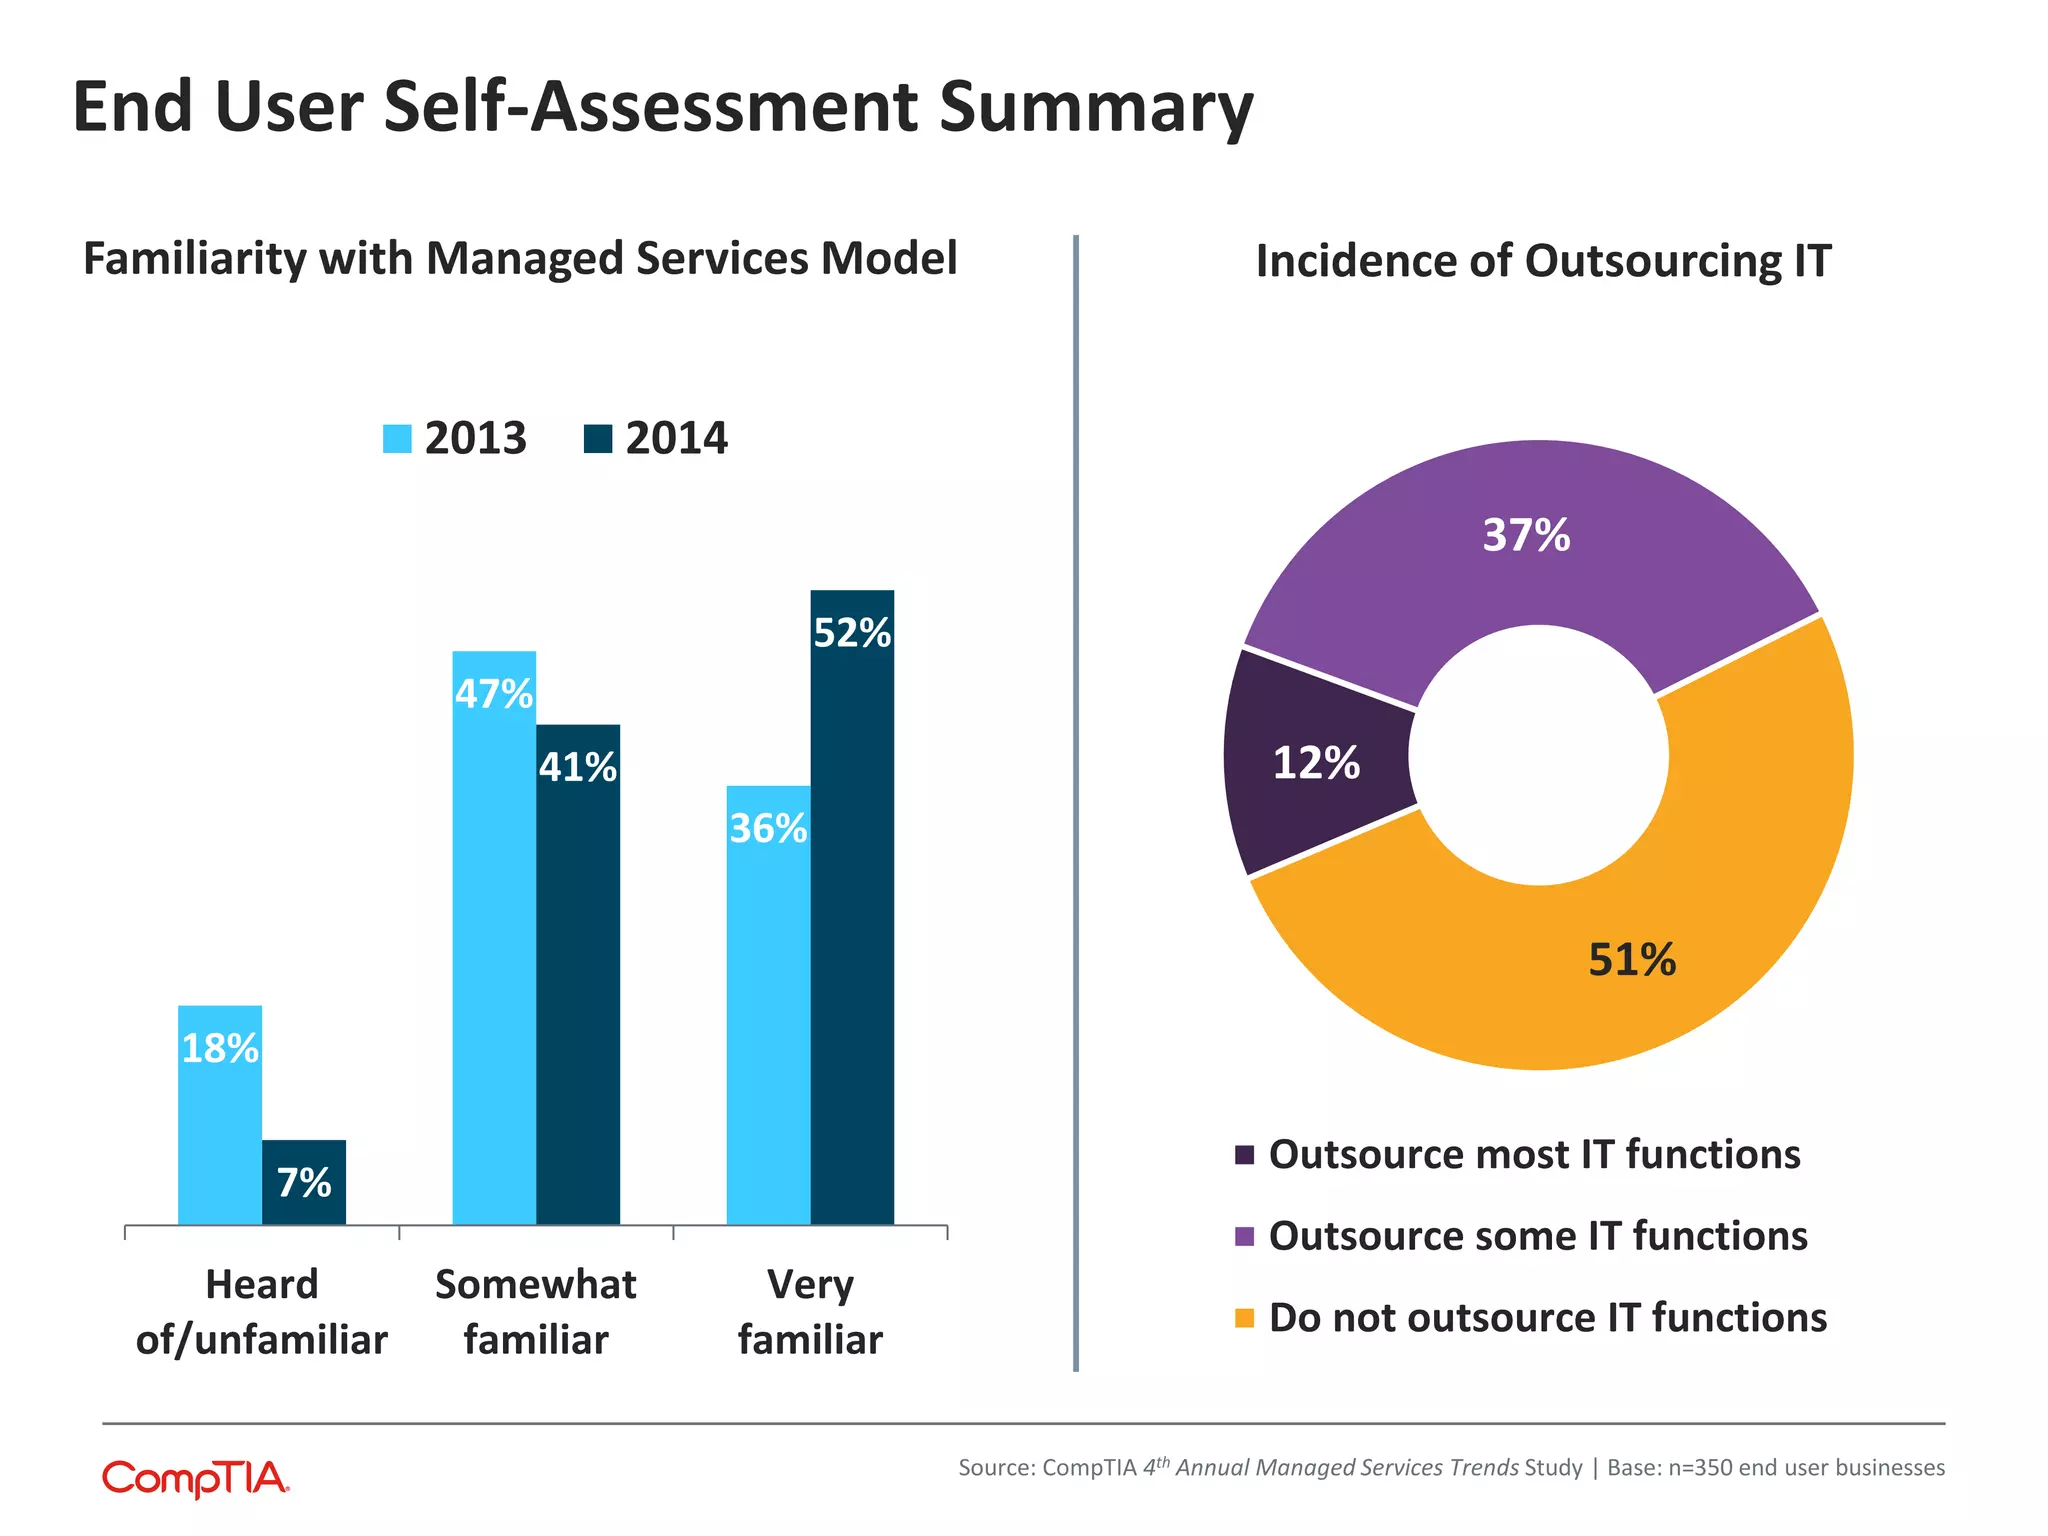
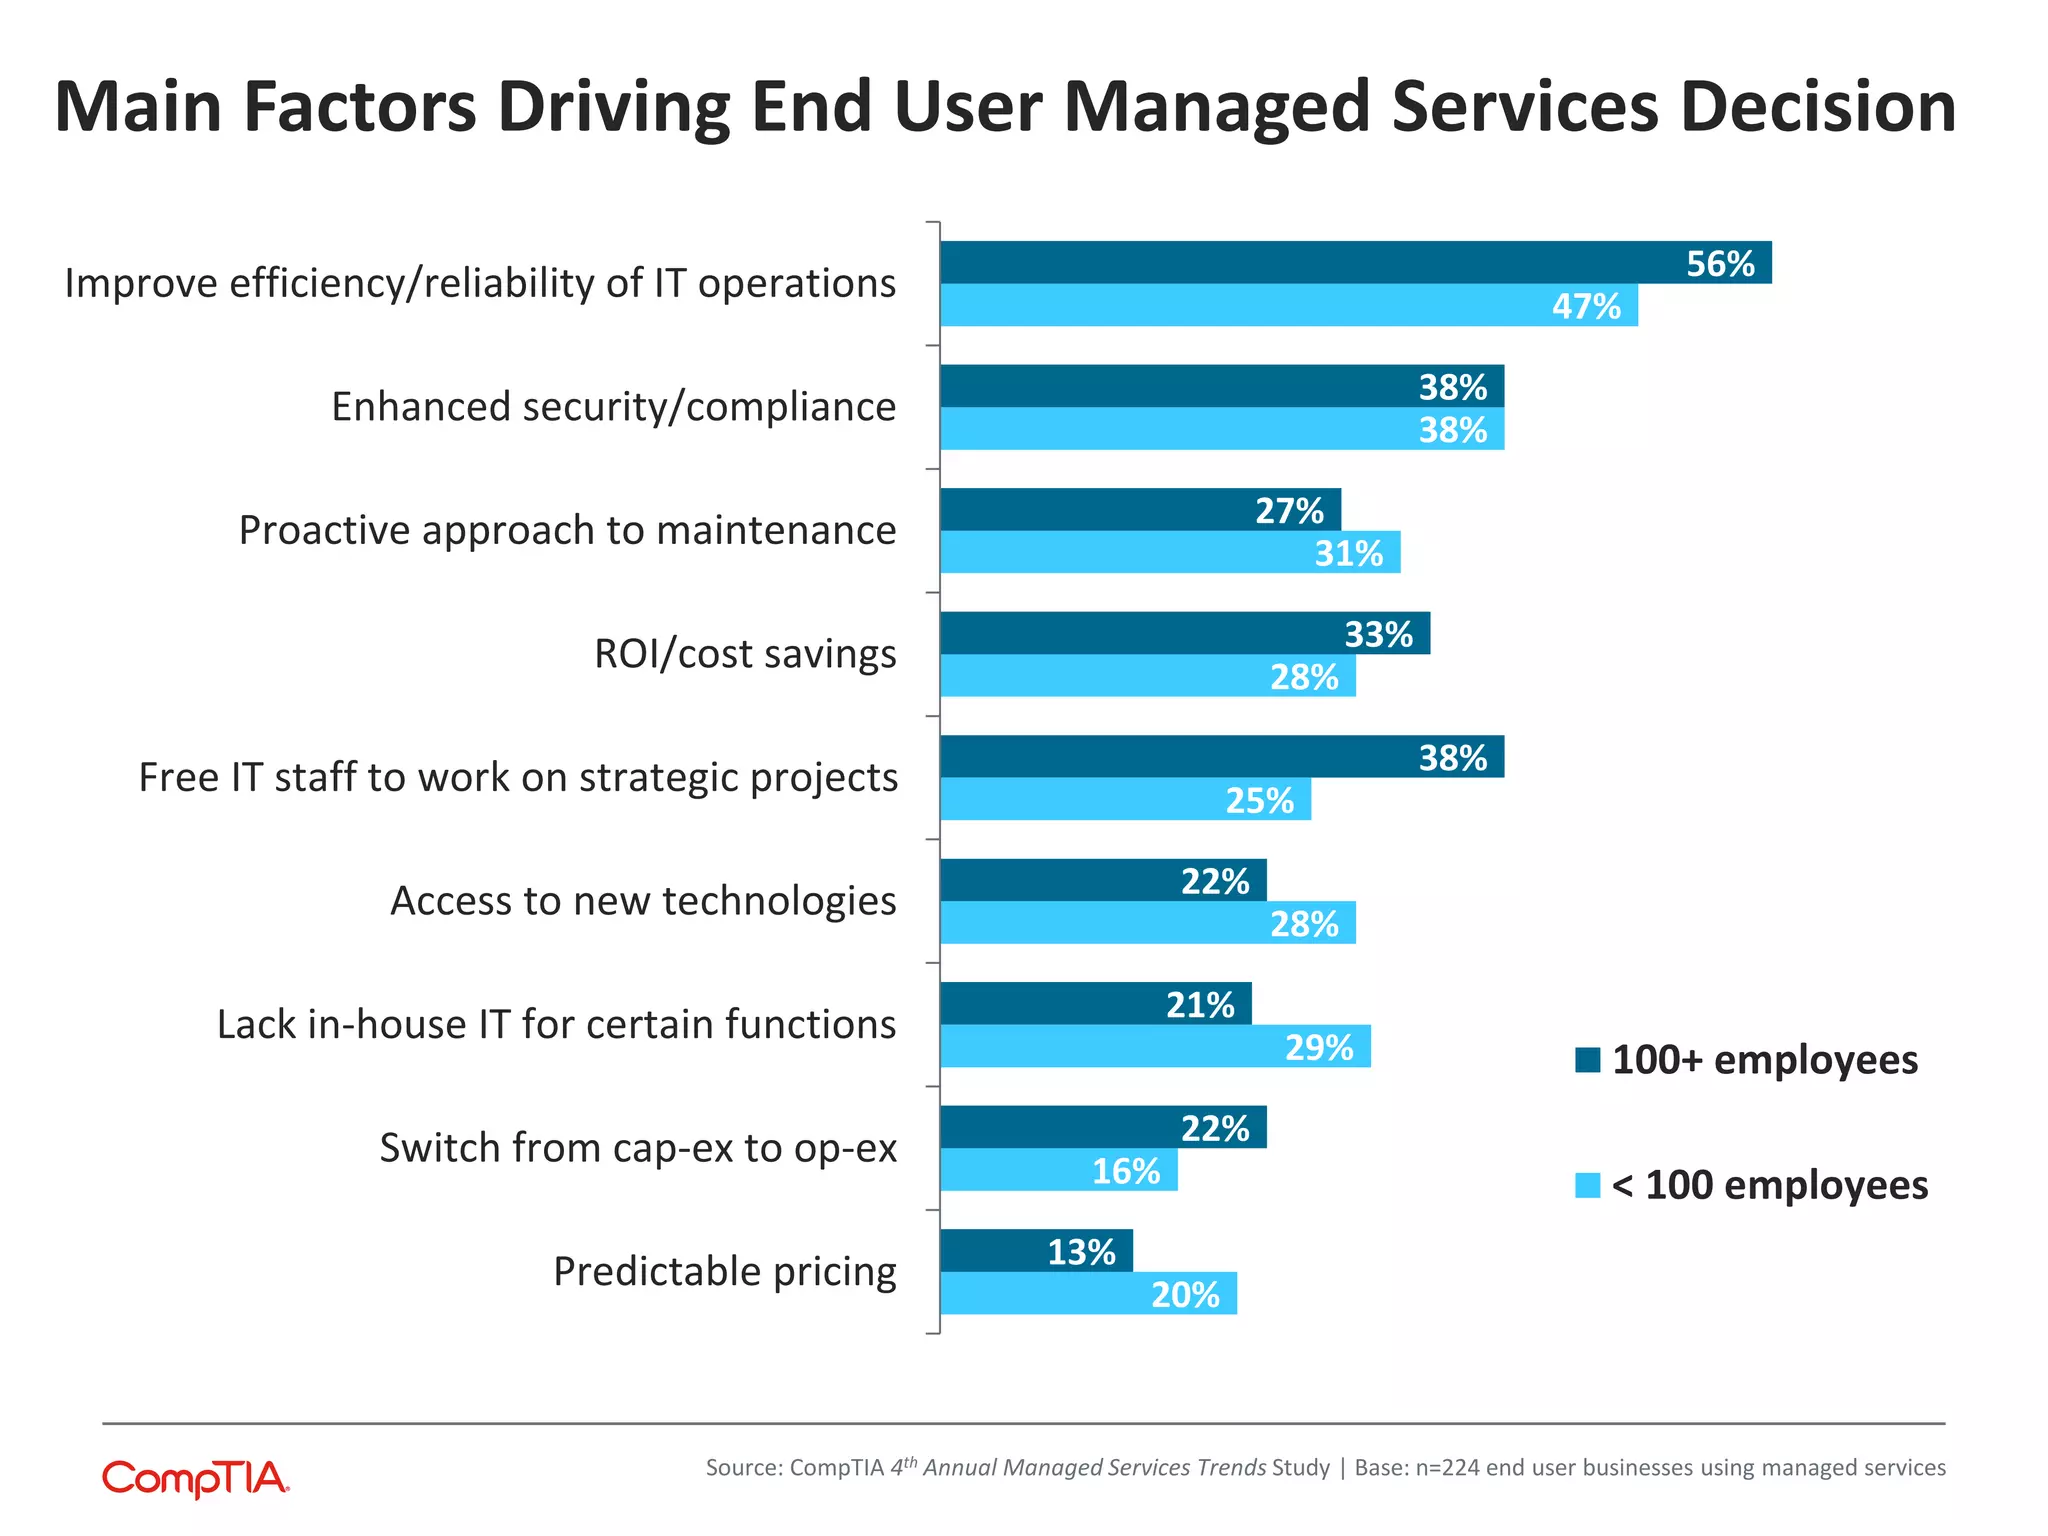
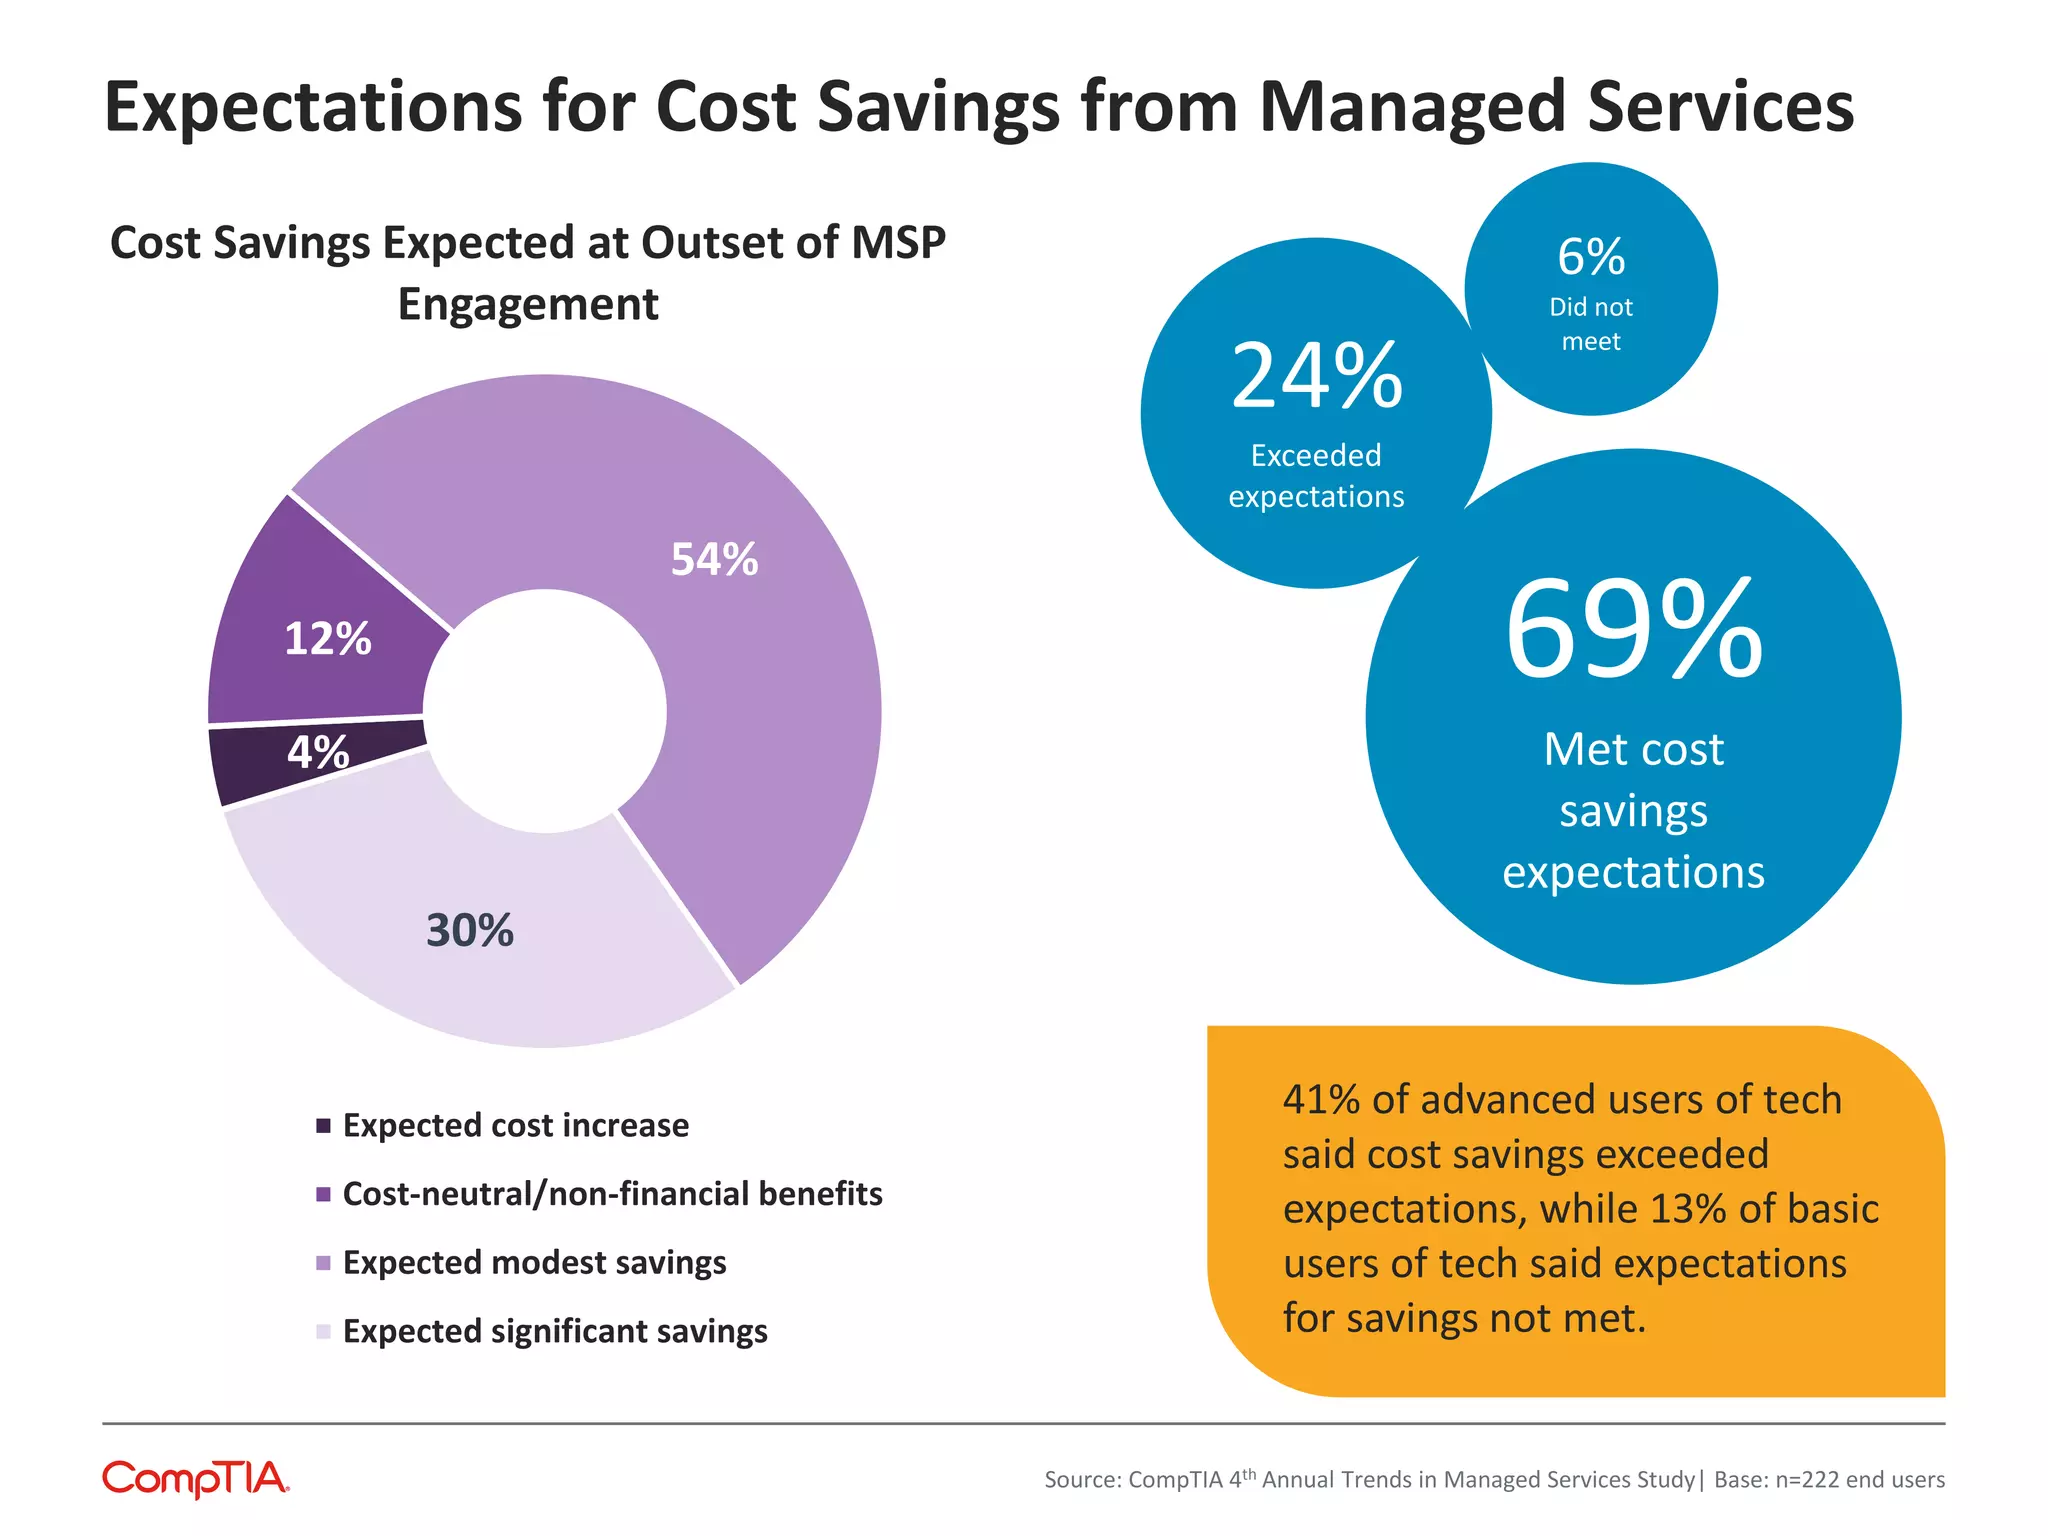


The document summarizes findings from a survey of 350 businesses on their use of managed IT services. Key findings include: - Smaller businesses (<100 employees) were over twice as likely to outsource IT compared to larger businesses. - While most businesses have a formal IT department, many also use outside firms for projects or troubleshooting. - Over half of businesses were satisfied with their current IT management, but 39% said it could be better. - Functions like security, cloud computing and mobile apps saw larger increases in outsourcing from 2013-2015.


![[CompTIA] 4th Annual Trends in Cloud Computing - Full Report](https://cdn.slidesharecdn.com/ss_thumbnails/report-4thannualtrendsincloudcomputing-fullreport-131219044440-phpapp02-thumbnail.jpg?width=640&height=640&fit=bounds)


