Professor of Teaching at University of British Columbia-Vancouver
Nov. 12, 2019•0 likes•1,371 views
1 of 24
Getting Started with OER (JIBC, November 2019)
Nov. 12, 2019•0 likes•1,371 views
Download to read offline
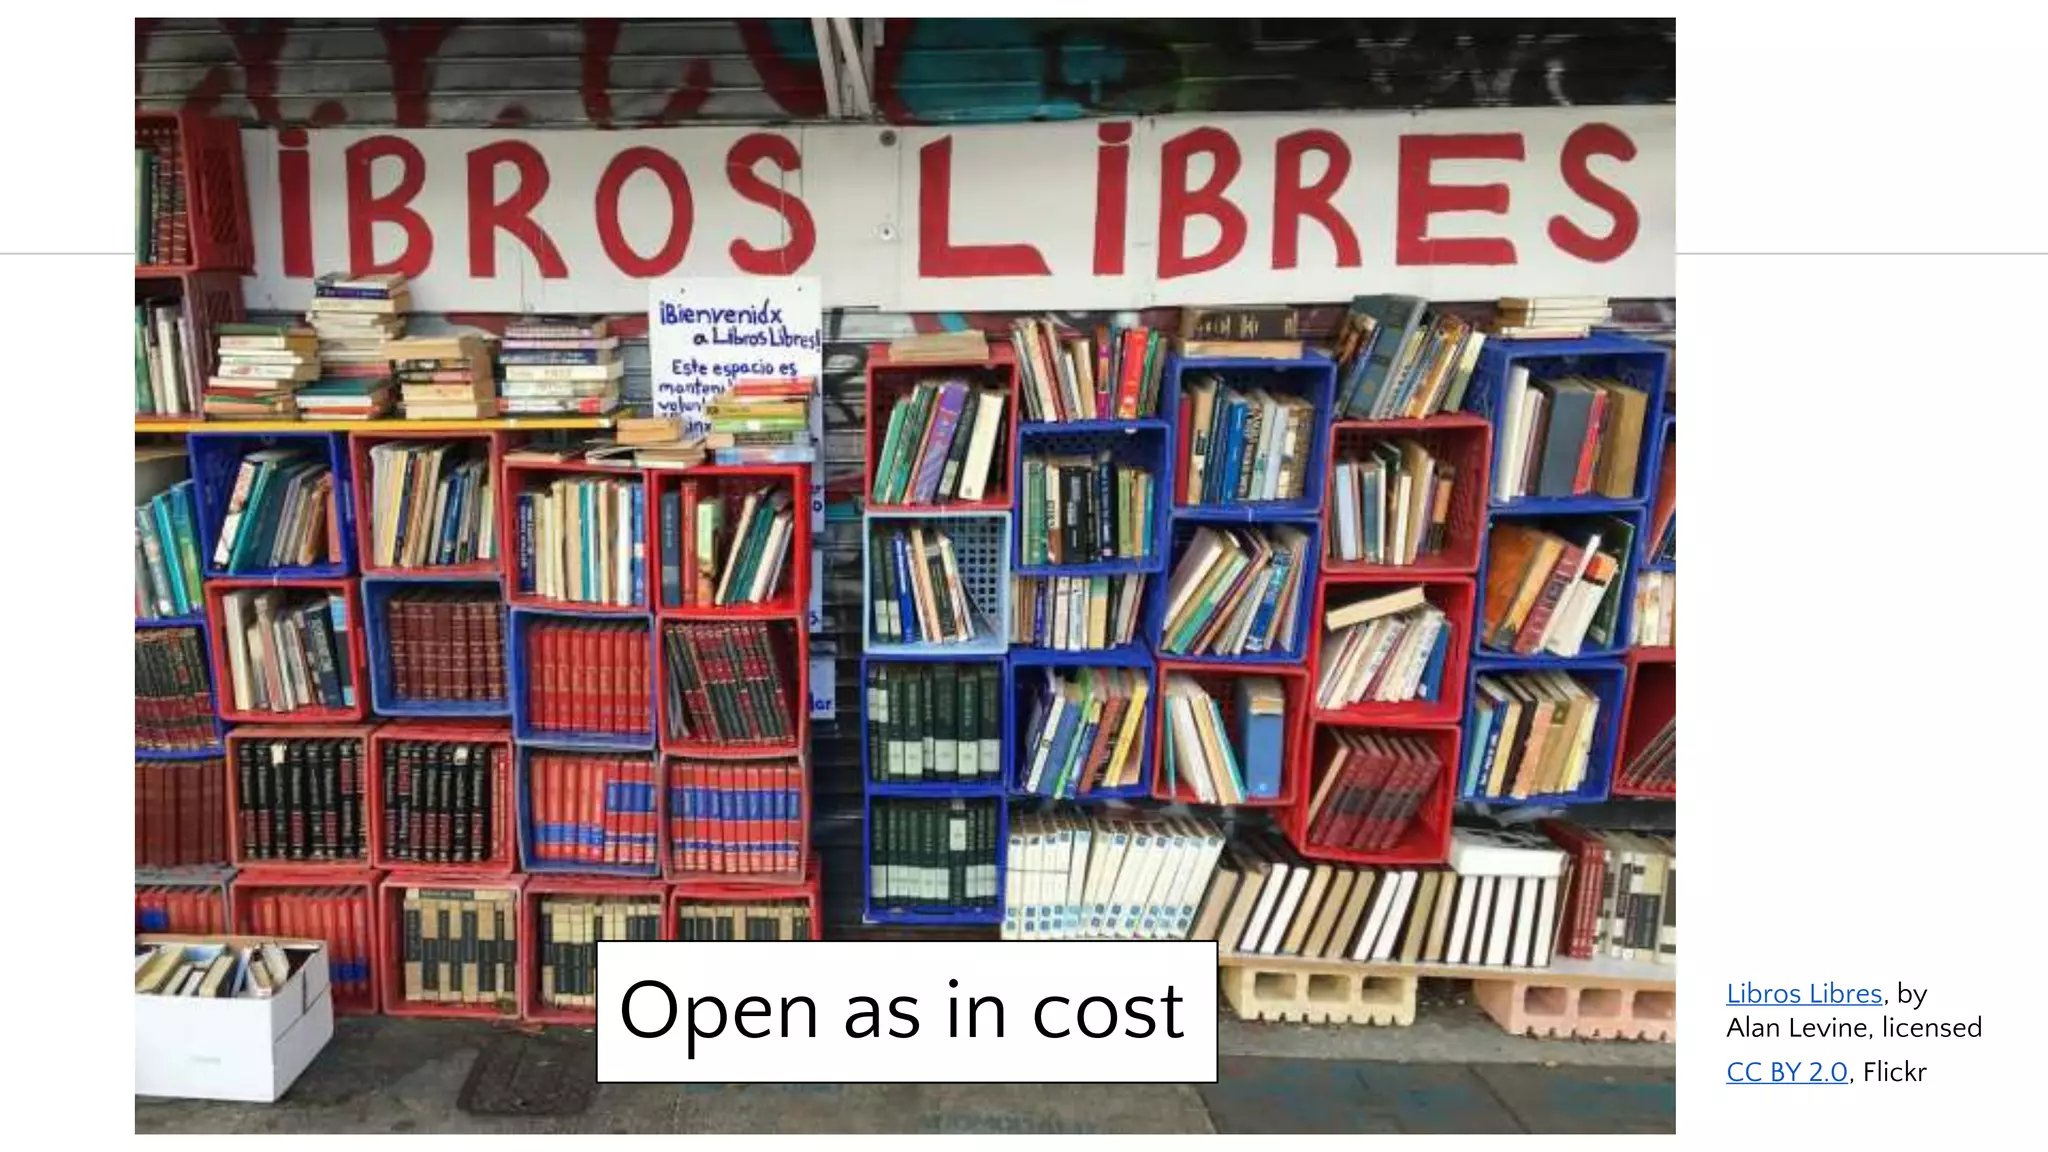
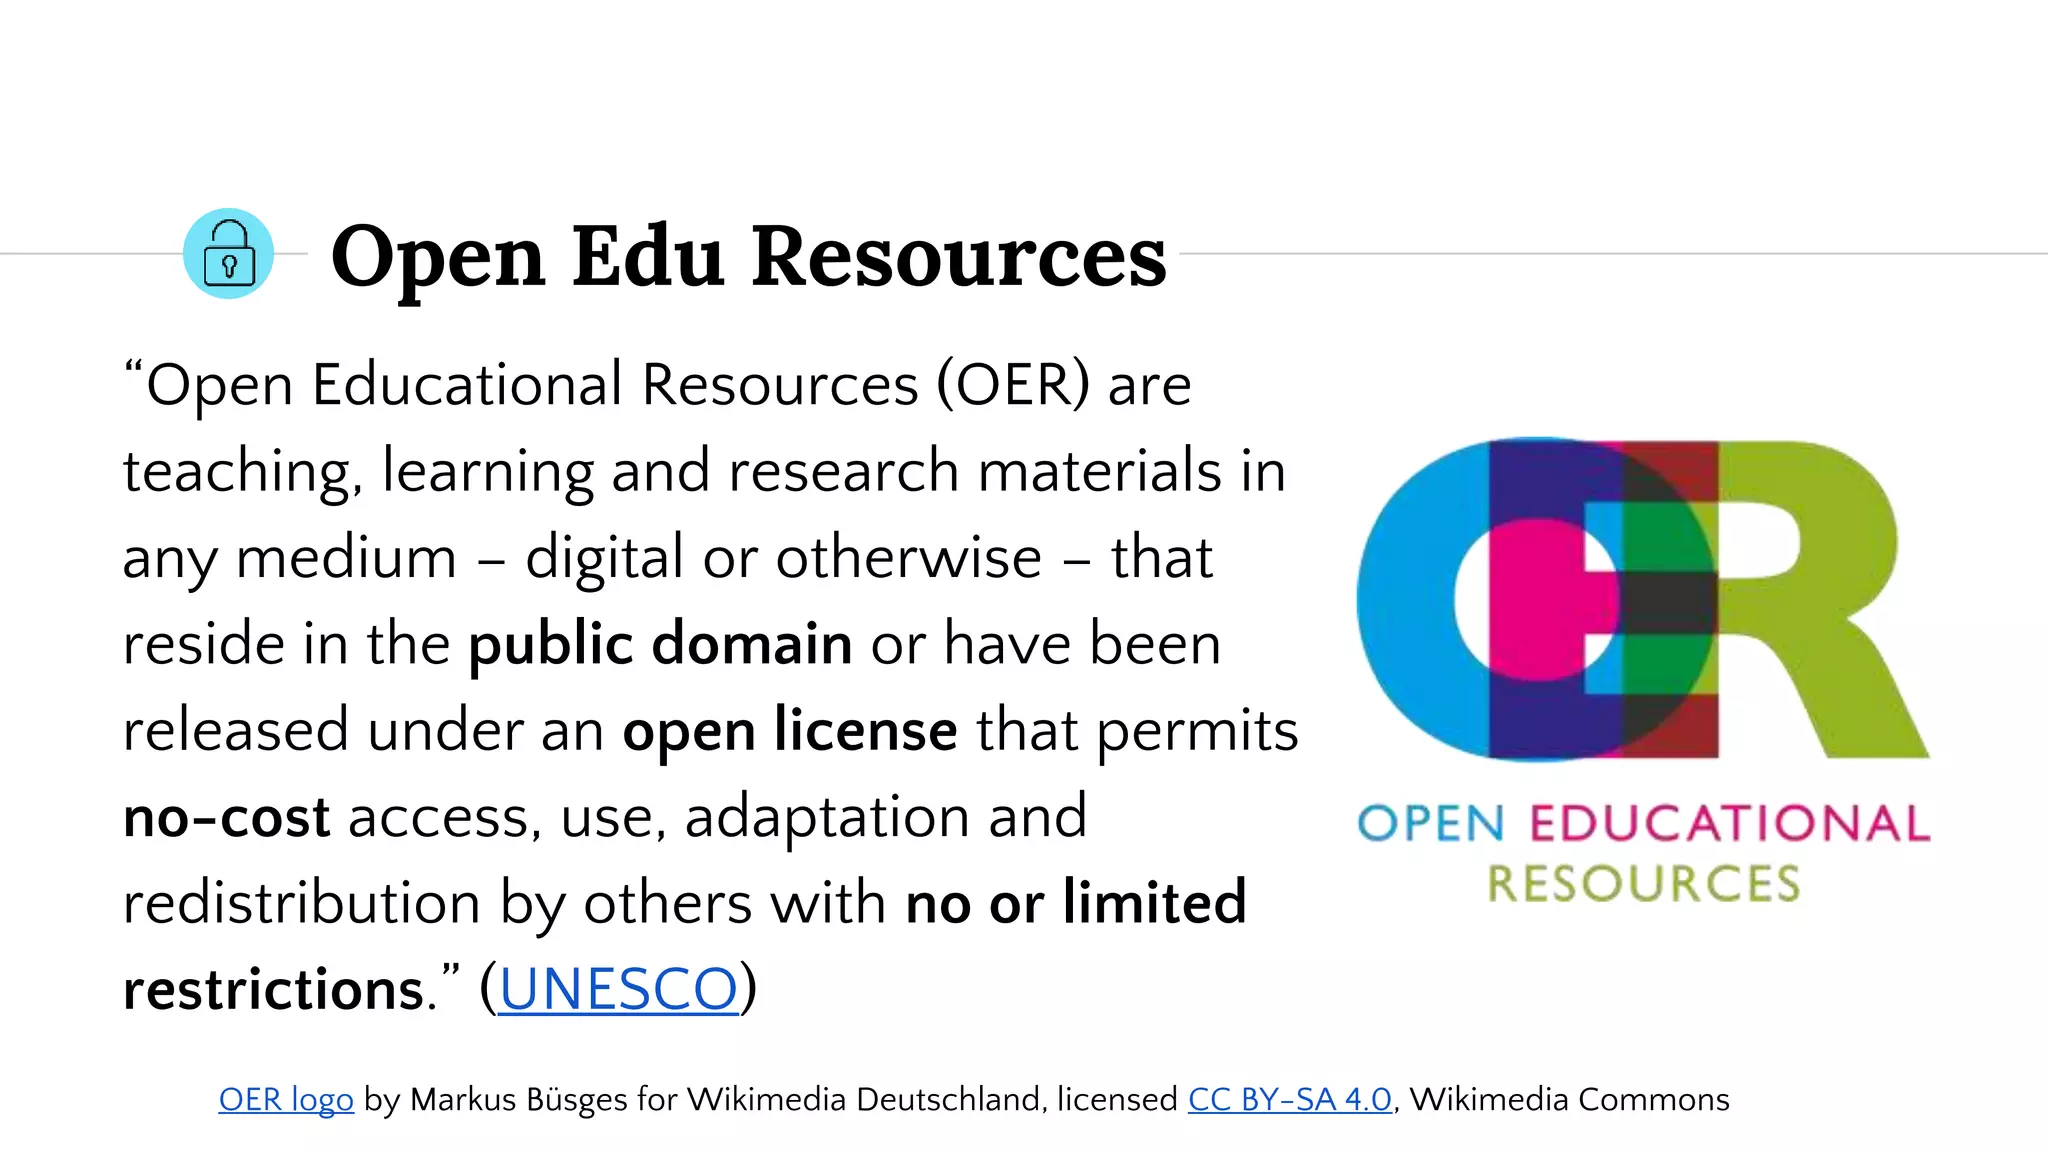
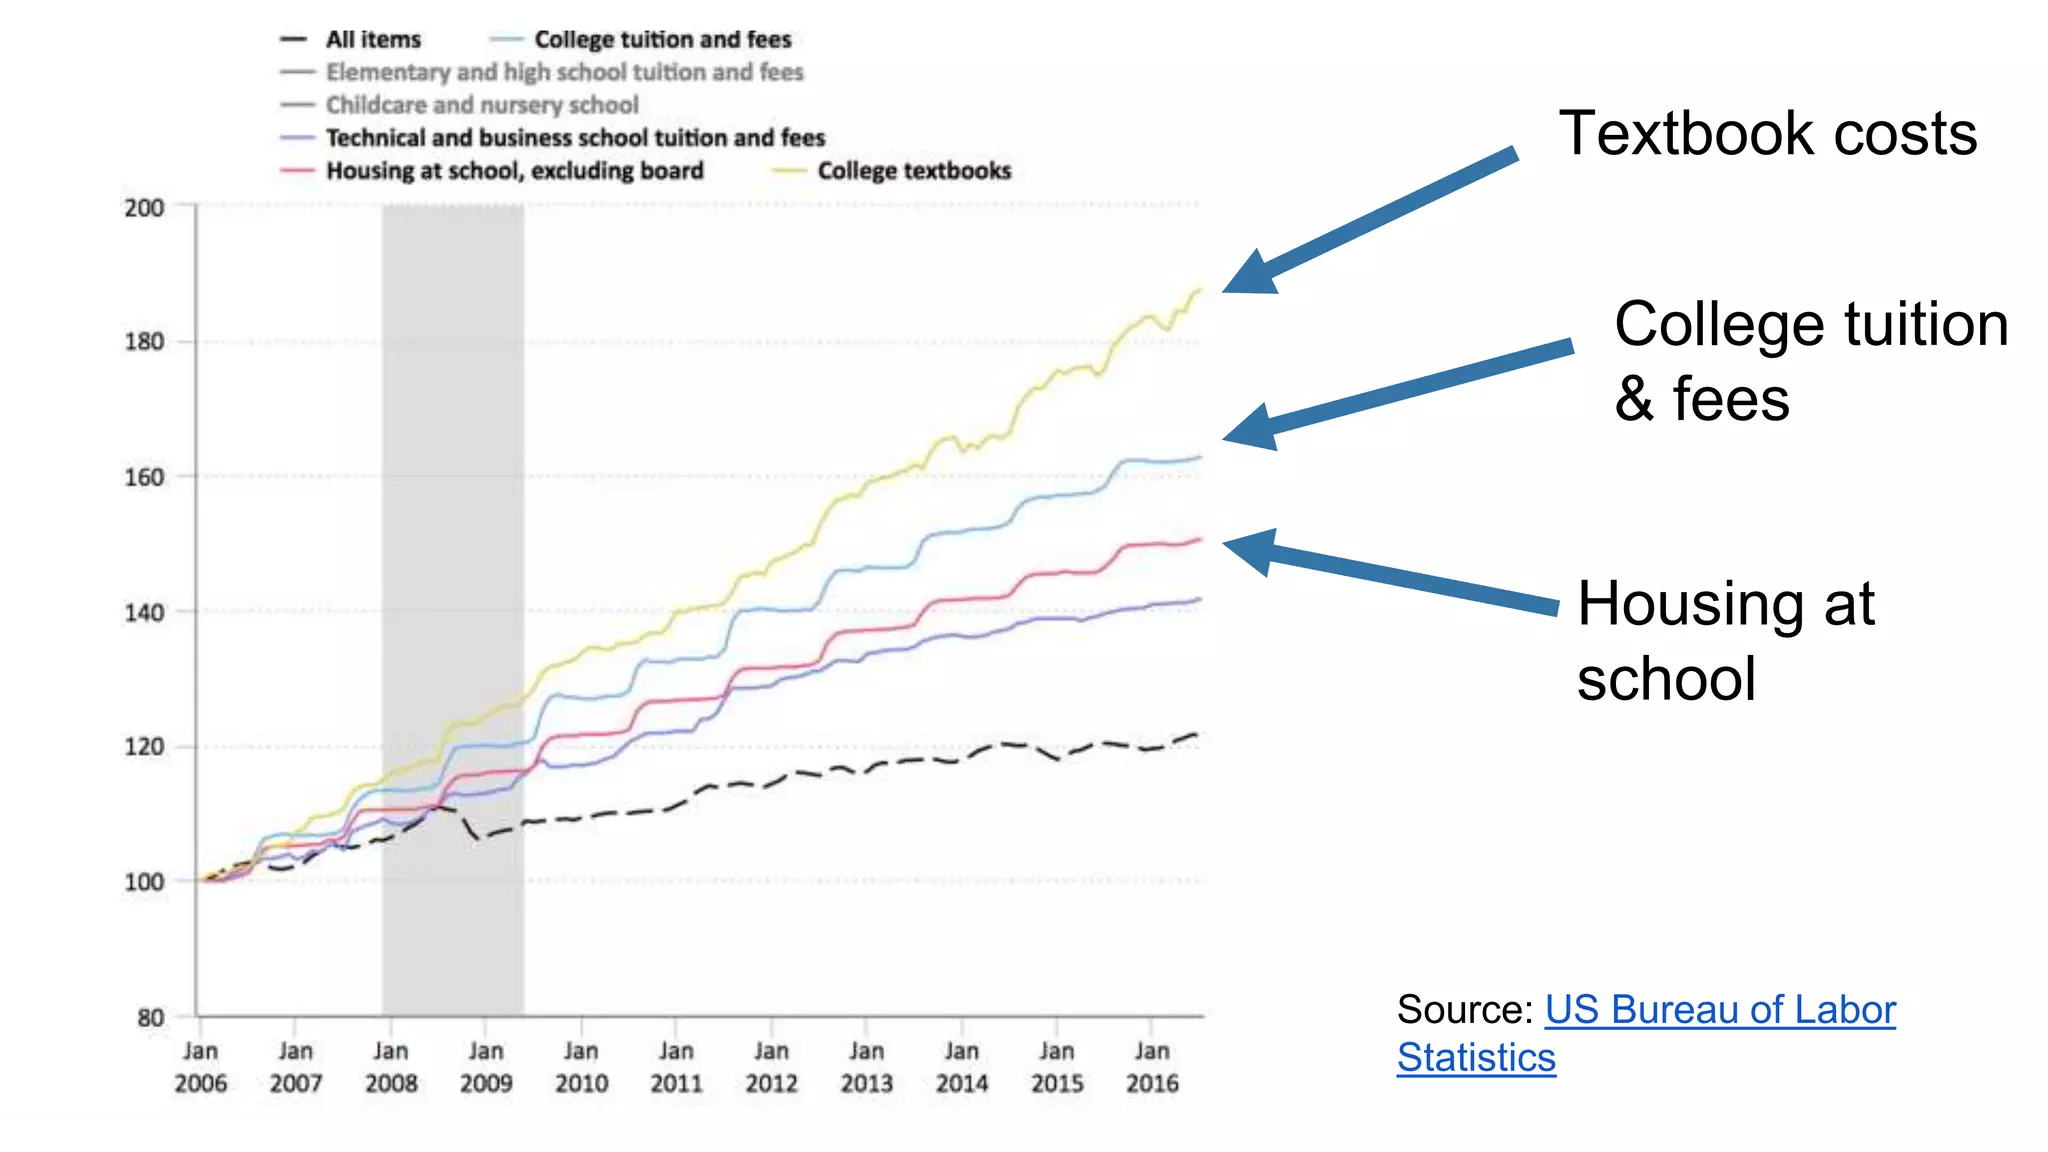
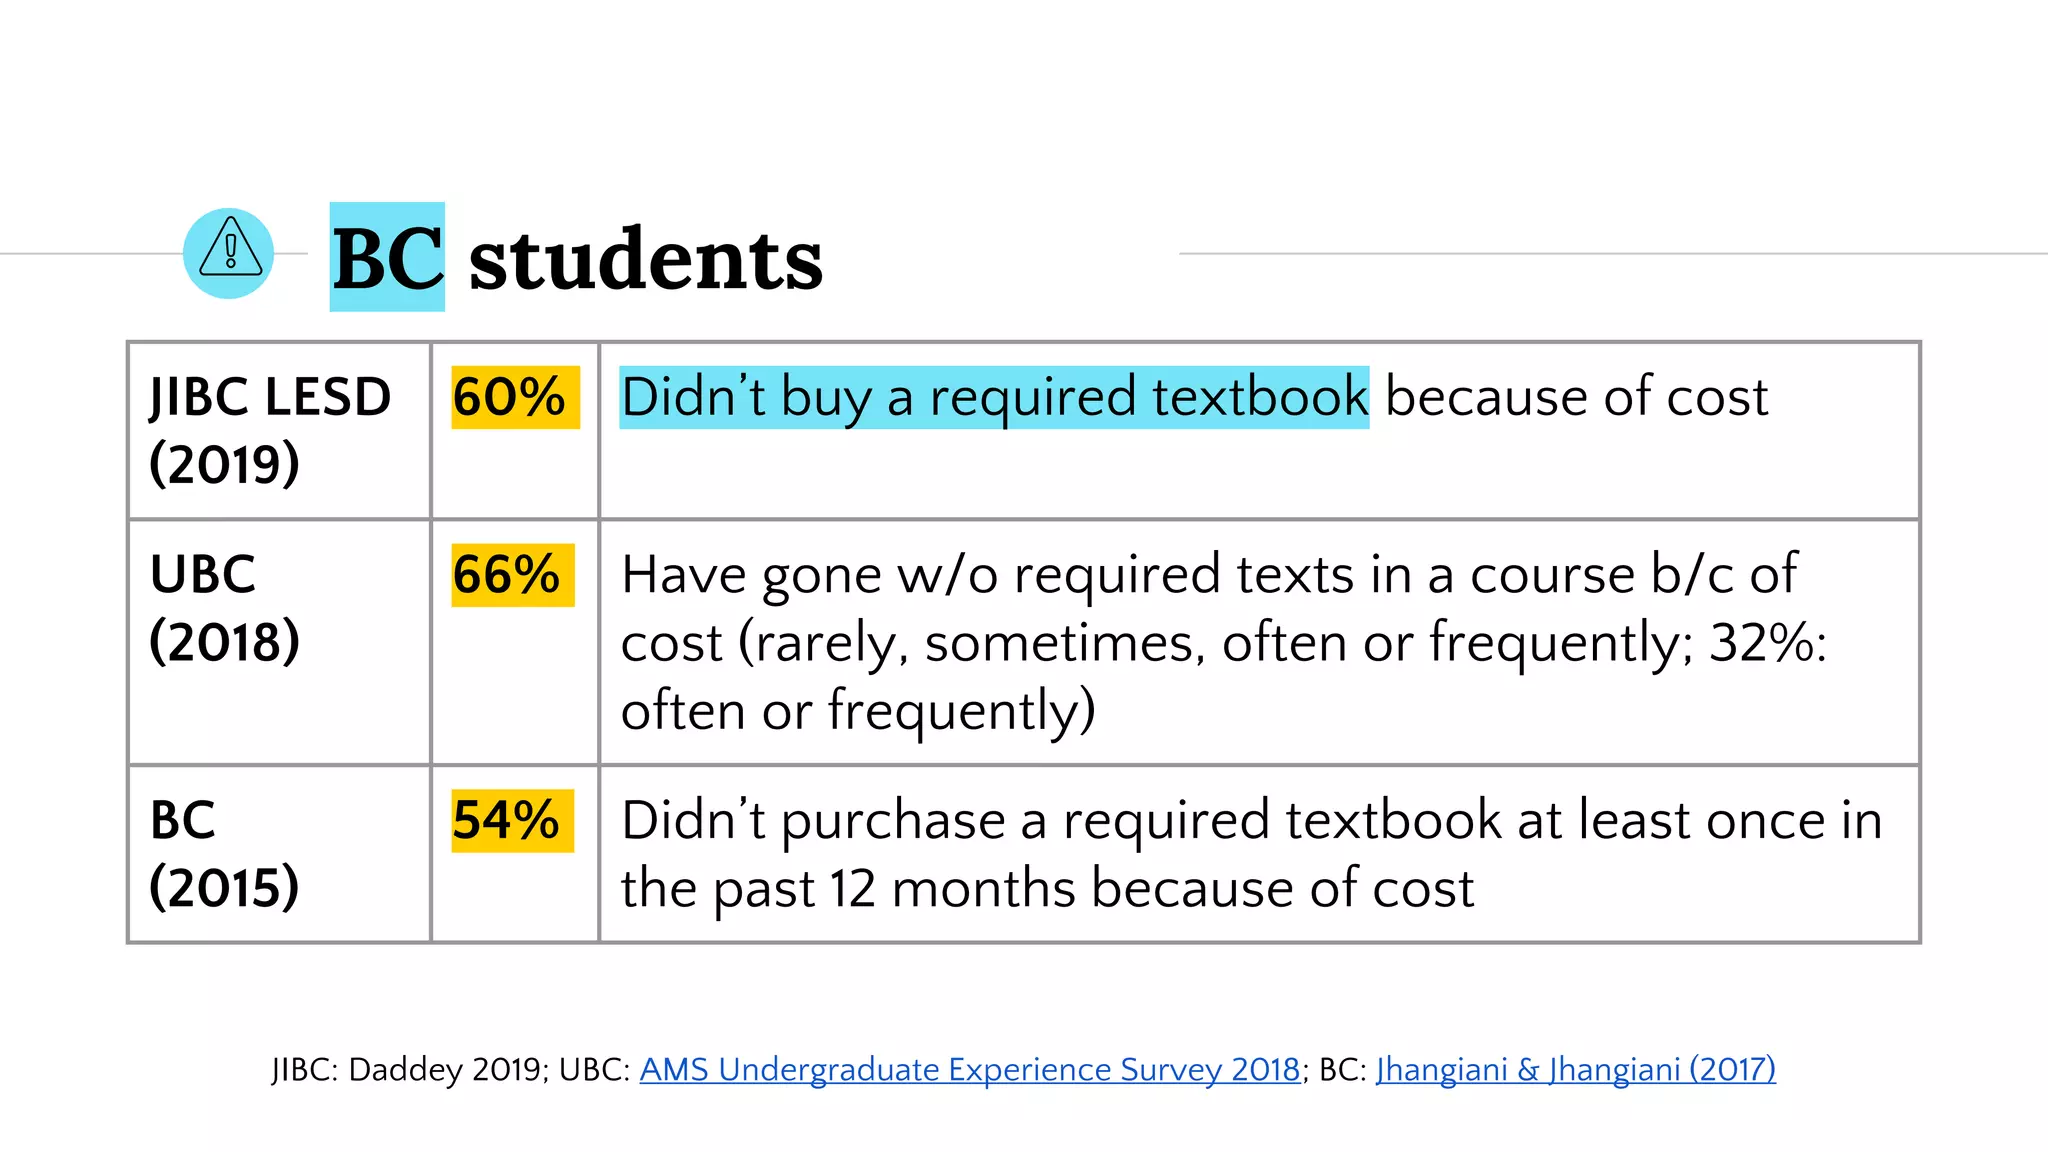
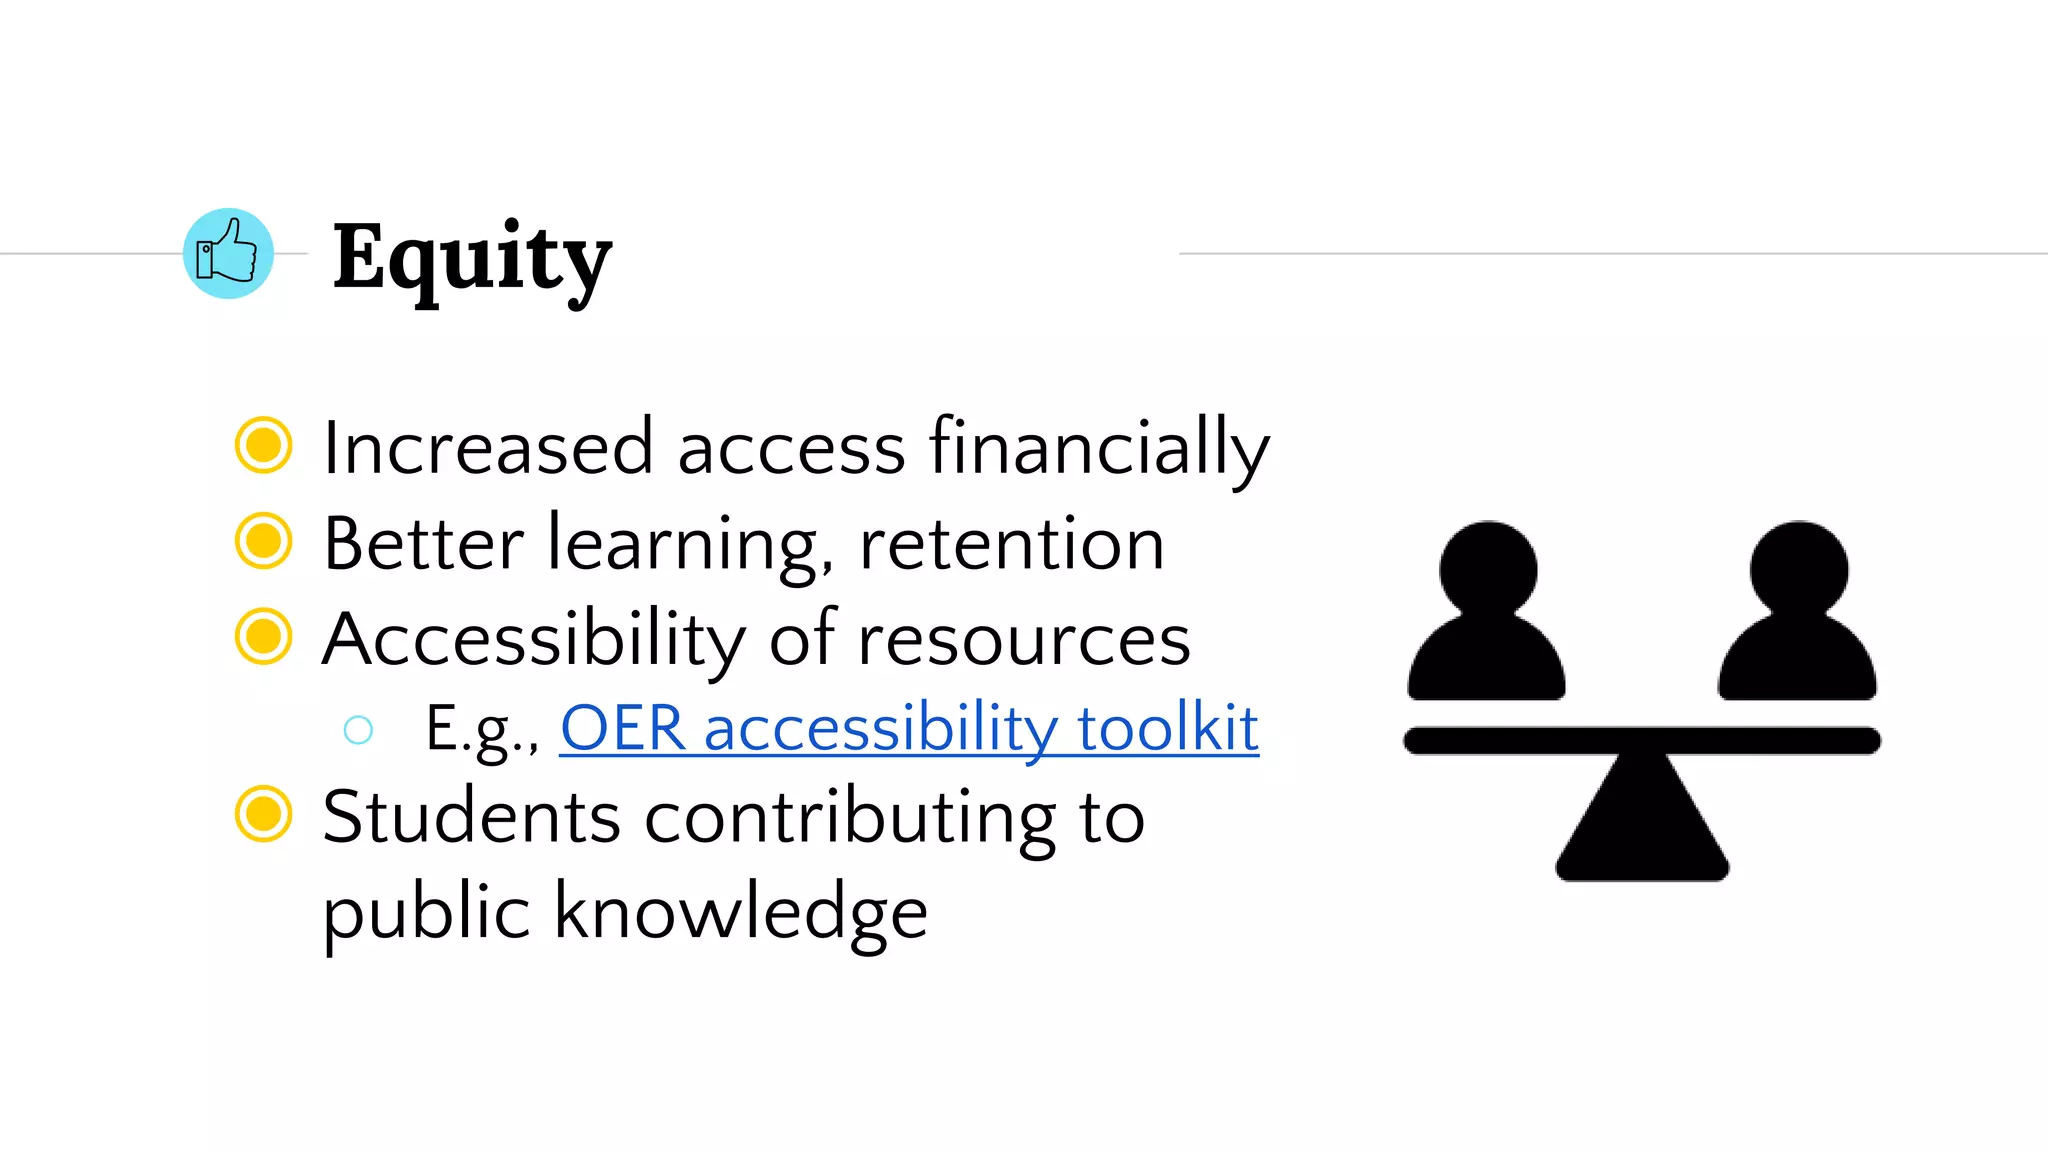
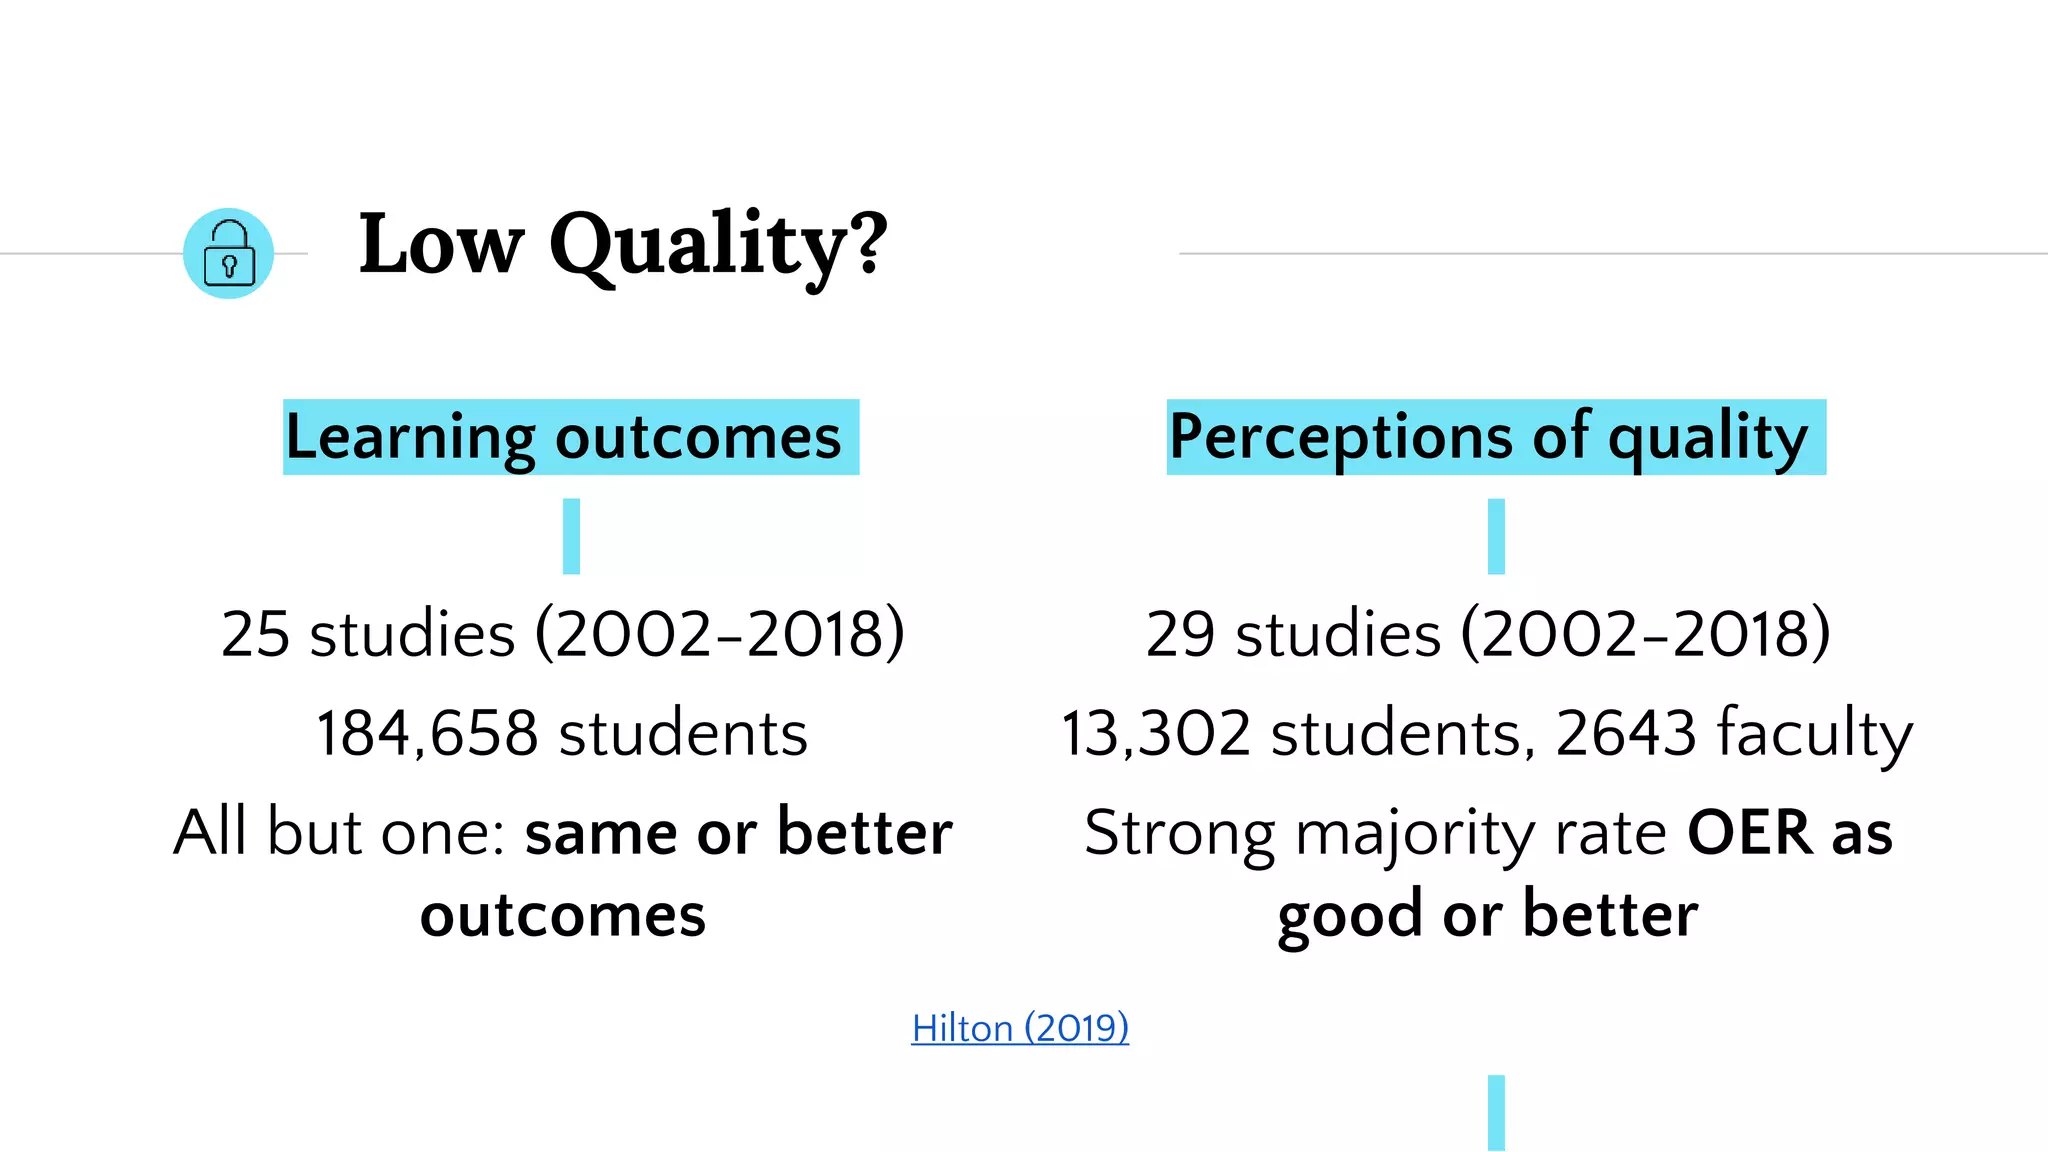
Report
Education
Slides for a talk at the Justice Institute of British Columbia in November 2019, designed to introduce open educational resources. PowerPoint slides available: https://is.gd/oerjibc2019
1. Getting started with OER: What, Why,
and Some Mythbusting
Christina Hendricks, UBC
Professor of Teaching
Academic Director, Centre for Teaching, Learning & Technology
JIBC Open Education Showcase, Nov. 2019
Except for elements licensed otherwise, these slides are licensed CC BY-SA 4.0
4. Open as in Free of Cost
Open as in cost Libros Libres, by
Alan Levine, licensed
CC BY 2.0, Flickr
5. Open like a museum
Open like a museum
A Day at the
Museum 2, by
Robert Couse-Baker,
licensed CC BY 2.0,
Flickr
6. 5 R’s of open
content
◉ Reuse
◉ Revise
◉ Remix
◉ Redistribute
◉ Retain
Open Content Definition by David Wiley; Creative Commons Logo from CC Downloads
7. Open Edu Resources
“Open Educational Resources (OER) are
teaching, learning and research materials in
any medium – digital or otherwise – that
reside in the public domain or have been
released under an open license that permits
no-cost access, use, adaptation and
redistribution by others with no or limited
restrictions.” (UNESCO)
OER logo by Markus Büsges for Wikimedia Deutschland, licensed CC BY-SA 4.0, Wikimedia Commons
8. Other openness
Adapted from Hodgkinson-Williams (2014)
Technical Inclusive/Accessible Pedagogical/Open
Edu Practices
Open formats;
technical skills
needed
Diverse ways of knowing Collaborative &
experiential; connecting to
wider community
Availability,
discovery
Digital accessibility,
Inclusive/Universal Design
Contribution to knowledge,
not just consumption
10. Rising cost of textbooks
Source: US Bureau of Labor
Statistics
Textbook costs
College tuition
& fees
Housing at
school
11. BC students
JIBC LESD
(2019)
60% Didn’t buy a required textbook because of cost
UBC
(2018)
66% Have gone w/o required texts in a course b/c of
cost (rarely, sometimes, often or frequently; 32%:
often or frequently)
BC
(2015)
54% Didn’t purchase a required textbook at least once in
the past 12 months because of cost
JIBC: Daddey 2019; UBC: AMS Undergraduate Experience Survey 2018; BC: Jhangiani & Jhangiani (2017)
12. Equity
◉ Increased access financially
◉ Better learning, retention
◉ Accessibility of resources
○ E.g., OER accessibility toolkit
◉ Students contributing to
public knowledge
14. PHYS 100 at UBC
94% The readings were customized to this particular
course: somewhat or very important
92% The textbook didn’t cost any money: somewhat or
very important
Hendricks, C., Reinsberg, S. A., & Rieger, G. W. (2017)
16. Low Quality?
Learning outcomes
25 studies (2002-2018)
184,658 students
All but one: same or better
outcomes
Perceptions of quality
29 studies (2002-2018)
13,302 students, 2643 faculty
Strong majority rate OER as
good or better
Hilton (2019)
18. Resources ≠ education
Research suggests better course completion,
retention (Fischer et al. 2015; Wiley et al. 2016; Hilton et al.
2016)
Lose students?
Chemistry
Building at UBC
Vancouver,
public domain,
Wikimedia
Commons
21. Useful resources
◉ Annotated bibliography of multiple studies showing the efficacy of
open textbooks: the Open Ed Group Review Project
◉ College Libraries Ontario OER Toolkit
◉ BCcampus Faculty OER Toolkit
◉ BCcampus OER by Discipline Directory (frequently updated with
new items)
◉ Rebus Community Guide to Making Open Textbooks with Students
22. References
Fischer, L., Hilton III, J., Robinson, J., & Wiley, D. A. (2015). A multi-institutional study of the
impact of open textbook adoption on the learning outcomes of post-secondary students—
Springer. Journal of Computing in Higher Education, 27(3), 159–172.
https://doi.org/10.1007/s12528-015-9101-x
Hendricks, C., Reinsberg, S. A., & Rieger, G. W. (2017). The Adoption of an open textbook in a
large physics course: An analysis of cost, outcomes, use, and perceptions. The International
Review of Research in Open and Distributed Learning, 18(4). Retrieved from
http://www.irrodl.org/index.php/irrodl/article/view/3006
Hilton, J. (2019). Open educational resources, student efficacy, and user perceptions: A
synthesis of research published between 2015 and 2018. Educational Technology Research and
Development. https://doi.org/10.1007/s11423-019-09700-4
23. References cont’d
Hilton III, J. L., Fischer, L., Wiley, D., & William, L. (2016). Maintaining Momentum Toward Graduation:
OER and the Course Throughput Rate. The International Review of Research in Open and Distributed
Learning, 17(6). Retrieved from http://www.irrodl.org/index.php/irrodl/article/view/2686
Hodgkinson-Williams, C. (2014, June 25). Degrees of ease: Adoption of OER, open textbooks and
MOOCs in the Global South. Presented at the OER Asia Symposium 2014. Retrieved from
https://open.uct.ac.za/handle/11427/1188
Jhangiani, R. S., & Jhangiani, S. (2017). Investigating the perceptions, use, and impact of open textbooks:
A survey of post-secondary students in British Columbia. The International Review of Research in
Open and Distributed Learning, 18(4). Retrieved from
http://www.irrodl.org/index.php/irrodl/article/view/3012
Wiley, D., Williams, L., DeMarte, D., & Hilton, J. (2016). The Tidewater Z-Degree and the INTRO model
for sustaining OER adoption. Education Policy Analysis Archives, 24(0), 41.
https://doi.org/10.14507/epaa.24.1828
24. Credits
Special thanks to the people who made and released these
resources:
◉ Presentation template (Viola) by SlidesCarnival, licensed
CC BY 4.0
◉ Icons purchased with a subscription to The Noun
Project
Editor's Notes
Jan 2006-July 2016 Consumer Price Index
https://www.investopedia.com/terms/c/consumerpriceindex.asp
“The Consumer Price Index (CPI) is a measure that examines the weighted average of prices of a basket of consumer goods and services, such as transportation, food, and medical care. It is calculated by taking price changes for each item in the predetermined basket of goods and averaging them. Changes in the CPI are used to assess price changes associated with the cost of living; the CPI is one of the most frequently used statistics for identifying periods of inflation or deflation.”
“The CPI measures the average change in prices over time that consumers pay for a basket of goods and services, commonly known as inflation.”
UBC: AMS Academic Experience Survey 2018 results
Over 2200 undergrads in sample reporting the following:
43% report experiencing financial hardship related to tuition & other expenses
44% report spending $500 or more per year on textbooks; mean spend per year is $760
38% report worrying about how to pay for books & other course materials (down from 43% last year, and 44% 2016)
16% report might need to abandon studies at UBC for financial reasons
66% they have gone without a textbook in course due to cost (54% at least sometimes; 32% often or frequently.
Jhangiani, R. S., & Jhangiani, S. (2017). Investigating the Perceptions, Use, and Impact of Open Textbooks: A survey of Post-Secondary Students in British Columbia. The International Review of Research in Open and Distributed Learning, 18(4).
Spring 2015, Summer 2015, and Fall 2015 semesters. “The final sample consisted of 320 undergraduate students enrolled in 19 courses at 12 B.C. post- secondary institutions that had adopted an open textbook.”
54% Didn’t purchase a required textbook at least once in past 12 months
27% Took fewer courses b/c of cost of materials: rarely, sometimes, often or very often
26% Didn’t take a particular course b/c of cost of materials: rarely, sometimes, often or very often
“When asked about how the cost of textbooks had influenced their course enrolment and persistence, 27% of respondents indicated that they had taken fewer courses, 26% had not registered for a course, and 17% reported dropping or withdrawing from a course, all at least once. … those who reported working more hours per week were more likely to drop or withdraw from a course due to the cost of textbooks”
Thirty percent of respondents reported earning a poorer grade in a course because of textbook costs. These individuals were more likely to self-identify as a member of a visible minority group … , and be working more hours per week ....”
JIBC Law Enforcement Studies Diploma cohort from 2017 (Presentation at CNIE 2019; slides shared with me)
Qualitative Research - 2017/2018 & 2018/2019
Survey Link: 68 of 250 (30%) Students Responded
60% of respondents said it was difficult or somewhat difficult to afford textbooks each semester.
Approximately 60% worked between 11–30 hours per week and complete a full course load.
85% strongly agreed or agreed that they liked the choices offered by open textbooks to access materials in different formats.
When asked about how they redirected their cost-savings, students provided responses that fell into a few common themes:
Paying for tuition towards next semesters courses
Buying learning equipment like laptops
Paying for living expenses - rent
Transportation – gas and transit
Eliminate Financial and Emotional Stress
Replacing Car Accessories including Battery
Taking Driving Lessons
Gym Membership
Paying Debts (to eliminates financial stress)
Volunteering: Contributing to local communities
If the resource isn’t accessible already, you can fix that
143 respondents who took PHYS 100 in Fall 2015 or Spring 2016
2016-2017 survey results (226 respondents)
very or somewhat important:
●No cost: 91%
●Access anywhere w/internet connection: 89%
●Customized: 88%
●Didn’t have to carry heavy textbook: 81%
Caveat on perceptions:
“... at the end of 2018, twenty-nine studies of student and faculty perceptions of OER have been published. These studies involve 13,302 students and 2643 faculty members. Every study that has asked those who have used both OER and CT as primary learning resources to directly compare the two has shown that a strong majority of participants report that OER are as good or better. In the five studies in which the ratings of students using CT were compared with the ratings of students who used OER, two studies found higher ratings for CT, two reported higher ratings for OER and one showed similar ratings.” (Hilton, 2014)
Still, “consistent survey data show that both faculty and students who use OER largely rate it as being equal to or superior to CT…”
Hilton, J. (2019). Open educational resources, student efficacy, and user perceptions: A synthesis of research published between 2015 and 2018. Educational Technology Research and Development. https://doi.org/10.1007/s11423-019-09700-4
Screen shot from an unnamed publisher website
Open licenses mean retaining copyright in your own work, ability to re-use the work, send it to others, etc. (not true for all commercial publishing agreements)
Can repost on any website
Can send to students, make as many copies as you or they like
Can send to colleagues
Fischer, L., Hilton III, J., Robinson, J., & Wiley, D. A. (2015). A multi-institutional study of the impact of open textbook adoption on the learning outcomes of post-secondary students—Springer. Journal of Computing in Higher Education, 27(3), 159–172. https://doi.org/10.1007/s12528-015-9101-x
“The initial data set consisted of 4128 students enrolled in undergraduate courses from the following 4-year colleges: Chadron State College, Mercy College, Peru, and Pittsburg State University. There were also 12,599 students enrolled in the following community colleges: Middlesex Community College, Middle Valley Community College, Onondaga Community College, Santa Ana Community College, Salt Lake Community College, and Tompkins Cortland Community College. Courses included a wide range of content including mathematics, English, psychology, biology, chemistry, business, history, education and developmental courses. Only 15 courses included sections in which either OER (treatment) or commercial textbooks (control) were used. … The initial sample included 4909 students in the treatment condition with 11,818 in the control condition.”
“When comparing the groups within each course in terms of completion, the pattern across the 15 courses showed almost no significant differences. In two courses, Business 110 and Biology 111, students in the treatment condition showed a significantly higher rate of completion than students in the control condition. In the case of Business 110, the differences in withdrawal rates were quite clear; 21 % of students in the commercial textbook condition withdrew from the course while only 6 % of students in the OER condition withdrew from the course”
“he differences in enrollment intensity between the control and treatment groups are likely a function of affordability. Students whose faculty assign OER save a significant amount of money compared to students whose faculty assign commercial textbooks. Some treatment students will chose to reinvest these savings by taking an additional course in order to accelerate their graduation. Consequently, we would expect members of the treatment group to take more credits than the control group, on average.”
“Even when controlling for differences in previous enrollment, students in courses using OER enrolled in a significantly higher number of credits in the next semester. This may be due to the cost savings associated with OER. In community college settings where tuition costs are based directly on the number of credits taken with no cap on costs for “full-time” enrollment, funds saved on textbooks can be applied directly to enrollment in additional courses.”
Wiley, D., Williams, L., DeMarte, D., & Hilton, J. (2016). The Tidewater Z-Degree and the INTRO Model for Sustaining OER Adoption. Education Policy Analysis Archives, 24(0), 41. https://doi.org/10.14507/epaa.24.1828
“If some percentage of students are registering for fewer courses (in which case the institution collects no tuition) or dropping courses (in which case the institution refunds tuition) because of textbook costs, then eliminating textbook costs by adopting OER might encourage students to enroll in more courses and/or drop fewer courses.”
Tidewater Community College Z-degree: associate of science degree in business administration
Drop rate for courses in Z-degree in 2013, 2014: 2.8%
Drop rate for sections of same courses not in Z degree & using commercial resources: 3.6%
Hilton III, J. L., Fischer, L., Wiley, D., & William, L. (2016). Maintaining Momentum Toward Graduation: OER and the Course Throughput Rate. The International Review of Research in Open and Distributed Learning, 17(6). Retrieved from http://www.irrodl.org/index.php/irrodl/article/view/2686
“we compared students using traditional textbooks with those using OER at Tidewater Community College to compare their performance on what we call course throughput rates, which is an aggregate of three variables - drop rates, withdrawal rates, and C or better rates. Two self-selecting cohorts were compared over four semesters, with statistically significant results. The study found that, subject to the limitations discussed, students who use OER perform significantly better on the course throughput rate than their peers who use traditional textbooks, in both face-to-face and online courses that use OER.”
“Data for this case study were drawn from the Tidewater Community College institutional research database in Fall 2013, Spring 2014, Fall 2014, and Spring 2015. Data included the drop rates, withdrawal rates, and final grades in courses with non-Z and Z sections in the same semester.”
A recipe? People adapting to their own needs, sharing back
Scholarly research & knowledge practices?
* Building on what others have done, adding your own, citing them…