Montecito Community Microgrid: Renewables-driven resilience for critical facilities (2/20/18)
•Download as PPTX, PDF•
0 likes•39 views

Craig Lewis, Executive Director for the Clean Coalition, was a panelist at the Rebuilding Montecito: Pathways to a Resilient Future event, which took place on February 20, 2018 in Santa Barbara, CA.

Recommended
Recommended
More Related Content
What's hot
What's hot (20)
Similar to Montecito Community Microgrid: Renewables-driven resilience for critical facilities (2/20/18)
Similar to Montecito Community Microgrid: Renewables-driven resilience for critical facilities (2/20/18) (20)
More from Clean Coalition
More from Clean Coalition (12)
Recently uploaded
Recently uploaded (20)
Montecito Community Microgrid: Renewables-driven resilience for critical facilities (2/20/18)
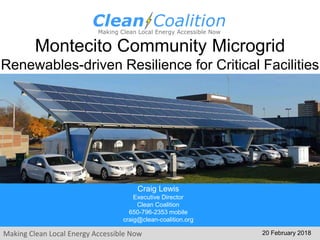
- 1. Making Clean Local Energy Accessible Now Montecito Community Microgrid Renewables-driven Resilience for Critical Facilities 20 February 2018 Craig Lewis Executive Director Clean Coalition 650-796-2353 mobile craig@clean-coalition.org
- 2. Making Clean Local Energy Accessible Now 2 Clean Coalition (non-profit) Mission To accelerate the transition to renewable energy and a modern grid through technical, policy, and project development expertise
- 3. Making Clean Local Energy Accessible Now 3 Community Microgrids = the Grid of the Future Key features: • A targeted and coordinated local grid area served by one or more distribution substations • High penetrations of local renewables and other Distributed Energy Resources (DER) such as energy storage and demand response • Staged capability for ongoing renewables-driven power backup for critical and prioritized loads across the grid area • A solution that can be readily extended throughout a utility service territory – and replicated into any utility service territory around the world A Community Microgrid is a new approach for designing and operating the electric grid, stacked with local renewables and staged for resilience.
- 4. Making Clean Local Energy Accessible Now 4 Community Microgrid key stakeholders Community Microgrid Financiers Solution Providers Utility Property Owners & Tenants Municipalities Residents
- 5. Making Clean Local Energy Accessible Now 5 Solar Siting Survey (SSS) for Montecito
- 6. Making Clean Local Energy Accessible Now 6 Montecito Community Microgrid map view
- 7. Making Clean Local Energy Accessible Now 7 Hot Springs Feeder is the key to success
- 8. Making Clean Local Energy Accessible Now 8 Montecito Community Microgrid block diagram Transmission Santa Barbara Substation Diagram Elements Autonomously Controllable Microgrid Relay/Switch (open, closed) North of 101 South of 101 Other Tier 1 Loads Montecito Country Club Vons cluster CVS Four Seasons Coral Casino Athletic Club Event Center Cemetery Sanitary District Music Academy Tier 2 & 3 Loads Tier 2 & 3 Loads Tier 2 & 3 Loads
- 9. Making Clean Local Energy Accessible Now 9 Montecito SSS summary Solar Siting Survey Summary by Structures Summary by Structure Types Count Count kW_Total PV W_AC >= 250 kW > and >= 100 kW Less than 100 kW Roof_Flat kW_Total Roof_Angled kW_Total Pkg_Lot kW_Total Sites Structures Structures Structures Structures Totals: 33 107 11,251 kW 11 4,223 kW 28 4,380 kW 68 2,648 kW 24 936 kW 18 256 kW 65 10,059 kW Solar Siting Survey Summary by Sites Count kW_Total PV W_AC >= 500 kW > and >= 100 kW Less than 100 kW Sites Sites Sites Sites Totals: 33 11,251 kW 7 6,948 kW 14 3,606 kW 12 697 kW Solar Siting Survey Aggregate Facilities Summary Aggregation TypeSummary by Aggregation Type: PV at All Sites Count kW_Total PV W_AC >= 500 kW > and >= 100 kW Less than 100 kW Airport - - - - - - - - Lodging 1 916 1 916 - - - - Biz 1 931 1 931 - - - - Edu 4 3,275 2 2,697 2 578 - - Shopping 2 2,224 2 2,224 - - - - Storage - - - - - - - - Venue 1 370 - - 1 370 - - - - - - - - - - Totals: 9 7,716 kW 6 6,768 kW 3 948 kW - - kW Aggregation Type Montecito Community Microgrid has solar siting potential of 4.6 MW, over 40% of the total Montecito SSS findings; of which about 90% is on parking lots.
- 10. Making Clean Local Energy Accessible Now 10 Vons cluster
- 11. Making Clean Local Energy Accessible Now 11 Coast Village strip
- 12. Making Clean Local Energy Accessible Now 12 Four Seasons cluster
- 13. Making Clean Local Energy Accessible Now 13 Sanitation District and Music Academy cluster
- 14. Making Clean Local Energy Accessible Now 14 Athletic Club and Event Center cluster
- 15. Making Clean Local Energy Accessible Now 15 Montecito Country Club
- 16. Making Clean Local Energy Accessible Now 16 SSS for Montecito Country Club
- 17. Making Clean Local Energy Accessible Now 17 Ecoplexus project at the Valencia Gardens Apartments in SF. ~800 kW meeting ~80% of the total annual load. Peek at the Community Microgrid future
- 18. Making Clean Local Energy Accessible Now 18 Backup Slides Backup Slides
- 19. Making Clean Local Energy Accessible Now 19 Montecito SSS Showing SCE Substations
- 20. Making Clean Local Energy Accessible Now 20 Hot Springs Feeder via Santa Barbara Substation Santa Barbara Substation Montecito Substation
- 21. Making Clean Local Energy Accessible Now 21 Helena & Hot Springs Feeder details Circuit Name HOT SPRINGS Voltage (kV) 16.00 Substation SANTA BARBARA 66/16 kV System Goleta 220/66 System Existing Generation (MW) 0.30 Queued Generation (MW) 0.00 Total Generation (MW) 0.30 Projected Load (MW) 10.74 Current Penetration Level (%) 2.75 Maximum Remaining Generation Capacity (MW) 12.90 15% Penetration Capacity (MW) 1.32 Deliverability Note Interconnection studies in this area have identified adequate deliverability. Circuit Name STANWOOD Voltage (kV) 16.00 Substation SANTA BARBARA 66/16 kV System Goleta 220/66 System Existing Generation (MW) 0.92 Queued Generation (MW) 0.00 Total Generation (MW) 0.93 Projected Load (MW) 13.20 Current Penetration Level (%) 7.01 Maximum Remaining Generation Capacity (MW) 12.27 15% Penetration Capacity (MW) 1.05 Deliverability Note Interconnection studies in this area have identified adequate deliverability.
- 22. Making Clean Local Energy Accessible Now 22 Santa Barbara & Montecito Substation details Substation Santa Barbara 66/16 kV System Goleta 220/66 System Existing Generation (MW) 3.78 Queued Generation (MW) 1.31 Total Generation (MW) 5.09 Projected Load (MW) 58.60 Current Penetration Level (%) 8.68 Maximum Remaining Generation Capacity (MW) 78.91 Deliverability Note Interconnection studies in this area have identified adequate deliverability. Substation Montecito 16/4.16 kV System Goleta 220/66 System Existing Generation (MW) 0.38 Queued Generation (MW) 0.06 Total Generation (MW) 0.44 Projected Load (MW) 4.80 Current Penetration Level (%) 9.14 Maximum Remaining Generation Capacity (MW) 5.57 Deliverability Note Interconnection studies in this area have identified adequate deliverability.
- 23. Making Clean Local Energy Accessible Now 23 SSS for Westmont College