SlideShare a Scribd company logo
1 of 52
Download to read offline
Making Clean Local Energy Accessible Now
Goleta Load Pocket Community Microgrid
& Direct Relief Showcase
Craig Lewis
Executive Director
650-796-2353 mobile
craig@clean-coalition.org
6 February 2020
Making Clean Local Energy Accessible Now 2
Clean Coalition (non-profit)
Mission
To accelerate the transition to renewable
energy and a modern grid through
technical, policy, and project
development expertise.
Renewable Energy End-Game
100% renewable energy; 25% local,
interconnected within the distribution grid
and ensuring resilience without
dependence on the transmission grid; and
75% remote, fully dependent on the
transmission grid for serving loads.
Making Clean Local Energy Accessible Now 3
Community Microgrids are the grid of the future
A Community Microgrid is a new approach for designing and
operating the electric grid, stacked with local renewables and
staged for resilience.
Key features:
• A targeted and coordinated distribution grid area served by one
or more substations – ultimately including a transmission-
distribution substation that sets the stage for Distribution
System Operator (DSO) performance.
• Ability to utilize existing distribution grid infrastructure to serve
the Community Microgrid during broader grid outages
• High penetrations of local renewables and other distributed
energy resources (DER) such as energy storage and demand
response.
• Staged capability for indefinite renewables-driven backup
power for critical community facilities across the grid area –
achieved by 25% local renewables mix.
• A solution that can be readily extended throughout a utility
service territory – and replicated into any utility service territory
around the world.
Making Clean Local Energy Accessible Now 4
Natural gas infrastructure is not resilient
• Assertion: Gas-driven generation is
often claimed to be resilient.
• Reality: Gas infrastructure is not resilient
and takes much longer to restore than
electricity infrastructure.
• Threats: Gas infrastructure can be flat-
out dangerous and highly vulnerable to
earthquakes, fires, landslides, and
terrorism.
0 0 0 0
2.5
5
10
30
65
100
5
25
60
95
97 98.5 100 100 100 100
1
DAY
2
DAYS
3
DAYS
1
W
EEK
2
W
EEKS
3
W
EEKS
1
M
ONTH
2
M
ONTHS
3
M
ONTHS
6
M
ONTHS
Potential Service Restoration
Timeframes (M7.9 Earthquake)
Gas Electricity
60% electric
customers
restored in 3
days.
60% gas restoration
takes 30 times longer
than electricity
Source: The City and County of San Francisco Lifelines Study2010 San Bruno Pipeline Explosion
Making Clean Local Energy Accessible Now 5
Value of Resilience (VOR) depends on tier of load
• Everyone understands there is significant value to resilience provided by indefinite renewables-
driven backup power
• But, nobody has yet to quantify this value of unparalleled resilience.
• Hence, there is an economic gap for innovative Community Microgrid projects while learning is still is
the early stages.
• The Clean Coalition aims to establish standardized Value of Resilience (VOR) for critical, priority,
and discretionary loads that will help everyone understand that premiums are appropriate for
indefinite renewables-driven backup power of critical loads and almost constant backup power
to priority loads, which yields a configuration that delivers backup power to all loads a lot of
the time
• The Clean Coalition’s VOR approach will establish
standardized values for resilience of three tiers of
loads:
• Tier 1 are mission-critical and life-sustaining loads,
crucial to keep operational at all times, including during grid outages.
Tier 1 loads usually
represent about 10% of the total load.
• Tier 2 are priority loads that should be maintained as long as long as
doing so does not threaten the ability to maintain Tier 1 loads. Tier 2
loads are usually about 15% of the total load.
• Tier 3 are discretionary loads make up the remaining loads, usually
about 75% of the total load, and are maintained when doing so does
not threaten the ability to maintain Tier 1 & 2 loads.
Making Clean Local Energy Accessible Now 6
0
10
20
30
40
50
60
70
80
90
100
0 10 20 30 40 50 60 70 80 90 100
Tier 1 = Critical load, ~10% of total load
Percentageoftotalload
Percentage of time
Tier 3 = Discretionary load, ~75% of total load
Tier 1 = Critical, life-sustaining load, ~10% of total load
Tier 2 = Priority load, ~15% of total load
Percentage of time online for Tier 1, 2, and 3 loads for
net zero solar + 2 hours storage microgrids at UCSB
Making Clean Local Energy Accessible Now 7
Goleta Load Pocket (GLP)
The GLP is the perfect opportunity for a comprehensive Community Microgrid
• GLP spans 70 miles of California coastline, from Point Conception to Lake Casitas,
encompassing the cities of Goleta, Santa Barbara (including Montecito), and Carpinteria.
• GLP is highly transmission-vulnerable and disaster-prone (fire, landslide, earthquake).
• 200 megawatts (MW) of solar and 400 megawatt-hours (MWh) of energy storage will
provide 100% protection to GLP against a complete transmission outage (“N-2 event”).
• 200 MW of solar is equivalent to about 5 times the amount of solar currently deployed in the GLP and
represents about 25% of the energy mix.
• Multi-GWs of solar siting opportunity exists on commercial-scale built-environments like parking lots,
parking structures, and rooftops; and 200 MW represents about 7% of the technical siting potential.
• Other resources like energy efficiency, demand response, and offshore wind can significantly reduce
solar+storage requirements.
Making Clean Local Energy Accessible Now 8
GLP grid layout
Goleta
Substation
Isla Vista Substation
Vegas Substation
Santa Barbara Substation
Carpinteria Substation
San Marcos Substation
Making Clean Local Energy Accessible Now 9
GLP grid outage zones
Making Clean Local Energy Accessible Now 10
SCE-proposed & CPUC-approved energy storage
280 MWh (70 MW x 4-hour) of energy storage has been formally proposed by SCE to
the CPUC for siting within the GLP, with online dates by March 2021
Source: SCE LCR RFP April 22, 2019
= within the GLP
Making Clean Local Energy Accessible Now 11
Community Microgrid key stakeholders
Community Microgrid
FinanciersSolution
Providers
Utilities
Property
OwnersMunicipalities
Residents
Philanthropic
Funders
Policymakers
Making Clean Local Energy Accessible Now 12
Montecito Upper Village building block
Making Clean Local Energy Accessible Now 13
Upper Village Community Microgrid block diagram
Santa
Barbara
Substation
Tier 2 &
3 Loads
Diagram Elements
Autonomously controllable microgrid
relay/switch (open, closed) Montecito Fire
District
Southern
Portion
Montecito
Union School
Coast Village
Community Microgrid
Montecito
Water District
Hot Springs
Feeder (16kV)
Centrally controllable smart customer
meter relay/switch (open, closed)
Making Clean Local Energy Accessible Now 14
City of Calistoga area & fire threat map
Making Clean Local Energy Accessible Now 15
PG&E Resilience Zones = Community Microgrids
Source: PG&E, Jul2019
• PG&E is planning for a
Resilience Zone powered
by 7 MW of diesel
generators.
• These diesel generators
could be replaced by
local solar and storage.
Making Clean Local Energy Accessible Now 16
Redwood Coast Airport Microgrid (RCAM)
Making Clean Local Energy Accessible Now 17
RCAM key features
• Seamless grid isolation switch that islands the Community Microgrid
without any electricity service interruption to any of the 20 customers.
• 2 MW of solar and 8 MWh of storage that are DC-coupled front-of-
meter (FOM). The FOM solar+storage assets are owned by the
Redwood Coast Energy Authority (RCEA), a Community Choice agency.
• 250 kW of behind-the-meter (BTM) solar.
• Bank of 8 Level-2 EV charging ports in a BTM configuration that is load
controllable, including sheddable.
• Full PG&E control of the distribution grid at all times.
• All RCAM assets, both FOM & BTM, controlled by asset owners during
normal grid operations and by PG&E for master control during
Community Microgrid islanding operations.
• New tariff and business model innovations.
Making Clean Local Energy Accessible Now 18
Solar Microgrids coming to Santa Barbara schools
Making Clean Local Energy Accessible Now 19
Deckers has 2+ MW of more solar siting potential
Making Clean Local Energy Accessible Now 20
Direct Relief & SBA grid area
Goleta Substation
Direct Relief
Vegas Substation
Santa Barbara Airport
UCSB
Sanitary District
Isla Vista Substation
Making Clean Local Energy Accessible Now 21
Vegas Substation - Serving Goleta and Noleta
Direct Relief (middle of the
Goleta area of the GLP)
“Vegas” substation
Vegas Substation serves much of the City of Goleta
and Unincorporated Santa Barbara County. Vegas’s
circuits, including “Wasp”, “Storke”, “Tecolote”,
“Cachuma”, and “Gaucho” stretch from the top of
the Santa Ynez Mtns. to the ocean and power the
airport, Old Town, and the commercial and
residential areas between Turnpike and Las
Carneros.
Direct Relief is on the Gaucho circuit.
Making Clean Local Energy Accessible Now 22
Vegas Substation - Serving Goleta and Noleta
The Vegas Substation powers multiple feeder circuits across the Goleta Load Pocket.
Currently 5.24MW of generation is connected to these circuits. Another nearly 42MW of
additional generation can be connected to the Vegas Substation.
Gaucho
Tecolote
Storke
Wasp Cachuma
Making Clean Local Energy Accessible Now 23
Gaucho Circuit powers many critical facilities
Major Cargo Facility
Airport Main
Terminal
Sanitary District
Food and Supplies
Senior Community
School and District
Headquarters
Downtown Goleta
and Civic Center
Direct Relief
Making Clean Local Energy Accessible Now 24
Professor Feeder powers many critical sites
SBA runway lights,
control tower, Fire
Station #8Deckers
Apeel and
Karl Storz
Commercial
Cluster
Raytheon
30 MW of solar siting potential on rooftops and parking lots throughout the Professor Feeder
Isla Vista
Substation
Direct ReliefProposed AltaGas
40MW battery
project
Making Clean Local Energy Accessible Now 25
Significant operational flexibility in the Deckers area
Apeel and Karl Storz
(3+ MW of potential)
Commercial Cluster
(20+ MW of potential)
Isla Vista Substation
Deckers
(2+ MW of potential)
SBA
Operational flexibility is identified as a certain number of
Megawatts (MW) of generation that could be interconnected at a
specific feeder section without requiring a study to determine
integration capacity.
Camino Real Shopping
Center (7+ MW of potential)
City of Goleta government
office and commercial
buildings (+5 MW of potential)
Making Clean Local Energy Accessible Now 26
Direct Relief is served by the Gaucho Feeder
Gaucho Feeder
The Gaucho Feeder
traverses over 2 miles from
the Vegas Substation to the
Direct Relief Microgrid.
Vegas Substation
Direct Relief
Making Clean Local Energy Accessible Now 27
Direct Relief offers a microgrid showcase
320 kW PV
676 kWh Li
600 kW diesel
generator with
4,000 gallon tank
• Resilience is #1 concern:
• 320 kW PV
• 676 kWh Storage
• 600 kW diesel
generator
• 4000 gallons of diesel
fuel
• PV annual generation
designed to cover annual
consumption.
• Storage designed to time-
shift the generation to more
valuable times, and provide
Resilience.
• Genset provides “back-up to
the back-up”.
• Direct Relief Microgrid
requirement is that the
critical loads are operational
indefinitely, even through
local disasters that causes
long-term interruptions to
normal electricity service.
Making Clean Local Energy Accessible Now 28
Obsolete Regulations = Stranded Opportunity
Microgrid only serves
Direct Relief needs:
• 70% of roof and 100% of
massive parking area
solar potential is unused.
• Additional storage not
able to be considered due
to policy prohibitions
around exporting energy
from a battery to the grid
– even though the energy
is 100% stored solar.
Ready to do way more::
• 1,133 kW in total solar
siting potential, 427 kW
more rooftop and 386 kW
in parking lots.
• Existing switch gear is
already sized for the
expansion and is just
awaiting the policy
innovation!
Making Clean Local Energy Accessible Now 29
Strong solar day results in net zero energy
Strong Solar Day
Grid Consumption
Storage Charging
(from solar) Solar Export to Grid
(demand charges are
naturally minimized)
Storage Discharge
Making Clean Local Energy Accessible Now 30
Weak Solar Day
Site Load
Storage Charging
(from solar)
Storage Discharging
(time shifted solar
avoids expensive
evening energy &
demand changes too)
Weak solar day results in net imports
Making Clean Local Energy Accessible Now 31
Worst Solar
Day of 2019
Site Load
Battery Charging
(from solar)
Storage Discharge
avoids peak pricing
Worst solar day still covers most critical loads
Making Clean Local Energy Accessible Now 32
0
10
20
30
40
50
60
70
80
90
100
0 10 20 30 40 50 60 70 80 90 100
Tier 1 = Critical load, ~10% of total load
Percentageoftotalload
Percentage of time
Tier 3 = Discretionary load, ~75% of total load
Tier 1 = Critical, life-sustaining load, ~10% of total load
Tier 2 = Priority load, ~15% of total load
Percentage of time online for Tier 1, 2, and 3 loads for
net zero solar + 2 hours storage microgrids at UCSB
Making Clean Local Energy Accessible Now 33
Economic comparison: Solar Microgrid vs none
Edison kWh
Edison
Annual
Spend
Solar
kWh
Microgrid
Annual
Spend
Year Total
Spend
Blended
Rate/kWh
No
Microgrid
889,693 $132,564 0 0 $132,564 $0.149
Microgrid 406,193 $67,209 483,500 $83,850 $153,059 $0.172
Current annual cost of indefinite resilience: $20,495
Direct Relief initially pays $0.023/kWh for indefinite resilience for
critical loads but this premium will disappear with SCE increases
Microgrid cost includes $0.10/kWh PPA + $37,500 annual battery lease
Making Clean Local Energy Accessible Now 34
Solar Production and Facility Consumption Comparison
Total Consumption and PV Production Overlay
Total consumption: 406,193 kWh
54% solar, 46% grid
2019 Solar production = 483,500 kWh 2019
Equal to 54% of the amount of total
electricity consumed by Direct Relief
Making Clean Local Energy Accessible Now 35
The Future “Microgrid Showcase”
● An additional 1+MW of PV and >2MWh of storage at Direct
Relief is both physically possible and fully practical.
● The solar-siting opportunity that Direct Relief represents a
significant foundation for the generation and resiliency resources
needed for the Goleta Community Microgrid. These resources
can be interconnected into the existing distribution
infrastructure without stressing the grid or requiring system
upgrade.
● Only an outdated and restrictive sustainable energy
interconnection and operations paradigm prevents the project
from moving forward.
Making Clean Local Energy Accessible Now 36
Microgrid can be doubled to achieve net zero
● Direct Relief could use another equivalently sized microgrid to
offset the 406 MWh/year it currently imports from the grid.
○ This is allowed under net metering and would achieve net zero at Direct Relief.
○ Expanded EV charging would support even more additional solar capacity while
maintaining net zero.
Making Clean Local Energy Accessible Now 37
Economic Projection with 2x Microgrid
Edison kWh
Edison
Annual
Spend
Solar
kWh
Microgrid
Annual
Spend
Year Total
Spend
Blended
Rate/kWh
No
Microgrid
889,693 $132,564 0 0 $132,564 $0.149
2x
Microgrid
-77,307 -$3,392 967,000 $149,695 $146,603 $0.152
With a 2x sized Microgrid, Annual Cost for “Indefinite
Resiliency”: ~$12,000 (less than $0.01/kWh)
Increased resilience and net zero energy facility
Expanded microgrid cost at $0.07/kWh solar and $2,500/month storage.
Notes: Reflects credit scheme for net exports, and additional EV charging would increase load.
Making Clean Local Energy Accessible Now 38
0
10
20
30
40
50
60
70
80
90
100
0 10 20 30 40 50 60 70 80 90 100
Tier 1 = Critical load, ~10% of total load
Percentageoftotalload
Percentage of time
Tier 3 = Discretionary load, ~75% of total load
Tier 1 = Critical, life-sustaining load, ~10% of total load
Tier 2 = Priority load, ~15% of total load
Percentage of time online for Tier 1, 2, and 3 loads for
net zero solar + 2 hours storage microgrids at UCSB
Making Clean Local Energy Accessible Now 39
Backup Slides
Backup Slides
Making Clean Local Energy Accessible Now 40
Microgrid System Financing & Economics
Without Microgrid: (only buying power from SCE)
● Direct Relief’s annual electricity cost: $132,564
○ $67,209 spent on “Generation” (kWh)
○ $65,355 spent on “Power” (demand charges)
With Microgrid: $0.10/kWh solar, and storage cost of
$3,125/month + remaining electricity purchased from SCE
● The Microgrid cost them $85,850
○ $48,253 for 483,500 kWh @ $.1/kWh
○ $37,800/year in Energy Storage cost.
● Direct Relief ALSO spent $67,209 in charges from Edison.
● Direct Relief TOTAL electricity spend in 2019 was $153,262
Making Clean Local Energy Accessible Now 41
Direct Relief EV charging infrastructure (EVCI)
EV Charging at Direct Relief:
• 12 EV charging units installed: 6 dedicated for
employees, 6 available to “guests”.
• Metering of EV charging is not currently
monetized
• Almost 10% the 140 parking spots are configured
for EV charging.
Charger Make and Model:
• SemaConnect model 620 Commercial “Fast
Chargers”.
• 7kW (30amp, 240v)
• Can be monitored / monetized
• If all 12 EV chargers are used simultaneously, the
EV peak load would be about 84kW
Making Clean Local Energy Accessible Now 42
Direct Relief EVCI in prime parking spots
Making Clean Local Energy Accessible Now 43
Future “Microgrid Show-Case”
Existing Plans are a Good Start:
• “Power Center” for community use during PSPS
• Charge cell phones, portable batteries, EVs...
Future Plans are Ground Breaking:
• Community Microgrid Building Block.
• GLP needs 200MW/400MWh - Direct Relief alone can provide a
meaningful contribution to these totals.
• The recently upgraded infrastructure in the area facilitates the potential
for a local Community Microgrid with only minimum grid upgrades.
• Vegas Substation alone supplies power to a large area that would benefit
from significant further solar-driven resilience.
Direct Relief is already doing what it can to support its local community.
Making Clean Local Energy Accessible Now 44
Residential Solar Microgrid initiative
Making Clean Local Energy Accessible Now 45
Carpinteria High School
Making Clean Local Energy Accessible Now 46
VESR is on the Seacliff circuit
Carpinteria
High School
with 3 MW
of solar siting
potential
Commercial cluster with
more than 10MW of
solar siting potential.
Legend
Seacliff Feeder (16 kV)
Other Carpinteria Substation Feeders
Carpinteria Substation
VESR
Making Clean Local Energy Accessible Now 47
Carpinteria critical sites
Making Clean Local Energy Accessible Now 48
Carpinteria High School, Substation, and ORMAT
Battery
Making Clean Local Energy Accessible Now 49
Carpinteria High School solar potential – 3MW
Making Clean Local Energy Accessible Now 50
UCSB Community Microgrid – Area Map
Making Clean Local Energy Accessible Now 51
Solar Siting Survey (SSS) for Montecito
Making Clean Local Energy Accessible Now 52
Vallecito and Carpoil circuits serve downtown
Carpinteria
Vallecito Circuit Carpoil Circuit

More Related Content

What's hot

References-Book-LQ-3
References-Book-LQ-3References-Book-LQ-3
References-Book-LQ-3
Fabio Magnani
 
Corporate-Profile-Investors-2
Corporate-Profile-Investors-2Corporate-Profile-Investors-2
Corporate-Profile-Investors-2
Fabio Magnani
 
Citizens Solar Case Studies - CitiSuns V 4 projects - 12.30.16
Citizens Solar Case Studies - CitiSuns V 4 projects - 12.30.16Citizens Solar Case Studies - CitiSuns V 4 projects - 12.30.16
Citizens Solar Case Studies - CitiSuns V 4 projects - 12.30.16
Emma Kosciak
 
Colgreen North Shore presentation-7.26.12
Colgreen North Shore presentation-7.26.12Colgreen North Shore presentation-7.26.12
Colgreen North Shore presentation-7.26.12
Graeme Donaldson
 
Colgreen North Shore presentation-1.8a.13
Colgreen North Shore presentation-1.8a.13Colgreen North Shore presentation-1.8a.13
Colgreen North Shore presentation-1.8a.13
Graeme Donaldson
 
Case Study - NCC Sportsground 2
Case Study - NCC Sportsground 2Case Study - NCC Sportsground 2
Case Study - NCC Sportsground 2
Andrew Mears
 

What's hot (20)

Wind energy outlook in latin america
Wind energy outlook in latin americaWind energy outlook in latin america
Wind energy outlook in latin america
 
Matt Baker invVEST Smart Grid Panel
Matt Baker invVEST Smart Grid PanelMatt Baker invVEST Smart Grid Panel
Matt Baker invVEST Smart Grid Panel
 
Wind energy market and opportunities in mexico
Wind energy market and opportunities in mexicoWind energy market and opportunities in mexico
Wind energy market and opportunities in mexico
 
References-Book-LQ-3
References-Book-LQ-3References-Book-LQ-3
References-Book-LQ-3
 
The Community Microgrid Initiative: The path to resilience and sustainability
The Community Microgrid Initiative: The path to resilience and sustainabilityThe Community Microgrid Initiative: The path to resilience and sustainability
The Community Microgrid Initiative: The path to resilience and sustainability
 
Corporate-Profile-Investors-2
Corporate-Profile-Investors-2Corporate-Profile-Investors-2
Corporate-Profile-Investors-2
 
Painel 3 – Chilean Case Study: Marine Energy Roadmap
Painel 3 – Chilean Case Study: Marine Energy RoadmapPainel 3 – Chilean Case Study: Marine Energy Roadmap
Painel 3 – Chilean Case Study: Marine Energy Roadmap
 
Community Microgrids: Optimizing economics, environment, & resilience (5/17/18)
Community Microgrids: Optimizing economics, environment, & resilience (5/17/18)Community Microgrids: Optimizing economics, environment, & resilience (5/17/18)
Community Microgrids: Optimizing economics, environment, & resilience (5/17/18)
 
Citizens Solar Case Studies - CitiSuns V 4 projects - 12.30.16
Citizens Solar Case Studies - CitiSuns V 4 projects - 12.30.16Citizens Solar Case Studies - CitiSuns V 4 projects - 12.30.16
Citizens Solar Case Studies - CitiSuns V 4 projects - 12.30.16
 
Lisa capone2015masccc
Lisa capone2015mascccLisa capone2015masccc
Lisa capone2015masccc
 
Colgreen North Shore presentation-7.26.12
Colgreen North Shore presentation-7.26.12Colgreen North Shore presentation-7.26.12
Colgreen North Shore presentation-7.26.12
 
Colgreen North Shore presentation-1.8a.13
Colgreen North Shore presentation-1.8a.13Colgreen North Shore presentation-1.8a.13
Colgreen North Shore presentation-1.8a.13
 
GBF2014 - Rob Thornton - Flexible, Local, Resilient Energy Generation
GBF2014 - Rob Thornton - Flexible, Local, Resilient Energy GenerationGBF2014 - Rob Thornton - Flexible, Local, Resilient Energy Generation
GBF2014 - Rob Thornton - Flexible, Local, Resilient Energy Generation
 
Community Microgrids: The Path to Resilience and Sustainability (5/10/18)
Community Microgrids: The Path to Resilience and Sustainability (5/10/18)Community Microgrids: The Path to Resilience and Sustainability (5/10/18)
Community Microgrids: The Path to Resilience and Sustainability (5/10/18)
 
20040413 Platts Power Magazine High%20Desert%20Power%20Plant
20040413 Platts Power Magazine High%20Desert%20Power%20Plant20040413 Platts Power Magazine High%20Desert%20Power%20Plant
20040413 Platts Power Magazine High%20Desert%20Power%20Plant
 
2003 Platts Power magazine power plant of the year award
2003 Platts Power magazine power plant of the year award2003 Platts Power magazine power plant of the year award
2003 Platts Power magazine power plant of the year award
 
Liz Argo MAS2019
Liz Argo MAS2019Liz Argo MAS2019
Liz Argo MAS2019
 
Hydropower Electricity in Lebanon - MoEW 2012
Hydropower Electricity in Lebanon - MoEW 2012Hydropower Electricity in Lebanon - MoEW 2012
Hydropower Electricity in Lebanon - MoEW 2012
 
Case Study - NCC Sportsground 2
Case Study - NCC Sportsground 2Case Study - NCC Sportsground 2
Case Study - NCC Sportsground 2
 
Painel 3 – Ocean Energy: The British Experience
Painel 3 – Ocean Energy: The British ExperiencePainel 3 – Ocean Energy: The British Experience
Painel 3 – Ocean Energy: The British Experience
 

Similar to Goleta Load Pocket Community (GLPCM) Microgrid & Direct Relief Showcase

Concept of the Hagersvalle Energy ParkF[1]
Concept of the Hagersvalle Energy ParkF[1]Concept of the Hagersvalle Energy ParkF[1]
Concept of the Hagersvalle Energy ParkF[1]
Tomo Kalaba
 
What the duck curve tells us about managing a green grid
What the duck curve tells us about managing a green gridWhat the duck curve tells us about managing a green grid
What the duck curve tells us about managing a green grid
Andrew Gelston
 

Similar to Goleta Load Pocket Community (GLPCM) Microgrid & Direct Relief Showcase (20)

Community Microgrids: A resilient clean energy solution for cities
Community Microgrids: A resilient clean energy solution for citiesCommunity Microgrids: A resilient clean energy solution for cities
Community Microgrids: A resilient clean energy solution for cities
 
Montecito Community Microgrid: Renewables-driven resilience for critical faci...
Montecito Community Microgrid: Renewables-driven resilience for critical faci...Montecito Community Microgrid: Renewables-driven resilience for critical faci...
Montecito Community Microgrid: Renewables-driven resilience for critical faci...
 
Renewables-driven data centers
Renewables-driven data centersRenewables-driven data centers
Renewables-driven data centers
 
Concept of the Hagersvalle Energy ParkF[1]
Concept of the Hagersvalle Energy ParkF[1]Concept of the Hagersvalle Energy ParkF[1]
Concept of the Hagersvalle Energy ParkF[1]
 
CaLEAP Energy Strategies Workshop June 25, 2013
CaLEAP Energy Strategies Workshop June 25, 2013CaLEAP Energy Strategies Workshop June 25, 2013
CaLEAP Energy Strategies Workshop June 25, 2013
 
Chapter 5 Smart electrical grid , Smart City Summer Course, AUST, 2015
Chapter 5 Smart electrical grid , Smart City Summer Course, AUST, 2015Chapter 5 Smart electrical grid , Smart City Summer Course, AUST, 2015
Chapter 5 Smart electrical grid , Smart City Summer Course, AUST, 2015
 
Community Microgrids: Savings and resilience for local governments (1/25/18)
Community Microgrids: Savings and resilience for local governments (1/25/18)Community Microgrids: Savings and resilience for local governments (1/25/18)
Community Microgrids: Savings and resilience for local governments (1/25/18)
 
San Marcos High School Solar Microgrid
San Marcos High School Solar MicrogridSan Marcos High School Solar Microgrid
San Marcos High School Solar Microgrid
 
Energy Choices - Sept 17 2014
Energy Choices - Sept 17 2014Energy Choices - Sept 17 2014
Energy Choices - Sept 17 2014
 
AUROVILLE SMART MINI-GRID | PHASE 2
AUROVILLE SMART MINI-GRID | PHASE 2AUROVILLE SMART MINI-GRID | PHASE 2
AUROVILLE SMART MINI-GRID | PHASE 2
 
GloSho'14: Accessing the Water and Energy Markets of California - Michael Web...
GloSho'14: Accessing the Water and Energy Markets of California - Michael Web...GloSho'14: Accessing the Water and Energy Markets of California - Michael Web...
GloSho'14: Accessing the Water and Energy Markets of California - Michael Web...
 
Renewables...Storage...What's next?
Renewables...Storage...What's next?Renewables...Storage...What's next?
Renewables...Storage...What's next?
 
Unleashing local dispatchable solar
Unleashing local dispatchable solarUnleashing local dispatchable solar
Unleashing local dispatchable solar
 
D0462530
D0462530D0462530
D0462530
 
Chapter 1.ppt
Chapter 1.pptChapter 1.ppt
Chapter 1.ppt
 
Solar Across the U.S. - From AZ to NC
Solar Across the U.S. - From AZ to NCSolar Across the U.S. - From AZ to NC
Solar Across the U.S. - From AZ to NC
 
Byron Washom's Microgrid Guest Lecture
Byron Washom's Microgrid Guest LectureByron Washom's Microgrid Guest Lecture
Byron Washom's Microgrid Guest Lecture
 
Promoting Renewable Energy - Experience of Donor Partner - Ricardo Torres, DR...
Promoting Renewable Energy - Experience of Donor Partner - Ricardo Torres, DR...Promoting Renewable Energy - Experience of Donor Partner - Ricardo Torres, DR...
Promoting Renewable Energy - Experience of Donor Partner - Ricardo Torres, DR...
 
What the duck curve tells us about managing a green grid
What the duck curve tells us about managing a green gridWhat the duck curve tells us about managing a green grid
What the duck curve tells us about managing a green grid
 
North Bay Community Resilience Initiative: The Path to Resilience and Sustain...
North Bay Community Resilience Initiative: The Path to Resilience and Sustain...North Bay Community Resilience Initiative: The Path to Resilience and Sustain...
North Bay Community Resilience Initiative: The Path to Resilience and Sustain...
 

Recently uploaded

Corporate_Science-based_Target_Setting.pptx
Corporate_Science-based_Target_Setting.pptxCorporate_Science-based_Target_Setting.pptx
Corporate_Science-based_Target_Setting.pptx
arnab132
 
Principle of erosion control- Introduction to contouring,strip cropping,conto...
Principle of erosion control- Introduction to contouring,strip cropping,conto...Principle of erosion control- Introduction to contouring,strip cropping,conto...
Principle of erosion control- Introduction to contouring,strip cropping,conto...
ZAPPAC1
 
Joka \ Call Girls Service Kolkata - 450+ Call Girl Cash Payment 8005736733 Ne...
Joka \ Call Girls Service Kolkata - 450+ Call Girl Cash Payment 8005736733 Ne...Joka \ Call Girls Service Kolkata - 450+ Call Girl Cash Payment 8005736733 Ne...
Joka \ Call Girls Service Kolkata - 450+ Call Girl Cash Payment 8005736733 Ne...
HyderabadDolls
 

Recently uploaded (20)

2024-05-08 Composting at Home 101 for the Rotary Club of Pinecrest.pptx
2024-05-08 Composting at Home 101 for the Rotary Club of Pinecrest.pptx2024-05-08 Composting at Home 101 for the Rotary Club of Pinecrest.pptx
2024-05-08 Composting at Home 101 for the Rotary Club of Pinecrest.pptx
 
Introduction to heat waves and Heatwaves in Bangladesh.pptx
Introduction to heat waves and Heatwaves in Bangladesh.pptxIntroduction to heat waves and Heatwaves in Bangladesh.pptx
Introduction to heat waves and Heatwaves in Bangladesh.pptx
 
Corporate_Science-based_Target_Setting.pptx
Corporate_Science-based_Target_Setting.pptxCorporate_Science-based_Target_Setting.pptx
Corporate_Science-based_Target_Setting.pptx
 
Call Girl Service in Wardha 9332606886 HOT & SEXY Models beautiful and charm...
Call Girl Service in Wardha  9332606886 HOT & SEXY Models beautiful and charm...Call Girl Service in Wardha  9332606886 HOT & SEXY Models beautiful and charm...
Call Girl Service in Wardha 9332606886 HOT & SEXY Models beautiful and charm...
 
Jumping Scales and Producing peripheries.pptx
Jumping Scales and Producing peripheries.pptxJumping Scales and Producing peripheries.pptx
Jumping Scales and Producing peripheries.pptx
 
Call Girls Pimpri Chinchwad / 8250092165 Genuine Call girls with real Photos ...
Call Girls Pimpri Chinchwad / 8250092165 Genuine Call girls with real Photos ...Call Girls Pimpri Chinchwad / 8250092165 Genuine Call girls with real Photos ...
Call Girls Pimpri Chinchwad / 8250092165 Genuine Call girls with real Photos ...
 
Mira Road Reasonable Call Girls ,09167354423,Kashimira Call Girls Service
Mira Road Reasonable Call Girls ,09167354423,Kashimira Call Girls ServiceMira Road Reasonable Call Girls ,09167354423,Kashimira Call Girls Service
Mira Road Reasonable Call Girls ,09167354423,Kashimira Call Girls Service
 
Fuel Cells and Hydrogen in Transportation - An Introduction
Fuel Cells and Hydrogen in Transportation - An IntroductionFuel Cells and Hydrogen in Transportation - An Introduction
Fuel Cells and Hydrogen in Transportation - An Introduction
 
Principle of erosion control- Introduction to contouring,strip cropping,conto...
Principle of erosion control- Introduction to contouring,strip cropping,conto...Principle of erosion control- Introduction to contouring,strip cropping,conto...
Principle of erosion control- Introduction to contouring,strip cropping,conto...
 
Hertwich_EnvironmentalImpacts_BuildingsGRO.pptx
Hertwich_EnvironmentalImpacts_BuildingsGRO.pptxHertwich_EnvironmentalImpacts_BuildingsGRO.pptx
Hertwich_EnvironmentalImpacts_BuildingsGRO.pptx
 
Russian Escort Dubai 0503464457 Dubai Escorts
Russian Escort Dubai 0503464457 Dubai EscortsRussian Escort Dubai 0503464457 Dubai Escorts
Russian Escort Dubai 0503464457 Dubai Escorts
 
A Review on Integrated River Basin Management and Development Master Plan of ...
A Review on Integrated River Basin Management and Development Master Plan of ...A Review on Integrated River Basin Management and Development Master Plan of ...
A Review on Integrated River Basin Management and Development Master Plan of ...
 
FULL ENJOY Call Girls In Mahipalpur Delhi Contact Us 8377087607
FULL ENJOY Call Girls In Mahipalpur Delhi Contact Us 8377087607FULL ENJOY Call Girls In Mahipalpur Delhi Contact Us 8377087607
FULL ENJOY Call Girls In Mahipalpur Delhi Contact Us 8377087607
 
Joka \ Call Girls Service Kolkata - 450+ Call Girl Cash Payment 8005736733 Ne...
Joka \ Call Girls Service Kolkata - 450+ Call Girl Cash Payment 8005736733 Ne...Joka \ Call Girls Service Kolkata - 450+ Call Girl Cash Payment 8005736733 Ne...
Joka \ Call Girls Service Kolkata - 450+ Call Girl Cash Payment 8005736733 Ne...
 
Only Cash On Delivery Call Girls Service In Kanpur 🧿 6378878445 🧿 High Class...
Only Cash On Delivery Call Girls Service In Kanpur  🧿 6378878445 🧿 High Class...Only Cash On Delivery Call Girls Service In Kanpur  🧿 6378878445 🧿 High Class...
Only Cash On Delivery Call Girls Service In Kanpur 🧿 6378878445 🧿 High Class...
 
Call Girls in Shadnagar / 8250092165 Genuine Call girls with real Photos and ...
Call Girls in Shadnagar / 8250092165 Genuine Call girls with real Photos and ...Call Girls in Shadnagar / 8250092165 Genuine Call girls with real Photos and ...
Call Girls in Shadnagar / 8250092165 Genuine Call girls with real Photos and ...
 
Test bank for beckmann and ling s obstetrics and gynecology 8th edition by ro...
Test bank for beckmann and ling s obstetrics and gynecology 8th edition by ro...Test bank for beckmann and ling s obstetrics and gynecology 8th edition by ro...
Test bank for beckmann and ling s obstetrics and gynecology 8th edition by ro...
 
Delivery in 20 Mins Call Girls Dungarpur 9332606886Call Girls Advance Cash O...
Delivery in 20 Mins Call Girls Dungarpur  9332606886Call Girls Advance Cash O...Delivery in 20 Mins Call Girls Dungarpur  9332606886Call Girls Advance Cash O...
Delivery in 20 Mins Call Girls Dungarpur 9332606886Call Girls Advance Cash O...
 
Top Call Girls in Bishnupur 9332606886 High Profile Call Girls You Can Get...
Top Call Girls in Bishnupur   9332606886  High Profile Call Girls You Can Get...Top Call Girls in Bishnupur   9332606886  High Profile Call Girls You Can Get...
Top Call Girls in Bishnupur 9332606886 High Profile Call Girls You Can Get...
 
Premium Call Girls Nashik Call Girls Service 👉📞 6378878445 👉📞 Just📲 Call Ruhi...
Premium Call Girls Nashik Call Girls Service 👉📞 6378878445 👉📞 Just📲 Call Ruhi...Premium Call Girls Nashik Call Girls Service 👉📞 6378878445 👉📞 Just📲 Call Ruhi...
Premium Call Girls Nashik Call Girls Service 👉📞 6378878445 👉📞 Just📲 Call Ruhi...
 

Goleta Load Pocket Community (GLPCM) Microgrid & Direct Relief Showcase

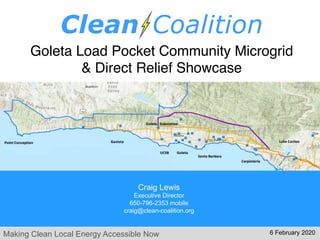
  • 1. Making Clean Local Energy Accessible Now Goleta Load Pocket Community Microgrid & Direct Relief Showcase Craig Lewis Executive Director 650-796-2353 mobile craig@clean-coalition.org 6 February 2020
  • 2. Making Clean Local Energy Accessible Now 2 Clean Coalition (non-profit) Mission To accelerate the transition to renewable energy and a modern grid through technical, policy, and project development expertise. Renewable Energy End-Game 100% renewable energy; 25% local, interconnected within the distribution grid and ensuring resilience without dependence on the transmission grid; and 75% remote, fully dependent on the transmission grid for serving loads.
  • 3. Making Clean Local Energy Accessible Now 3 Community Microgrids are the grid of the future A Community Microgrid is a new approach for designing and operating the electric grid, stacked with local renewables and staged for resilience. Key features: • A targeted and coordinated distribution grid area served by one or more substations – ultimately including a transmission- distribution substation that sets the stage for Distribution System Operator (DSO) performance. • Ability to utilize existing distribution grid infrastructure to serve the Community Microgrid during broader grid outages • High penetrations of local renewables and other distributed energy resources (DER) such as energy storage and demand response. • Staged capability for indefinite renewables-driven backup power for critical community facilities across the grid area – achieved by 25% local renewables mix. • A solution that can be readily extended throughout a utility service territory – and replicated into any utility service territory around the world.
  • 4. Making Clean Local Energy Accessible Now 4 Natural gas infrastructure is not resilient • Assertion: Gas-driven generation is often claimed to be resilient. • Reality: Gas infrastructure is not resilient and takes much longer to restore than electricity infrastructure. • Threats: Gas infrastructure can be flat- out dangerous and highly vulnerable to earthquakes, fires, landslides, and terrorism. 0 0 0 0 2.5 5 10 30 65 100 5 25 60 95 97 98.5 100 100 100 100 1 DAY 2 DAYS 3 DAYS 1 W EEK 2 W EEKS 3 W EEKS 1 M ONTH 2 M ONTHS 3 M ONTHS 6 M ONTHS Potential Service Restoration Timeframes (M7.9 Earthquake) Gas Electricity 60% electric customers restored in 3 days. 60% gas restoration takes 30 times longer than electricity Source: The City and County of San Francisco Lifelines Study2010 San Bruno Pipeline Explosion
  • 5. Making Clean Local Energy Accessible Now 5 Value of Resilience (VOR) depends on tier of load • Everyone understands there is significant value to resilience provided by indefinite renewables- driven backup power • But, nobody has yet to quantify this value of unparalleled resilience. • Hence, there is an economic gap for innovative Community Microgrid projects while learning is still is the early stages. • The Clean Coalition aims to establish standardized Value of Resilience (VOR) for critical, priority, and discretionary loads that will help everyone understand that premiums are appropriate for indefinite renewables-driven backup power of critical loads and almost constant backup power to priority loads, which yields a configuration that delivers backup power to all loads a lot of the time • The Clean Coalition’s VOR approach will establish standardized values for resilience of three tiers of loads: • Tier 1 are mission-critical and life-sustaining loads, crucial to keep operational at all times, including during grid outages. Tier 1 loads usually represent about 10% of the total load. • Tier 2 are priority loads that should be maintained as long as long as doing so does not threaten the ability to maintain Tier 1 loads. Tier 2 loads are usually about 15% of the total load. • Tier 3 are discretionary loads make up the remaining loads, usually about 75% of the total load, and are maintained when doing so does not threaten the ability to maintain Tier 1 & 2 loads.
  • 6. Making Clean Local Energy Accessible Now 6 0 10 20 30 40 50 60 70 80 90 100 0 10 20 30 40 50 60 70 80 90 100 Tier 1 = Critical load, ~10% of total load Percentageoftotalload Percentage of time Tier 3 = Discretionary load, ~75% of total load Tier 1 = Critical, life-sustaining load, ~10% of total load Tier 2 = Priority load, ~15% of total load Percentage of time online for Tier 1, 2, and 3 loads for net zero solar + 2 hours storage microgrids at UCSB
  • 7. Making Clean Local Energy Accessible Now 7 Goleta Load Pocket (GLP) The GLP is the perfect opportunity for a comprehensive Community Microgrid • GLP spans 70 miles of California coastline, from Point Conception to Lake Casitas, encompassing the cities of Goleta, Santa Barbara (including Montecito), and Carpinteria. • GLP is highly transmission-vulnerable and disaster-prone (fire, landslide, earthquake). • 200 megawatts (MW) of solar and 400 megawatt-hours (MWh) of energy storage will provide 100% protection to GLP against a complete transmission outage (“N-2 event”). • 200 MW of solar is equivalent to about 5 times the amount of solar currently deployed in the GLP and represents about 25% of the energy mix. • Multi-GWs of solar siting opportunity exists on commercial-scale built-environments like parking lots, parking structures, and rooftops; and 200 MW represents about 7% of the technical siting potential. • Other resources like energy efficiency, demand response, and offshore wind can significantly reduce solar+storage requirements.
  • 8. Making Clean Local Energy Accessible Now 8 GLP grid layout Goleta Substation Isla Vista Substation Vegas Substation Santa Barbara Substation Carpinteria Substation San Marcos Substation
  • 9. Making Clean Local Energy Accessible Now 9 GLP grid outage zones
  • 10. Making Clean Local Energy Accessible Now 10 SCE-proposed & CPUC-approved energy storage 280 MWh (70 MW x 4-hour) of energy storage has been formally proposed by SCE to the CPUC for siting within the GLP, with online dates by March 2021 Source: SCE LCR RFP April 22, 2019 = within the GLP
  • 11. Making Clean Local Energy Accessible Now 11 Community Microgrid key stakeholders Community Microgrid FinanciersSolution Providers Utilities Property OwnersMunicipalities Residents Philanthropic Funders Policymakers
  • 12. Making Clean Local Energy Accessible Now 12 Montecito Upper Village building block
  • 13. Making Clean Local Energy Accessible Now 13 Upper Village Community Microgrid block diagram Santa Barbara Substation Tier 2 & 3 Loads Diagram Elements Autonomously controllable microgrid relay/switch (open, closed) Montecito Fire District Southern Portion Montecito Union School Coast Village Community Microgrid Montecito Water District Hot Springs Feeder (16kV) Centrally controllable smart customer meter relay/switch (open, closed)
  • 14. Making Clean Local Energy Accessible Now 14 City of Calistoga area & fire threat map
  • 15. Making Clean Local Energy Accessible Now 15 PG&E Resilience Zones = Community Microgrids Source: PG&E, Jul2019 • PG&E is planning for a Resilience Zone powered by 7 MW of diesel generators. • These diesel generators could be replaced by local solar and storage.
  • 16. Making Clean Local Energy Accessible Now 16 Redwood Coast Airport Microgrid (RCAM)
  • 17. Making Clean Local Energy Accessible Now 17 RCAM key features • Seamless grid isolation switch that islands the Community Microgrid without any electricity service interruption to any of the 20 customers. • 2 MW of solar and 8 MWh of storage that are DC-coupled front-of- meter (FOM). The FOM solar+storage assets are owned by the Redwood Coast Energy Authority (RCEA), a Community Choice agency. • 250 kW of behind-the-meter (BTM) solar. • Bank of 8 Level-2 EV charging ports in a BTM configuration that is load controllable, including sheddable. • Full PG&E control of the distribution grid at all times. • All RCAM assets, both FOM & BTM, controlled by asset owners during normal grid operations and by PG&E for master control during Community Microgrid islanding operations. • New tariff and business model innovations.
  • 18. Making Clean Local Energy Accessible Now 18 Solar Microgrids coming to Santa Barbara schools
  • 19. Making Clean Local Energy Accessible Now 19 Deckers has 2+ MW of more solar siting potential
  • 20. Making Clean Local Energy Accessible Now 20 Direct Relief & SBA grid area Goleta Substation Direct Relief Vegas Substation Santa Barbara Airport UCSB Sanitary District Isla Vista Substation
  • 21. Making Clean Local Energy Accessible Now 21 Vegas Substation - Serving Goleta and Noleta Direct Relief (middle of the Goleta area of the GLP) “Vegas” substation Vegas Substation serves much of the City of Goleta and Unincorporated Santa Barbara County. Vegas’s circuits, including “Wasp”, “Storke”, “Tecolote”, “Cachuma”, and “Gaucho” stretch from the top of the Santa Ynez Mtns. to the ocean and power the airport, Old Town, and the commercial and residential areas between Turnpike and Las Carneros. Direct Relief is on the Gaucho circuit.
  • 22. Making Clean Local Energy Accessible Now 22 Vegas Substation - Serving Goleta and Noleta The Vegas Substation powers multiple feeder circuits across the Goleta Load Pocket. Currently 5.24MW of generation is connected to these circuits. Another nearly 42MW of additional generation can be connected to the Vegas Substation. Gaucho Tecolote Storke Wasp Cachuma
  • 23. Making Clean Local Energy Accessible Now 23 Gaucho Circuit powers many critical facilities Major Cargo Facility Airport Main Terminal Sanitary District Food and Supplies Senior Community School and District Headquarters Downtown Goleta and Civic Center Direct Relief
  • 24. Making Clean Local Energy Accessible Now 24 Professor Feeder powers many critical sites SBA runway lights, control tower, Fire Station #8Deckers Apeel and Karl Storz Commercial Cluster Raytheon 30 MW of solar siting potential on rooftops and parking lots throughout the Professor Feeder Isla Vista Substation Direct ReliefProposed AltaGas 40MW battery project
  • 25. Making Clean Local Energy Accessible Now 25 Significant operational flexibility in the Deckers area Apeel and Karl Storz (3+ MW of potential) Commercial Cluster (20+ MW of potential) Isla Vista Substation Deckers (2+ MW of potential) SBA Operational flexibility is identified as a certain number of Megawatts (MW) of generation that could be interconnected at a specific feeder section without requiring a study to determine integration capacity. Camino Real Shopping Center (7+ MW of potential) City of Goleta government office and commercial buildings (+5 MW of potential)
  • 26. Making Clean Local Energy Accessible Now 26 Direct Relief is served by the Gaucho Feeder Gaucho Feeder The Gaucho Feeder traverses over 2 miles from the Vegas Substation to the Direct Relief Microgrid. Vegas Substation Direct Relief
  • 27. Making Clean Local Energy Accessible Now 27 Direct Relief offers a microgrid showcase 320 kW PV 676 kWh Li 600 kW diesel generator with 4,000 gallon tank • Resilience is #1 concern: • 320 kW PV • 676 kWh Storage • 600 kW diesel generator • 4000 gallons of diesel fuel • PV annual generation designed to cover annual consumption. • Storage designed to time- shift the generation to more valuable times, and provide Resilience. • Genset provides “back-up to the back-up”. • Direct Relief Microgrid requirement is that the critical loads are operational indefinitely, even through local disasters that causes long-term interruptions to normal electricity service.
  • 28. Making Clean Local Energy Accessible Now 28 Obsolete Regulations = Stranded Opportunity Microgrid only serves Direct Relief needs: • 70% of roof and 100% of massive parking area solar potential is unused. • Additional storage not able to be considered due to policy prohibitions around exporting energy from a battery to the grid – even though the energy is 100% stored solar. Ready to do way more:: • 1,133 kW in total solar siting potential, 427 kW more rooftop and 386 kW in parking lots. • Existing switch gear is already sized for the expansion and is just awaiting the policy innovation!
  • 29. Making Clean Local Energy Accessible Now 29 Strong solar day results in net zero energy Strong Solar Day Grid Consumption Storage Charging (from solar) Solar Export to Grid (demand charges are naturally minimized) Storage Discharge
  • 30. Making Clean Local Energy Accessible Now 30 Weak Solar Day Site Load Storage Charging (from solar) Storage Discharging (time shifted solar avoids expensive evening energy & demand changes too) Weak solar day results in net imports
  • 31. Making Clean Local Energy Accessible Now 31 Worst Solar Day of 2019 Site Load Battery Charging (from solar) Storage Discharge avoids peak pricing Worst solar day still covers most critical loads
  • 32. Making Clean Local Energy Accessible Now 32 0 10 20 30 40 50 60 70 80 90 100 0 10 20 30 40 50 60 70 80 90 100 Tier 1 = Critical load, ~10% of total load Percentageoftotalload Percentage of time Tier 3 = Discretionary load, ~75% of total load Tier 1 = Critical, life-sustaining load, ~10% of total load Tier 2 = Priority load, ~15% of total load Percentage of time online for Tier 1, 2, and 3 loads for net zero solar + 2 hours storage microgrids at UCSB
  • 33. Making Clean Local Energy Accessible Now 33 Economic comparison: Solar Microgrid vs none Edison kWh Edison Annual Spend Solar kWh Microgrid Annual Spend Year Total Spend Blended Rate/kWh No Microgrid 889,693 $132,564 0 0 $132,564 $0.149 Microgrid 406,193 $67,209 483,500 $83,850 $153,059 $0.172 Current annual cost of indefinite resilience: $20,495 Direct Relief initially pays $0.023/kWh for indefinite resilience for critical loads but this premium will disappear with SCE increases Microgrid cost includes $0.10/kWh PPA + $37,500 annual battery lease
  • 34. Making Clean Local Energy Accessible Now 34 Solar Production and Facility Consumption Comparison Total Consumption and PV Production Overlay Total consumption: 406,193 kWh 54% solar, 46% grid 2019 Solar production = 483,500 kWh 2019 Equal to 54% of the amount of total electricity consumed by Direct Relief
  • 35. Making Clean Local Energy Accessible Now 35 The Future “Microgrid Showcase” ● An additional 1+MW of PV and >2MWh of storage at Direct Relief is both physically possible and fully practical. ● The solar-siting opportunity that Direct Relief represents a significant foundation for the generation and resiliency resources needed for the Goleta Community Microgrid. These resources can be interconnected into the existing distribution infrastructure without stressing the grid or requiring system upgrade. ● Only an outdated and restrictive sustainable energy interconnection and operations paradigm prevents the project from moving forward.
  • 36. Making Clean Local Energy Accessible Now 36 Microgrid can be doubled to achieve net zero ● Direct Relief could use another equivalently sized microgrid to offset the 406 MWh/year it currently imports from the grid. ○ This is allowed under net metering and would achieve net zero at Direct Relief. ○ Expanded EV charging would support even more additional solar capacity while maintaining net zero.
  • 37. Making Clean Local Energy Accessible Now 37 Economic Projection with 2x Microgrid Edison kWh Edison Annual Spend Solar kWh Microgrid Annual Spend Year Total Spend Blended Rate/kWh No Microgrid 889,693 $132,564 0 0 $132,564 $0.149 2x Microgrid -77,307 -$3,392 967,000 $149,695 $146,603 $0.152 With a 2x sized Microgrid, Annual Cost for “Indefinite Resiliency”: ~$12,000 (less than $0.01/kWh) Increased resilience and net zero energy facility Expanded microgrid cost at $0.07/kWh solar and $2,500/month storage. Notes: Reflects credit scheme for net exports, and additional EV charging would increase load.
  • 38. Making Clean Local Energy Accessible Now 38 0 10 20 30 40 50 60 70 80 90 100 0 10 20 30 40 50 60 70 80 90 100 Tier 1 = Critical load, ~10% of total load Percentageoftotalload Percentage of time Tier 3 = Discretionary load, ~75% of total load Tier 1 = Critical, life-sustaining load, ~10% of total load Tier 2 = Priority load, ~15% of total load Percentage of time online for Tier 1, 2, and 3 loads for net zero solar + 2 hours storage microgrids at UCSB
  • 39. Making Clean Local Energy Accessible Now 39 Backup Slides Backup Slides
  • 40. Making Clean Local Energy Accessible Now 40 Microgrid System Financing & Economics Without Microgrid: (only buying power from SCE) ● Direct Relief’s annual electricity cost: $132,564 ○ $67,209 spent on “Generation” (kWh) ○ $65,355 spent on “Power” (demand charges) With Microgrid: $0.10/kWh solar, and storage cost of $3,125/month + remaining electricity purchased from SCE ● The Microgrid cost them $85,850 ○ $48,253 for 483,500 kWh @ $.1/kWh ○ $37,800/year in Energy Storage cost. ● Direct Relief ALSO spent $67,209 in charges from Edison. ● Direct Relief TOTAL electricity spend in 2019 was $153,262
  • 41. Making Clean Local Energy Accessible Now 41 Direct Relief EV charging infrastructure (EVCI) EV Charging at Direct Relief: • 12 EV charging units installed: 6 dedicated for employees, 6 available to “guests”. • Metering of EV charging is not currently monetized • Almost 10% the 140 parking spots are configured for EV charging. Charger Make and Model: • SemaConnect model 620 Commercial “Fast Chargers”. • 7kW (30amp, 240v) • Can be monitored / monetized • If all 12 EV chargers are used simultaneously, the EV peak load would be about 84kW
  • 42. Making Clean Local Energy Accessible Now 42 Direct Relief EVCI in prime parking spots
  • 43. Making Clean Local Energy Accessible Now 43 Future “Microgrid Show-Case” Existing Plans are a Good Start: • “Power Center” for community use during PSPS • Charge cell phones, portable batteries, EVs... Future Plans are Ground Breaking: • Community Microgrid Building Block. • GLP needs 200MW/400MWh - Direct Relief alone can provide a meaningful contribution to these totals. • The recently upgraded infrastructure in the area facilitates the potential for a local Community Microgrid with only minimum grid upgrades. • Vegas Substation alone supplies power to a large area that would benefit from significant further solar-driven resilience. Direct Relief is already doing what it can to support its local community.
  • 44. Making Clean Local Energy Accessible Now 44 Residential Solar Microgrid initiative
  • 45. Making Clean Local Energy Accessible Now 45 Carpinteria High School
  • 46. Making Clean Local Energy Accessible Now 46 VESR is on the Seacliff circuit Carpinteria High School with 3 MW of solar siting potential Commercial cluster with more than 10MW of solar siting potential. Legend Seacliff Feeder (16 kV) Other Carpinteria Substation Feeders Carpinteria Substation VESR
  • 47. Making Clean Local Energy Accessible Now 47 Carpinteria critical sites
  • 48. Making Clean Local Energy Accessible Now 48 Carpinteria High School, Substation, and ORMAT Battery
  • 49. Making Clean Local Energy Accessible Now 49 Carpinteria High School solar potential – 3MW
  • 50. Making Clean Local Energy Accessible Now 50 UCSB Community Microgrid – Area Map
  • 51. Making Clean Local Energy Accessible Now 51 Solar Siting Survey (SSS) for Montecito
  • 52. Making Clean Local Energy Accessible Now 52 Vallecito and Carpoil circuits serve downtown Carpinteria Vallecito Circuit Carpoil Circuit