Community microgrids for renewables driven resilience
•
0 likes•95 views

Executive Director Craig Lewis presented at the Protecting Your City from Wildfire summit, which took place 11-12 March 2020 at the Crowne Plaza in San Diego, CA.

Recommended
Recommended
More Related Content
What's hot
What's hot (20)
Similar to Community microgrids for renewables driven resilience
Similar to Community microgrids for renewables driven resilience (20)
Recently uploaded
Recently uploaded (20)
Community microgrids for renewables driven resilience
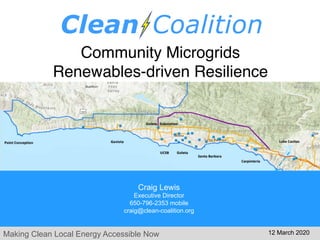
- 1. Making Clean Local Energy Accessible Now Community Microgrids Renewables-driven Resilience Craig Lewis Executive Director 650-796-2353 mobile craig@clean-coalition.org 12 March 2020
- 2. Making Clean Local Energy Accessible Now 2 Clean Coalition (non-profit) Mission To accelerate the transition to renewable energy and a modern grid through technical, policy, and project development expertise. Renewable Energy End-Game 100% renewable energy; 25% local, interconnected within the distribution grid and ensuring resilience without dependence on the transmission grid; and 75% remote, fully dependent on the transmission grid for serving loads.
- 3. Making Clean Local Energy Accessible Now 3 Community Microgrids are the grid of the future A Community Microgrid is a new approach for designing and operating the electric grid, stacked with local renewables and staged for resilience. Key features: • A targeted and coordinated distribution grid area served by one or more substations – ultimately including a transmission- distribution substation that sets the stage for Distribution System Operator (DSO) performance. • Ability to utilize existing distribution grid infrastructure to serve the Community Microgrid during broader grid outages • High penetrations of local renewables and other distributed energy resources (DER) such as energy storage and demand response. • Staged capability for indefinite renewables-driven backup power for critical community facilities across the grid area – achieved by 25% local renewables mix. • A solution that can be readily extended throughout a utility service territory – and replicated into any utility service territory around the world.
- 4. Making Clean Local Energy Accessible Now 4 Natural gas infrastructure is not resilient • Assertion: Gas-driven generation is often claimed to be resilient. • Reality: Gas infrastructure is not resilient and takes much longer to restore than electricity infrastructure. • Threats: Gas infrastructure can be flat- out dangerous and highly vulnerable to earthquakes, fires, landslides, and terrorism. 0 0 0 0 2.5 5 10 30 65 100 5 25 60 95 97 98.5 100 100 100 100 1 DAY 2 DAYS 3 DAYS 1 W EEK 2 W EEKS 3 W EEKS 1 M ONTH 2 M ONTHS 3 M ONTHS 6 M ONTHS Potential Service Restoration Timeframes (M7.9 Earthquake) Gas Electricity 60% electric customers restored in 3 days. 60% gas restoration takes 30 times longer than electricity Source: The City and County of San Francisco Lifelines Study2010 San Bruno Pipeline Explosion
- 5. Making Clean Local Energy Accessible Now 5 Value of Resilience (VOR) depends on tier of load • Everyone understands there is significant value to resilience provided by indefinite renewables- driven backup power • But, nobody has yet to quantify this value of unparalleled resilience. • Hence, there is an economic gap for innovative Community Microgrid projects while learning is still is the early stages. • The Clean Coalition aims to establish standardized Value of Resilience (VOR) for critical, priority, and discretionary loads that will help everyone understand that premiums are appropriate for indefinite renewables-driven backup power of critical loads and almost constant backup power to priority loads, which yields a configuration that delivers backup power to all loads a lot of the time • The Clean Coalition’s VOR approach will establish standardized values for resilience of three tiers of loads: • Tier 1 are mission-critical and life-sustaining loads, crucial to keep operational at all times, including during grid outages. Tier 1 loads usually represent about 10% of the total load. • Tier 2 are priority loads that should be maintained as long as long as doing so does not threaten the ability to maintain Tier 1 loads. Tier 2 loads are usually about 15% of the total load. • Tier 3 are discretionary loads make up the remaining loads, usually about 75% of the total load, and are maintained when doing so does not threaten the ability to maintain Tier 1 & 2 loads.
- 6. Making Clean Local Energy Accessible Now 6 0 10 20 30 40 50 60 70 80 90 100 0 10 20 30 40 50 60 70 80 90 100 Tier 1 = Critical load, ~10% of total load Percentageoftotalload Percentage of time Tier 3 = Discretionary load, ~75% of total load Tier 1 = Critical, life-sustaining load, ~10% of total load Tier 2 = Priority load, ~15% of total load Percentage of time online for Tier 1, 2, and 3 loads for net zero solar + 2 hours storage microgrid at UCSB
- 7. Making Clean Local Energy Accessible Now 7 Goleta Load Pocket (GLP) The GLP is the perfect opportunity for a comprehensive Community Microgrid • GLP spans 70 miles of California coastline, from Point Conception to Lake Casitas, encompassing the cities of Goleta, Santa Barbara (including Montecito), and Carpinteria. • GLP is highly transmission-vulnerable and disaster-prone (fire, landslide, earthquake). • 200 megawatts (MW) of solar and 400 megawatt-hours (MWh) of energy storage will provide 100% protection to GLP against a complete transmission outage (“N-2 event”). • 200 MW of solar is equivalent to about 5 times the amount of solar currently deployed in the GLP and represents about 25% of the energy mix. • Multi-GWs of solar siting opportunity exists on commercial-scale built-environments like parking lots, parking structures, and rooftops; and 200 MW represents about 7% of the technical siting potential. • Other resources like energy efficiency, demand response, and offshore wind can significantly reduce solar+storage requirements.
- 8. Making Clean Local Energy Accessible Now 8 SCE-proposed & CPUC-approved energy storage 280 MWh (70 MW x 4-hour) of energy storage has been formally proposed by SCE to the CPUC for siting within the GLP, with online dates by March 2021 Source: SCE LCR RFP April 22, 2019 = within the GLP
- 9. Making Clean Local Energy Accessible Now 9 Community Microgrids obviate gas peakers • Thanks in part to Clean Coalition analyses, California regulators blocked repowering of the Ellwood gas peaker in Goleta and constructing the massive Puente gas peaker in Oxnard. • “Let’s take this opportunity to move the Oxnard community into the clean energy future — which is here already.” Carmen Ramirez, Mayor of Oxnard • Significant opportunity to leverage this work to prevent future new gas plant proposals across the country
- 10. Making Clean Local Energy Accessible Now 10 Community Microgrids cheaper than gas peakers • Leveraging our technical and economic expertise, the Clean Coalition conducted an analysis to determine the viability of solar+storage as a better alternative
- 11. Making Clean Local Energy Accessible Now 11 UCSB Community Microgrid – Area Map
- 12. Making Clean Local Energy Accessible Now 12 Montecito Upper Village building block
- 13. Making Clean Local Energy Accessible Now 13 Upper Village Community Microgrid block diagram Santa Barbara Substation Tier 2 & 3 Loads Diagram Elements Autonomously controllable microgrid relay/switch (open, closed) Montecito Fire District Southern Portion Montecito Union School Coast Village Community Microgrid Montecito Water District Hot Springs Feeder (16kV) Centrally controllable smart customer meter relay/switch (open, closed)
- 14. Making Clean Local Energy Accessible Now 14 Community Microgrid key stakeholders Community Microgrid FinanciersSolution Providers Utilities Property OwnersMunicipalities Residents Philanthropic Funders Policymakers
- 15. Making Clean Local Energy Accessible Now 15 Solar Microgrids coming to Santa Barbara schools
- 16. Making Clean Local Energy Accessible Now 16 Redwood Coast Airport Microgrid (RCAM)
- 17. Making Clean Local Energy Accessible Now 17 RCAM key features • Seamless grid isolation switch that islands the Community Microgrid without any electricity service interruption to any of the 20 customers. • 2 MW of solar and 8 MWh of storage that are DC-coupled front-of- meter (FOM). The FOM solar+storage assets are owned by the Redwood Coast Energy Authority (RCEA), a Community Choice agency. • 250 kW of behind-the-meter (BTM) solar. • Bank of 8 Level-2 EV charging ports in a BTM configuration that is load controllable, including sheddable. • Full PG&E control of the distribution grid at all times. • All RCAM assets, both FOM & BTM, controlled by asset owners during normal grid operations and by PG&E for master control during Community Microgrid islanding operations. • New tariff and business model innovations.
- 18. Making Clean Local Energy Accessible Now 18 City of Calistoga area & fire threat map
- 19. Making Clean Local Energy Accessible Now 19 PG&E Resilience Zones = Community Microgrids Source: PG&E, Jul2019 • PG&E is planning for a Resilience Zone powered by 7 MW of diesel generators. • These diesel generators could be replaced by local solar and storage.
- 20. Making Clean Local Energy Accessible Now 20 Full GLP with SCE grid outage zones
- 21. Making Clean Local Energy Accessible Now 21 Core GLP with SCE grid layout & outage zones Goleta Substation Vegas Substation Santa Barbara Substation Carpinteria Substation San Marcos SubstationIsla Vista Substation Legend 220 kV Transmission 66 kV Distribution Low Voltage Distribution Substations
- 22. Making Clean Local Energy Accessible Now 22 Legend Goleta Substation has eight – 66kV feeders Goleta Substation has eight feeders, all 66kV, that serve the entire GLP Feeder #4157 Feeder #4156 Feeder #3556 Feeder #3559 Feeder #4169 Feeder #3565 Feeder #4227 Feeder #4311 220 kV Transmission Substations SCE Service Area
- 23. Making Clean Local Energy Accessible Now 23 Core load area of the GLP Legend 16kV Gladiola Feeder Substations 16kV Gaucho Feeder 16kV Professor FeederUCSB Santa Barbara Airport Tier 3 Fire Threat Tier 2 Fire Threat 220 kV Transmission Feeder #4157 Feeder #3556 Feeder #3559 Feeder #4169 Feeder #3565 Feeder #4227 Feeder #4311
- 24. Making Clean Local Energy Accessible Now 24 Target 66kV feeder area of the GLP Legend 16kV Gladiola Feeder Substations 16kV Gaucho Feeder 16kV Professor Feeder University of California Santa Barbara (UCSB) Santa Barbara AirportTier 3 Fire Threat Tier 2 Fire Threat 220 kV Transmission 66 kV Feeder #4311 Sanitary or Water Districts Goleta Substation Goleta Water District West Isla Vista Substation Vegas Substation San Marcos Substation Goleta Water District
- 25. Making Clean Local Energy Accessible Now 25 Core target 66kV feeder area of the GLP Legend 16kV Gladiola Feeder Substations 16kV Gaucho Feeder 16kV Professor Feeder University of California Santa Barbara Santa Barbara Airport Tier 3 Fire Threat 220 kV Transmission 66 kV Feeder #4311 Fire Stations Sanitary or Water Districts Proposed 160-240 MWh Battery Goleta Valley Cottage Hospital Direct Relief Fire Station # 17 Direct Relief Vegas Substation Isla Vista Substation Proposed 160-240 MWh Battery Fire Station # 8 Goleta Sanitary District Deckers
- 26. Making Clean Local Energy Accessible Now 26 Target 66kV feeder grid area block diagram Isla Vista Substation (66-to-16kV) Fire Station #17 66kV underground interconnection Vegas Substation (66-to-16kV) UCSB + Solar SBA (runway lights & ATC) Direct Relief + Solar Microgrid SBA (Main Terminal) Goleta Sanitary District Goleta Substation (220-to-66kV) Diagram Elements 66 kV Distribution Feeder #4311 16 kV Gladiola Feeder 16 kV Gaucho Feeder 16 kV Professor Feeder Planned 160-240 MWh Battery Grid isolation switch (open, closed) Smart meter switch (open, closed) Fire Station #8 66kV distribution feeder #4311 with multiple branches Deckers + Solar Microgrid Tier 2 & 3 facilities Tier 2 & 3 facilities Tier 2 & 3 facilities 160+ MWh battery Goleta Substation has eight feeders, all 66kV, that serve the entire GLP Tier 2 & 3 facilities
- 27. Making Clean Local Energy Accessible Now 27 Direct Relief offers a microgrid showcase 320 kW PV 676 kWh Li 600 kW diesel generator with 4,000 gallon tank • Resilience is #1 concern: • 320 kW PV • 676 kWh Storage • 600 kW diesel generator • 4000 gallons of diesel fuel • PV annual generation designed to cover annual consumption. • Storage designed to time- shift the generation to more valuable times, and provide Resilience. • Genset provides “back-up to the back-up”. • Direct Relief Microgrid requirement is that the critical loads are operational indefinitely, even through local disasters that causes long-term interruptions to normal electricity service.
- 28. Making Clean Local Energy Accessible Now 28 Obsolete Regulations = Stranded Opportunity Microgrid only serves Direct Relief needs: • 70% of roof and 100% of massive parking area solar potential is unused. • Additional storage not able to be considered due to policy prohibitions around exporting energy from a battery to the grid – even though the energy is 100% stored solar. Ready to do way more:: • 1,133 kW in total solar siting potential, 427 kW more rooftop and 386 kW in parking lots. • Existing switch gear is already sized for the expansion and is just awaiting the policy innovation!
- 29. Making Clean Local Energy Accessible Now 29 Strong solar day results is net zero energy Strong Solar Day Grid Consumption Storage Charging (from solar) Solar Export to Grid (demand charges are naturally minimized) Storage Discharge
- 30. Making Clean Local Energy Accessible Now 30 Weak Solar Day Site Load Storage Charging (from solar) Storage Discharging (time shifted solar avoids expensive evening energy & demand changes too) Weak solar day results in net imports
- 31. Making Clean Local Energy Accessible Now 31 Economic Projection with 2x Microgrid (all new) Edison kWh Edison Annual $ Solar kWh Microgrid Annual $ Total Annual $ Blended Rate/kWh No Microgrid 889,693 $132,564 0 0 $132,564 $0.149 2x Microgrid (old + new) -77,307 -$3,392 967,000 $149,695 $146,603 $0.152 2x Microgrid (all new) -77,307 -$3,392 967,000 $127,690 $124,298 $0.129 1. Expanded microgrid costs are estimated at about 30% reductions to the existing solar and storage, which were contracted in 2017. New costs assumed to be $0.07/kWh for solar (vs $0.10) and $2,500/month for the storage capacity currently deployed (vs $37,500). 2. The Net Energy Metering (NEM) credit scheme is applied to net exports. 3. Anticipated growth in EV charging will significantly increase load. Microgrid expansion saves $0.02/kWh vs SCE rates at the start, while saving more as SCE rates rise and providing indefinite solar-driven resilience for free.
- 32. Making Clean Local Energy Accessible Now 32 0 10 20 30 40 50 60 70 80 90 100 0 10 20 30 40 50 60 70 80 90 100 Tier 1 = Critical load, ~10% of total load Percentageoftotalload Percentage of time Tier 3 = Discretionary load, ~75% of total load Tier 1 = Critical, life-sustaining load, ~10% of total load Tier 2 = Priority load, ~15% of total load Percentage of time online for Tier 1, 2, and 3 loads for net zero solar + 2 hours storage microgrids at UCSB