

Recommended
Recommended
More Related Content
Similar to Hospice
Similar to Hospice (20)
Recently uploaded
Recently uploaded (20)
Hospice
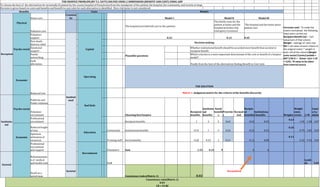
- 1. THE HOSPICE PROBLEM (BY T.L. SATY) SOLVED USING 2 DIMENSIONS (BENEFIT AND COST) USING AHP To choose the best of the alternatives for terminally ill patient by the county hospital of Pensylvania from the standpoint of the patient, the hospital, the community, and society at large. Decision is given based on costs and benefits and benefit to cost ratio for each alternative is identified . Here risk factor is not considered Benefits Costs Models Recepient Physical Direct care Commun ity Model 1 Model II Model III Palliative care The hospital provided full care to the patients The family cares for the patient at home and the hospital provides only emergency treatment The hospital and the home share patient care Formulas used : To make the matrix normalized the following steps were carried out Recipient Benefit Cell = Cell value/sum of that column Weight – average of each row WS = cell value of each criteria in the original matric * weight in each cell of the column(Weight sums vector) Consis/Lambda = WS*1/W CI = (λmax -n)/n-1 CR = CI/R,I RI value to be taken from external source Psycho-social Volunteer support Instituti onal Capital 0.43 0.12 0.45 Post death distress relief Decision making Emotional support Plausible questions Whether institutional benefit should be accorded more benefit than societal or recipient benefit Family networking Which criterion is a more important determinant of the cost or benefit of a hospice model? Guilt alleviation Finally from the best of the alternatives finding Benefit to Cost ratio Economic Reduced Cost Operating THE SOLUTION Bad Debt Matrix 1 -Judgment matrix for the criteria of the benefits hierarchy Institutio nal Psycho-social Publicity and Public relations Choosing best hospice Recipient benefits Institutio nal benefits Social benefit s Prioritie s Normali zed Recipie nt benefits Institutiona l benefits Weights Weight sums vector 1/W Consi s/La mbda Volunteer recruitment Professional recruitment Recipient benefits 1 3 5 0.64 0.65 0.69 0.63 1.94 1.58 3.07 Economic Reduced length of stay Education Community Institutional benefits 0.33 1 3 0.26 0.22 0.23 0.26 0.79 3.85 3.03 Optimum utilization of resources Training staff Social benefits 0.20 0.33 1 0.11 0.13 0.08 0.11 0.32 9.43 3.01 Professional recruitment and support Recruitment Volunteers Sum 1.53 4.33 9 1 1 Societal Rehumanizatio n of medical and health instt Staff Lamb da 3.03 Death as a social issue Societal Consistency index(Matrix 1) 0.02 Normalized Consistency ratio(Matrix 1) 0.03 CR = CI/RI
- 2. Matrix 2 -Judgment of subcriteria with respect to institutional benefits Normalized Matrix 2 -Judgment of subcriteria with respect to institutional benefits stitutional enefits Psycho- social Economic Priorities Institutional benefits Psycho- social Economic Weight s (W) WS 1/W Consis/L ambda sycho-social 1.00 7.00 0.88 Psycho-social 0.88 0.88 0.88 1.75 1.14 2 conomic 0.14 1.00 0.13 Economic 0.13 0.13 0.13 0.25 8.00 2 um 1.14 8 Sum 1.00 1.00 Lambda 2 Consistency index(Matrix 2) 0 atrix 3 -Relative benefits of the models with respect to direct care of patients Consistency ratio(Matrix 2) 0 Column Stochas tic irect care of atient Model I Model II Model III Priorities odel I: Unit am 1.00 5.00 3.00 0.64 Normalized Matrix 3 -Relative benefits of the models with respect to direct care of patients odel II: ixed/home are 0.20 1.00 0.33 0.10 Direct care of patient Model I Model II Model III Weights WS 1/W Consis/La mbda odel III: Case anagement 0.33 3.00 1.00 0.26 Model I: Unit team 0.65 0.56 0.69 0.63 1.95 1.58 3.07 um 1.53 9.00 4.33 Model II: Mixed/home care 0.13 0.11 0.08 0.11 0.32 9.42 3.01 Matrix 4 - Cost alternative decision Model III: Case management 0.22 0.33 0.23 0.26 0.79 3.84 3.03 Community Costs Institutional Costs Societal Costs Priorities Sum 1 1 1 Lambda 3.04 ommunity osts 1 0.20 1 0.14 Consistency index(Matrix 3) 0.02 stitutional osts 5 1 5 0.71 Consistency ratio(Matrix 3) 0.037 ocietal costs 1 0.20 1 0.14 Normalized um 7 1.4 7 Matrix 4 Community Costs Institutiona l Costs Societa l Costs Weights WS 1/W Consis/La mbda Community costs 0.14 0.14 0.14 0.14 0.42 7.00 2.97 Institutional costs 0.71 0.71 0.71 0.71 2.12 1.41 2.99 Societal costs 0.14 0.14 0.14 0.14 0.42 7.14 3.03 Consistency index(Matrix 4) 0.00 Lambda 3.00 atrix 5 - Finding the priority of the costs impacting the decision making Consistency ratio(Matrix 4) 0.00
- 3. Matrix 5 - Finding the priority of the costs impacting the decision making Institutional costs Capital Operating Educatio n Bad Debt Recruitment Priorities Normalized Institutio nal costs Capit al Operat ing Educatio n Bad Debt Recruit ment Weights 1/W Consis/ Lambda Capital 1 0.14 0.14 0.14 1 0.05 Capital 0.05 0.08 0.01 0.02 0.09 0.04 23.72 1.49 Operating 7 1.00 9.00 4.00 5 0.57 Operatin g 0.35 0.59 0.68 0.67 0.45 0.57 1.75 1.04 Education 4 0.11 1.00 0.50 1 0.01 Educatio n 0.20 0.07 0.08 0.08 0.09 0.11 9.41 0.73 Bad debt 7 0.25 2.00 1.00 3 0.21 Bad debt 0.35 0.15 0.15 0.17 0.27 0.20 4.90 0.83 Recruitmen t 1 0.20 1.00 0.33 1 0.07 Recruitm ent 0.05 0.12 0.08 0.06 0.09 0.07 13.37 1.28 Sum 20.00 1.70 13.14 5.98 11.00 Consiste ncy index(Ma trix 5) -0.73 1.07 Matrix 6 Finding the alternative from models with respect to recruitment under institutional cost Consiste ncy ratio(Mat rix 5) - 0.658 9511 05 = 0 Model I Model II Model III Priorities Normalized Model I Model II Model III Weights 1/W WS Consis/ Lambda Model I: Unit team 1.00 5.00 3.00 0.64 Model I: Unit team 0.65 0.56 0.69 0.63 1.58 1.95 3.07 Model II: Mixed/ho me care 0.20 1.00 0.33 0.10 Model II: Mixed/ho me care 0.13 0.11 0.08 0.11 9.42 0.32 3.01 Model III: Case manageme nt 0.33 3.00 1.00 0.26 Model III: Case manageme nt 0.22 0.33 0.23 0.26 3.84 0.79 3.03 Sum 1.53 9.00 4.33 Consistenc y index(Matr ix 6) 0.02 3.04 Consistenc y ratio(Matr ix 6) 0.03 Result Summary As discussed in the 1st slide
- 4. 0.02 0.64 0.01 0.10 0.00 0.26 0.01 0.64 1.00 0.02 0.16 0.41 0.14 0.64 0.09 0.10 0.01 0.26 0.04 0.64 1.00 0.14 0.16 0.41 0.02 0.09 0.00 0.17 0.00 0.74 0.01 0.74 0.12 0.27 0.02 1.00 0.06 0.46 0.03 0.22 0.01 0.32 0.02 0.46 1.00 0.06 0.34 0.70 0.12 0.30 0.04 0.08 0.01 0.62 0.07 0.62 0.48 0.13 0.12 1.00 0.21 0.30 0.06 0.08 0.02 0.62 0.13 0.62 0.48 0.13 0.21 1.00 0.03 0.30 0.01 0.08 0.00 0.62 0.02 0.62 0.48 0.13 0.03 1.00 0.01 0.12 0.00 0.65 0.01 0.23 0.00 0.65 0.18 1.02 0.01 0.35 0.03 0.12 0.00 0.27 0.01 0.61 0.02 0.61 0.20 0.42 0.03 1.00 0.19 0.63 0.12 0.08 0.02 0.29 0.06 0.63 1.00 0.12 0.13 0.46 0.03 0.64 0.02 0.10 0.00 0.26 0.01 0.64 1.00 0.02 0.16 0.41 0.06 0.65 0.04 0.23 0.01 0.12 0.01 0.65 1.00 0.04 0.36 0.18 0.01 0.26 0.00 0.10 0.00 0.64 0.01 0.64 0.41 0.16 0.01 1.00 0.02 0.09 0.00 0.22 0.00 0.69 0.01 0.69 0.13 0.34 0.02 1.00 0.000 0.73 0.00 0.08 0.00 0.19 0.00 0.73 1.00 0.00 0.13 0.26 0.02 0.20 0.00 0.20 0.00 0.60 0.01 0.60 0.33 0.31 0.02 1.00 0.08 0.24 0.02 0.14 0.01 0.62 0.05 0.62 0.39 0.22 0.08 1.00 0.14 0.33 0.33 0.33 1 1 1 0.03 0.76 0.09 0.15 1 0.12 0.2 0.4 0.73 0.08 0.19 1 0.11 0.26 0.01 0.65 0.24 0.11 1 0.37 0.17 0.06 0.56 0.32 0.12 1 0.57 0.21 0.15 0.6 0.2 0.2 1 0.33 0.33 0.05 0.66 0.17 0.17 1 0.26 0.26 0.01 0.6 0.2 Distributive mode Ideal Mode Models Priorities 1 1"" (Validating) 2 2""(Validating) 3 3"(Validating) MaxBenefits Synthesis Costs Synthesis 1 1" 2 2 " 3" 3 0.43 0.45 0.12 0.13 0.45 0.47 0.43 0.40 0.12 0.01 0.54 0.45 0.58 0.19 0.22 0.52 0.23 0.25 0.73 0.63 0.81 0.54 Direct care of patien Palliative care Volunteer support Networking in fami Relief of post death s Emotional support o f a p Alleviation of guilt Reduced economic c f p Improved productiv Publicity and public r Volunteer recruitme Professional recruit a s Reduced length of s Better utilization of r Increased monetary s Death as a social iss Rehumanization of i Community costs Institutional capital c Institutional operati c Institutional costs fo e t c Institutional costs fo t s Institutional bad de Institutional costs o r s Institutional costs o r v Societal costs Benefit/cost ratio 0.2 1 0.33 0.33 0.15 0.33 0.33 0.33 1 1 1 2.01 1.82 Distributive Mode - Existence of dependencies among criteria . Each row sums to 1considering the models The final synthesis happens by multiplying weights to priorities and adding the sum. Ideal Mode – One of the alternative is the best and is assigned a 1 and the rest is similar as in Distributive mode. Benefit and Cost are assessed and Benefit to Cost Ratio shows model 3 is better.