Colliers GTA Office Statistics Q1 2017
•
1 like•721 views

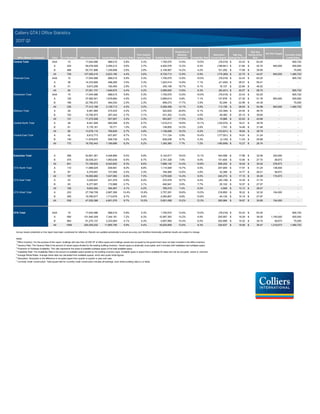
This document provides an overview of office market statistics for various submarkets in the Greater Toronto Area (GTA) for the first quarter of 2017. Key metrics reported include number of buildings, total office inventory, vacant space, vacancy rates, available space, absorption rates, and average asking rental rates. The Financial Core submarket had 94 buildings totaling 37 million square feet of office inventory, with a vacancy rate of 4.4% and average asking gross rent of $58.72 per square foot.

Recommended
More Related Content
Similar to Colliers GTA Office Statistics Q1 2017
Similar to Colliers GTA Office Statistics Q1 2017 (20)
More from Chris Fyvie
More from Chris Fyvie (20)
Recently uploaded
Recently uploaded (20)
Colliers GTA Office Statistics Q1 2017
- 1. Office Market / Submarket Class # of Buildings Office Inventory Vacant Space Vacancy Rate Prior Quarter Vacancy Rate Available Space Proportion of Sublease Availability Availability Rate Absorption Current Quarter Wgt Avg. Asking Net Rent Wgt Avg. Asking Gross Rent Net New Supply Currently Under Construction Central Total AAA 15 17,044,586 988,015 5.8% 5.3% 1,700,570 12.9% 10.0% (78,016) 33.43$ 63.25$ - 905,722 Central Total A 224 59,278,928 3,295,212 5.6% 3.7% 4,922,576 12.3% 8.3% (198,641) 21.64$ 42.70$ 940,000 500,000 Central Total B 489 50,731,896 1,339,958 2.6% 2.8% 2,106,567 14.2% 4.2% 101,292 17.69$ 35.95$ - 75,000 Central Total All 728 127,055,410 5,623,185 4.4% 3.6% 8,729,713 12.9% 6.9% (175,365) 22.75$ 44.67$ 940,000 1,480,722 Financial Core AAA 15 17,044,586 988,015 5.8% 5.3% 1,700,570 12.9% 10.0% (78,016) 33.43$ 63.25$ - 905,722 Financial Core A 38 14,333,895 498,206 3.5% 3.3% 1,023,414 14.8% 7.1% (21,492) 28.51$ 55.41$ - - Financial Core B 41 5,673,256 160,454 2.8% 3.1% 345,108 16.7% 6.1% 16,107 22.84$ 46.52$ - - Financial Core All 94 37,051,737 1,646,675 4.4% 4.2% 3,069,092 13.9% 8.3% (83,401) 30.57$ 58.72$ - 905,722 Downtown Total AAA 15 17,044,586 988,015 5.8% 5.3% 1,700,570 12.9% 10.0% (78,016) 33.43$ 63.25$ - 905,722 Downtown Total A 125 37,582,541 1,676,664 4.5% 2.4% 2,669,614 9.8% 7.1% 137,878 27.30$ 51.76$ 940,000 500,000 Downtown Total B 196 22,785,072 464,034 2.0% 2.3% 899,274 17.7% 3.9% 53,294 22.99$ 44.38$ - 75,000 Downtown Total All 336 77,412,199 3,128,713 4.0% 3.0% 5,269,458 12.1% 6.8% 113,156 28.93$ 54.98$ 940,000 1,480,722 Midtown Total A 29 6,481,685 270,533 4.2% 3.7% 522,625 20.8% 8.1% (33,394) 24.54$ 46.70$ - - Midtown Total B 102 10,790,973 287,424 2.7% 3.1% 431,202 13.4% 4.0% 49,360 20.10$ 39.65$ - - Midtown Total All 131 17,272,658 557,957 3.2% 3.3% 953,827 17.5% 5.5% 15,966 22.63$ 43.66$ - - Central North Total A 28 8,401,929 690,058 8.2% 6.7% 1,019,213 18.9% 12.1% (125,574) 19.21$ 39.78$ - - Central North Total B 61 5,176,181 79,771 1.5% 1.6% 136,855 14.3% 2.6% 1,743 14.46$ 31.46$ - - Central North Total All 89 13,578,110 769,829 5.7% 4.8% 1,156,068 18.3% 8.5% (123,831) 18.64$ 38.79$ - - Central East Total A 42 6,812,773 657,957 9.7% 7.1% 711,124 5.9% 10.4% (177,551) 14.91$ 31.24$ - - Central East Total B 130 11,979,670 508,729 4.2% 4.2% 639,236 9.7% 5.3% (3,105) 11.43$ 25.96$ - - Central East Total All 172 18,792,443 1,166,686 6.2% 5.2% 1,350,360 7.7% 7.2% (180,656) 13.27$ 28.74$ - - Suburban Total A 366 42,661,381 4,048,969 9.5% 9.9% 5,144,817 18.0% 12.1% 404,598 17.88$ 32.06$ 240,000 - Suburban Total B 475 30,538,241 1,993,636 6.5% 6.7% 2,751,328 7.6% 9.0% 101,604 13.94$ 27.70$ 38,673 - Suburban Total All 841 73,199,622 6,042,605 8.3% 8.6% 7,896,145 14.4% 10.8% 506,202 16.40$ 30.42$ 278,673 - GTA North Total A 110 11,686,025 939,991 8.0% 8.8% 1,114,948 14.7% 9.5% 207,904 17.57$ 31.24$ 136,000 - GTA North Total B 87 4,379,657 107,069 2.4% 2.3% 164,580 12.6% 3.8% 32,368 14.77$ 26.21$ 38,673 - GTA North Total All 197 16,065,682 1,047,060 6.5% 7.0% 1,279,528 14.4% 8.0% 240,272 17.15$ 30.49$ 174,673 - GTA East Total A 23 3,226,647 221,579 6.9% 6.2% 272,578 19.7% 8.4% (20,156) 14.30$ 31.74$ - - GTA East Total B 83 6,377,907 172,888 2.7% 3.1% 492,941 0.6% 7.7% 25,102 12.57$ 27.07$ - - GTA East Total All 106 9,604,554 394,467 4.1% 4.2% 765,519 7.4% 8.0% 4,946 13.12$ 28.57$ - - GTA West Total A 233 27,748,709 2,887,399 10.4% 10.9% 3,757,291 18.8% 13.5% 216,850 18.22$ 32.32$ 104,000 - GTA West Total B 305 19,780,677 1,713,679 8.7% 8.9% 2,093,807 8.8% 10.6% 44,134 14.19$ 27.97$ - - GTA West Total All 538 47,529,386 4,601,078 9.7% 10.0% 5,851,098 15.2% 12.3% 260,984 16.67$ 30.65$ 104,000 - GTA Total AAA 15 17,044,586 988,015 5.8% 5.3% 1,700,570 12.9% 10.0% (78,016) 33.43$ 63.25$ - 905,722 GTA Total A 590 101,940,309 7,344,181 7.2% 6.3% 10,067,393 15.2% 9.9% 205,957 19.29$ 36.05$ 1,180,000 500,000 GTA Total B 964 81,270,137 3,333,594 4.1% 4.3% 4,857,895 10.4% 6.0% 202,896 15.32$ 30.74$ 38,673 75,000 GTA Total All 1569 200,255,032 11,665,790 5.8% 5.4% 16,625,858 13.6% 8.3% 330,837 19.09$ 36.47$ 1,218,673 1,480,722 Survey results presented on this report have been condensed for reference. Results are updated periodically to ensure accuracy and therefore historically published results are subject to change. Notes: 1 Office Inventory: For the purpose of this report, buildings with less than 20,000 SF of office space and buildings owned and occupied by the government have not been included in the office inventory. 2 Vacancy Rate: The Vacancy Rate is the amount of vacant space divided by the existing building inventory. Vacant space is physically unoccupied, and it includes both headlease and sublease space. 3 Proportion of Sublease Availability: This ratio represents the share of available sublease space of the total available space. 4 Availability Rate: The Availability Rate is the amount of available space divided by the building inventory base. Available space is space that is available for lease and can be occupied, vacant or unknown. 5 Average Rental Rates: Average rental rates are calculated from available spaces, which also quote rental figures. 6 Absorption: Absorption is the difference in occupied space from quarter to quarter or year-over-year. 7 Currently Under Construction: Total square feet for currently under construction includes all buildings, even where building class is un-listed. Colliers GTA | Office Statistics 2017 Q1
- 2. Office Market / Submarket Class # of Buildings Office Inventory Vacant Space Vacancy Rate Prior Quarter Vacancy Rate Available Space Proportion of Sublease Availability Availability Rate Absorption Current Quarter Wgt Avg. Asking Net Rent Wgt Avg. Asking Gross Rent Net New Supply Currently Under Construction Financial Core AAA 15 17,044,586 988,015 5.8% 5.3% 1,700,570 12.9% 10.0% (78,016) 33.43$ 63.25$ - 905,722 Financial Core A 38 14,333,895 498,206 3.5% 3.3% 1,023,414 14.8% 7.1% (21,492) 28.51$ 55.41$ - - Financial Core B 41 5,673,256 160,454 2.8% 3.1% 345,108 16.7% 6.1% 16,107 22.84$ 46.52$ - - Financial Core All 94 37,051,737 1,646,675 4.4% 4.2% 3,069,092 13.9% 8.3% (83,401) 30.57$ 58.72$ - 905,722 Downtown East A 14 1,665,705 102,054 6.1% 2.8% 134,824 23.8% 8.1% (55,708) 27.11$ 46.44$ - 500,000 Downtown East B 36 2,505,953 47,530 1.9% 2.5% 117,569 26.2% 4.7% 15,747 22.19$ 43.22$ - - Downtown East All 50 4,171,658 149,584 3.6% 2.6% 252,393 24.9% 6.1% (39,961) 25.45$ 45.35$ - 500,000 Downtown North A 20 8,500,107 31,791 0.4% 0.3% 116,181 0.0% 1.4% (8,024) 22.21$ 43.41$ - - Downtown North B 53 8,517,353 59,423 0.7% 0.6% 182,992 23.6% 2.1% (5,904) 21.85$ 42.76$ - - Downtown North All 73 17,017,460 91,214 0.5% 0.5% 299,173 14.5% 1.8% (13,928) 21.99$ 43.01$ - - Downtown South A 14 5,691,776 838,456 14.7% 1.3% 874,896 3.7% 15.4% 162,488 - - 940,000 - Downtown South B 5 1,382,135 25,440 1.8% 2.8% 38,930 20.5% 2.8% 13,683 25.00$ 43.29$ - - Downtown South All 19 7,073,911 863,896 12.2% 1.6% 913,826 4.4% 12.9% 176,171 25.00$ 43.29$ 940,000 - Downtown West A 39 7,391,058 206,157 2.8% 3.6% 520,299 9.0% 7.0% 60,614 24.44$ 43.10$ - - Downtown West B 61 4,706,375 171,187 3.6% 3.9% 214,675 8.9% 4.6% 13,661 25.75$ 42.08$ - 75,000 Downtown West All 100 12,097,433 377,344 3.1% 3.7% 734,974 9.0% 6.1% 74,275 25.15$ 42.55$ - 75,000 Downtown Total AAA 15 17,044,586 988,015 5.8% 5.3% 1,700,570 12.9% 10.0% (78,016) 33.43$ 63.25$ - 905,722 Downtown Total A 125 37,582,541 1,676,664 4.5% 2.4% 2,669,614 9.8% 7.1% 137,878 27.30$ 51.76$ 940,000 500,000 Downtown Total B 196 22,785,072 464,034 2.0% 2.3% 899,274 17.7% 3.9% 53,294 22.99$ 44.38$ - 75,000 Downtown Total All 336 77,412,199 3,128,713 4.0% 3.0% 5,269,458 12.1% 6.8% 113,156 28.93$ 54.98$ 940,000 1,480,722 Survey results presented on this report have been condensed for reference. Results are updated periodically to ensure accuracy and therefore historically published results are subject to change. Notes: 1 Office Inventory: For the purpose of this report, buildings with less than 20,000 SF of office space and buildings owned and occupied by the government have not been included in the office inventory. 2 Vacancy Rate: The Vacancy Rate is the amount of vacant space divided by the existing building inventory. Vacant space is physically unoccupied, and it includes both headlease and sublease space. 3 Proportion of Sublease Availability: This ratio represents the share of available sublease space of the total available space. 4 Availability Rate: The Availability Rate is the amount of available space divided by the building inventory base. Available space is space that is available for lease and can be occupied, vacant or unknown. 5 Average Rental Rates: Average rental rates are calculated from available spaces, which also quote rental figures. 6 Absorption: Absorption is the difference in occupied space from quarter to quarter or year-over-year. 7 Currently Under Construction: Total square feet for currently under construction includes all buildings, even where building class is un-listed. Colliers Downtown | Office Statistics 2017 Q1
- 3. Office Market / Submarket Class # of Buildings Office Inventory Vacant Space Vacancy Rate Prior Quarter Vacancy Rate Available Space Proportion of Sublease Availability Availability Rate Absorption Current Quarter Wgt Avg. Asking Net Rent Wgt Avg. Asking Gross Rent Net New Supply Currently Under Construction Yonge-Bloor A 13 4,076,294 217,815 5.3% 2.6% 452,439 21.2% 11.1% (111,072) 25.39$ 47.61$ - - Yonge-Bloor B 43 5,547,886 135,073 2.4% 3.0% 199,808 11.2% 3.6% 33,137 22.04$ 42.15$ - - Yonge-Bloor All 56 9,624,180 352,888 3.7% 2.9% 652,247 18.1% 6.8% (77,935) 24.37$ 45.94$ - - Yonge-St.Clair A 6 896,638 17,545 2.0% 3.1% 19,047 7.9% 2.1% 10,409 21.48$ 43.53$ - - Yonge-St.Clair B 17 1,727,937 59,333 3.4% 3.8% 90,374 12.3% 5.2% 5,743 19.41$ 38.95$ - - Yonge-St.Clair All 23 2,624,575 76,878 2.9% 3.5% 109,421 11.5% 4.2% 16,152 19.93$ 40.10$ - - Yonge-Eglinton A 9 1,470,253 35,173 2.4% 7.0% 51,139 22.2% 3.5% 67,269 17.52$ 39.16$ - - Yonge-Eglinton B 31 2,882,201 88,518 3.1% 3.4% 135,202 18.1% 4.7% 10,480 17.43$ 36.08$ - - Yonge-Eglinton All 40 4,352,454 123,691 2.8% 4.6% 186,341 19.2% 4.3% 77,749 17.45$ 36.89$ - - Toronto West A 1 38,500 - 0.0% 0.0% - 0.0% 0.0% - - - - - Toronto West B 11 632,949 4,500 0.7% 0.7% 5,818 0.0% 0.9% - - - - - Toronto West All 12 671,449 4,500 0.7% 0.7% 5,818 0.0% 0.9% - - - - - Midtown Total A 29 6,481,685 270,533 4.2% 3.7% 522,625 20.8% 8.1% (33,394) 24.54$ 46.70$ - - Midtown Total B 102 10,790,973 287,424 2.7% 3.1% 431,202 13.4% 4.0% 49,360 20.10$ 39.65$ - - Midtown Total All 131 17,272,658 557,957 3.2% 3.3% 953,827 17.5% 5.5% 15,966 22.63$ 43.66$ - - Survey results presented on this report have been condensed for reference. Results are updated periodically to ensure accuracy and therefore historically published results are subject to change. Notes: 1 Office Inventory: For the purpose of this report, buildings with less than 20,000 SF of office space and buildings owned and occupied by the government have not been included in the office inventory. 2 Vacancy Rate: The Vacancy Rate is the amount of vacant space divided by the existing building inventory. Vacant space is physically unoccupied, and it includes both headlease and sublease space. 3 Proportion of Sublease Availability: This ratio represents the share of available sublease space of the total available space. 4 Availability Rate: The Availability Rate is the amount of available space divided by the building inventory base. Available space is space that is available for lease and can be occupied, vacant or unknown. 5 Average Rental Rates: Average rental rates are calculated from available spaces, which also quote rental figures. 6 Absorption: Absorption is the difference in occupied space from quarter to quarter or year-over-year. 7 Currently Under Construction: Total square feet for currently under construction includes all buildings, even where building class is un-listed. Colliers Midtown | Office Statistics 2017 Q1
- 4. Office Market / Submarket Class # of Buildings Office Inventory Vacant Space Vacancy Rate Prior Quarter Vacancy Rate Available Space Proportion of Sublease Availability Availability Rate Absorption Current Quarter Wgt Avg. Asking Net Rent Wgt Avg. Asking Gross Rent Net New Supply Currently Under Construction Don Mills/Eglinton A 8 1,081,359 203,398 18.8% 18.8% 226,830 12.4% 21.0% (302) 12.35$ 29.11$ - - Don Mills/Eglinton B 42 4,786,521 98,976 2.1% 2.0% 103,970 0.0% 2.2% (4,820) 10.56$ 25.92$ - - Don Mills/Eglinton All 50 5,867,880 302,374 5.2% 5.1% 330,800 8.5% 5.6% (5,122) 11.84$ 28.19$ - - Duncan Mill A 5 526,196 764 0.1% 4.8% 4,354 0.0% 0.8% 24,492 14.50$ 30.11$ - - Duncan Mill B 27 1,632,323 67,902 4.2% 4.7% 71,585 9.1% 4.4% 8,545 9.72$ 23.19$ - - Duncan Mill All 32 2,158,519 68,666 3.2% 4.7% 75,939 8.6% 3.5% 33,037 10.05$ 23.67$ - - Consumers Road A 7 1,305,491 202,372 15.5% 5.2% 217,218 5.2% 16.6% (134,403) 13.12$ 30.88$ - - Consumers Road B 26 3,089,296 266,772 8.6% 8.6% 357,463 13.9% 11.6% (650) 12.42$ 28.30$ - - Consumers Road All 33 4,394,787 469,144 10.7% 7.6% 574,681 10.6% 13.1% (135,053) 12.53$ 28.68$ - - Woodbine/Steeles A 20 3,798,351 251,423 6.6% 4.8% 262,722 1.0% 6.9% (67,338) 17.29$ 33.06$ - - Woodbine/Steeles B 31 2,269,242 75,079 3.3% 3.0% 106,218 5.4% 4.7% (6,180) 11.05$ 22.52$ - - Woodbine/Steeles All 51 6,067,593 326,502 5.4% 4.2% 368,940 2.3% 6.1% (73,518) 15.56$ 30.15$ - - Toronto East A 2 101,376 - 0.0% 0.0% - 0.0% 0.0% - - - - - Toronto East B 4 202,288 - 0.0% 0.0% - 0.0% 0.0% - - - - - Toronto East All 6 303,664 - 0.0% 0.0% - 0.0% 0.0% - - - - - Central East Total A 42 6,812,773 657,957 9.7% 7.1% 711,124 5.9% 10.4% (177,551) 14.91$ 31.24$ - - Central East Total B 130 11,979,670 508,729 4.2% 4.2% 639,236 9.7% 5.3% (3,105) 11.43$ 25.96$ - - Central East Total All 172 18,792,443 1,166,686 6.2% 5.2% 1,350,360 7.7% 7.2% (180,656) 13.27$ 28.74$ - - Survey results presented on this report have been condensed for reference. Results are updated periodically to ensure accuracy and therefore historically published results are subject to change. Notes: 1 Office Inventory: For the purpose of this report, buildings with less than 20,000 SF of office space and buildings owned and occupied by the government have not been included in the office inventory. 2 Vacancy Rate: The Vacancy Rate is the amount of vacant space divided by the existing building inventory. Vacant space is physically unoccupied, and it includes both headlease and sublease space. 3 Proportion of Sublease Availability: This ratio represents the share of available sublease space of the total available space. 4 Availability Rate: The Availability Rate is the amount of available space divided by the building inventory base. Available space is space that is available for lease and can be occupied, vacant or unknown. 5 Average Rental Rates: Average rental rates are calculated from available spaces, which also quote rental figures. 6 Absorption: Absorption is the difference in occupied space from quarter to quarter or year-over-year. 7 Currently Under Construction: Total square feet for currently under construction includes all buildings, even where building class is un-listed. Colliers Central East | Office Statistics 2017 Q1
- 5. Office Market / Submarket Class # of Buildings Office Inventory Vacant Space Vacancy Rate Prior Quarter Vacancy Rate Available Space Proportion of Sublease Availability Availability Rate Absorption Current Quarter Wgt Avg. Asking Net Rent Wgt Avg. Asking Gross Rent Net New Supply Currently Under Construction Yorkdale A 5 1,348,346 33,152 2.5% 2.4% 38,090 12.4% 2.8% (814) 14.32$ 34.02$ - - Yorkdale B 14 832,842 3,899 0.5% 0.2% 16,119 0.0% 1.9% (2,447) 9.95$ 25.45$ - - Yorkdale All 19 2,181,188 37,051 1.7% 1.5% 54,209 8.7% 2.5% (3,261) 13.05$ 31.53$ - - Dufferin/Finch A 1 71,658 - 0.0% 0.0% - 0.0% 0.0% - - - - - Dufferin/Finch B 19 1,552,607 37,128 2.4% 2.4% 41,933 0.0% 2.7% - 9.25$ 25.34$ - - Dufferin/Finch All 20 1,624,265 37,128 2.3% 2.3% 41,933 0.0% 2.6% - 9.25$ 25.34$ - - North Yonge Corridor A 22 6,981,925 656,906 9.4% 7.6% 981,123 19.1% 14.1% (124,760) 19.48$ 40.10$ - - North Yonge Corridor B 28 2,790,732 38,744 1.4% 1.5% 78,803 24.8% 2.8% 4,190 17.87$ 35.67$ - - North Yonge Corridor All 50 9,772,657 695,650 7.1% 5.9% 1,059,926 19.6% 10.8% (120,570) 19.35$ 39.75$ - - Central North Total A 28 8,401,929 690,058 8.2% 6.7% 1,019,213 18.9% 12.1% (125,574) 19.21$ 39.78$ - - Central North Total B 61 5,176,181 79,771 1.5% 1.6% 136,855 14.3% 2.6% 1,743 14.46$ 31.46$ - - Central North Total All 89 13,578,110 769,829 5.7% 4.8% 1,156,068 18.3% 8.5% (123,831) 18.64$ 38.79$ - - Survey results presented on this report have been condensed for reference. Results are updated periodically to ensure accuracy and therefore historically published results are subject to change. Notes: 1 Office Inventory: For the purpose of this report, buildings with less than 20,000 SF of office space and buildings owned and occupied by the government have not been included in the office inventory. 2 Vacancy Rate: The Vacancy Rate is the amount of vacant space divided by the existing building inventory. Vacant space is physically unoccupied, and it includes both headlease and sublease space. 3 Proportion of Sublease Availability: This ratio represents the share of available sublease space of the total available space. 4 Availability Rate: The Availability Rate is the amount of available space divided by the building inventory base. Available space is space that is available for lease and can be occupied, vacant or unknown. 5 Average Rental Rates: Average rental rates are calculated from available spaces, which also quote rental figures. 6 Absorption: Absorption is the difference in occupied space from quarter to quarter or year-over-year. 7 Currently Under Construction: Total square feet for currently under construction includes all buildings, even where building class is un-listed. Colliers Central North | Office Statistics 2017 Q1
- 6. Office Market / Submarket Class # of Buildings Office Inventory Vacant Space Vacancy Rate Prior Quarter Vacancy Rate Available Space Proportion of Sublease Availability Availability Rate Absorption Current Quarter Wgt Avg. Asking Net Rent Wgt Avg. Asking Gross Rent Net New Supply Currently Under Construction Vaughan A 33 2,620,523 170,642 6.5% 8.6% 195,179 12.0% 7.4% 178,847 18.06$ 29.83$ 136,000 - Vaughan B 23 1,015,258 30,975 3.1% 2.5% 55,320 0.0% 5.4% 31,711 16.94$ 26.62$ 38,673 - Vaughan All 56 3,635,781 201,617 5.5% 6.9% 250,499 9.4% 6.9% 210,558 17.68$ 28.73$ 174,673 - Richmond Hill A 5 586,529 - 0.0% 0.0% - 0.0% 0.0% - - - - - Richmond Hill B 6 261,873 3,099 1.2% 1.2% 4,346 0.0% 1.7% - 12.05$ 24.72$ - - Richmond Hill All 11 848,402 3,099 0.4% 0.4% 4,346 0.0% 0.5% - 12.05$ 24.72$ - - Hwy 404-Hwy 407 A 57 6,680,063 513,287 7.7% 6.4% 656,864 19.0% 9.8% (84,120) 17.27$ 31.37$ - - Hwy 404-Hwy 407 B 45 2,240,198 72,995 3.3% 3.3% 101,161 20.6% 4.5% 657 13.71$ 26.58$ - - Hwy 404-Hwy 407 All 102 8,920,261 586,282 6.6% 5.6% 758,025 19.2% 8.5% (83,463) 16.74$ 30.65$ - - Markham Town Centre A 15 1,798,910 256,062 14.2% 20.5% 262,905 5.7% 14.6% 113,177 17.90$ 31.62$ - - Markham Town Centre B 13 862,328 - 0.0% 0.0% 3,753 0.0% 0.4% - 8.28$ 14.52$ - - Markham Town Centre All 28 2,661,238 256,062 9.6% 13.9% 266,658 5.6% 10.0% 113,177 17.76$ 31.36$ - - GTA North Total A 110 11,686,025 939,991 8.0% 8.8% 1,114,948 14.7% 9.5% 207,904 17.57$ 31.24$ 136,000 - GTA North Total B 87 4,379,657 107,069 2.4% 2.3% 164,580 12.6% 3.8% 32,368 14.77$ 26.21$ 38,673 - GTA North Total All 197 16,065,682 1,047,060 6.5% 7.0% 1,279,528 14.4% 8.0% 240,272 17.15$ 30.49$ 174,673 - Survey results presented on this report have been condensed for reference. Results are updated periodically to ensure accuracy and therefore historically published results are subject to change. Notes: 1 Office Inventory: For the purpose of this report, buildings with less than 20,000 SF of office space and buildings owned and occupied by the government have not been included in the office inventory. 2 Vacancy Rate: The Vacancy Rate is the amount of vacant space divided by the existing building inventory. Vacant space is physically unoccupied, and it includes both headlease and sublease space. 3 Proportion of Sublease Availability: This ratio represents the share of available sublease space of the total available space. 4 Availability Rate: The Availability Rate is the amount of available space divided by the building inventory base. Available space is space that is available for lease and can be occupied, vacant or unknown. 5 Average Rental Rates: Average rental rates are calculated from available spaces, which also quote rental figures. 6 Absorption: Absorption is the difference in occupied space from quarter to quarter or year-over-year. 7 Currently Under Construction: Total square feet for currently under construction includes all buildings, even where building class is un-listed. Colliers GTA North | Office Statistics 2017 Q1
- 7. Office Market / Submarket Class # of Buildings Office Inventory Vacant Space Vacancy Rate Prior Quarter Vacancy Rate Available Space Proportion of Sublease Availability Availability Rate Absorption Current Quarter Wgt Avg. Asking Net Rent Wgt Avg. Asking Gross Rent Net New Supply Currently Under Construction Scarborough Town Centre A 11 2,066,430 174,963 8.5% 7.2% 225,962 23.7% 10.9% (25,499) 15.00$ 34.13$ - - Scarborough Town Centre B 57 4,464,793 79,182 1.8% 2.0% 362,855 0.8% 8.1% 9,237 12.32$ 27.96$ - - Scarborough Town Centre All 68 6,531,223 254,145 3.9% 3.6% 588,817 9.6% 9.0% (16,262) 13.24$ 30.08$ - - Pickering/Oshawa A 12 1,160,217 46,616 4.0% 4.5% 46,616 0.0% 4.0% 5,343 12.17$ 24.51$ - - Pickering/Oshawa B 26 1,913,114 93,706 4.9% 5.7% 130,086 0.0% 6.8% 15,865 13.09$ 25.16$ - - Pickering/Oshawa All 38 3,073,331 140,322 4.6% 5.3% 176,702 0.0% 5.7% 21,208 12.84$ 24.99$ - - GTA East Total A 23 3,226,647 221,579 6.9% 6.2% 272,578 19.7% 8.4% (20,156) 14.30$ 31.74$ - - GTA East Total B 83 6,377,907 172,888 2.7% 3.1% 492,941 0.6% 7.7% 25,102 12.57$ 27.07$ - - GTA East Total All 106 9,604,554 394,467 4.1% 4.2% 765,519 7.4% 8.0% 4,946 13.12$ 28.57$ - - Survey results presented on this report have been condensed for reference. Results are updated periodically to ensure accuracy and therefore historically published results are subject to change. Notes: 1 Office Inventory: For the purpose of this report, buildings with less than 20,000 SF of office space and buildings owned and occupied by the government have not been included in the office inventory. 2 Vacancy Rate: The Vacancy Rate is the amount of vacant space divided by the existing building inventory. Vacant space is physically unoccupied, and it includes both headlease and sublease space. 3 Proportion of Sublease Availability: This ratio represents the share of available sublease space of the total available space. 4 Availability Rate: The Availability Rate is the amount of available space divided by the building inventory base. Available space is space that is available for lease and can be occupied, vacant or unknown. 5 Average Rental Rates: Average rental rates are calculated from available spaces, which also quote rental figures. 6 Absorption: Absorption is the difference in occupied space from quarter to quarter or year-over-year. 7 Currently Under Construction: Total square feet for currently under construction includes all buildings, even where building class is un-listed. Colliers GTA East | Office Statistics 2017 Q1
- 8. Office Market / Submarket Class # of Buildings Office Inventory Vacant Space Vacancy Rate Prior Quarter Vacancy Rate Available Space Proportion of Sublease Availability Availability Rate Absorption Current Quarter Wgt Avg. Asking Net Rent Wgt Avg. Asking Gross Rent Net New Supply Currently Under Construction Airport Corporate Centre A 31 3,663,717 412,235 11.3% 11.5% 548,871 40.4% 15.0% 7,365 16.25$ 31.26$ - - Airport Corporate Centre B 18 1,245,092 12,710 1.0% 0.7% 33,998 55.4% 2.7% (3,538) 11.58$ 21.29$ - - Airport Corporate Centre All 49 4,908,809 424,945 8.7% 8.7% 582,869 41.3% 11.9% 3,827 15.85$ 30.39$ - - Airport East A 9 1,108,286 300,327 27.1% 30.7% 317,741 5.5% 28.7% 39,961 14.10$ 28.63$ - - Airport East B 49 3,006,779 348,222 11.6% 13.1% 451,994 8.1% 15.0% 44,384 12.48$ 26.35$ - - Airport East All 58 4,115,065 648,549 15.8% 17.8% 769,735 7.0% 18.7% 84,345 13.15$ 27.29$ - - Airport West A 23 2,942,329 114,990 3.9% 3.9% 114,990 43.3% 3.9% 1,038 13.48$ 23.20$ - - Airport West B 22 1,256,312 62,889 5.0% 3.9% 68,865 8.1% 5.5% (13,361) 10.64$ 23.10$ - - Airport West All 45 4,198,641 177,879 4.2% 3.9% 183,855 30.1% 4.4% (12,323) 12.08$ 23.15$ - - Brampton A 17 1,214,017 123,822 10.2% 12.4% 124,972 0.0% 10.3% 26,391 15.60$ 27.80$ - - Brampton B 24 2,920,650 97,734 3.3% 2.2% 108,629 69.9% 3.7% (32,183) 14.87$ 28.00$ - - Brampton All 41 4,134,667 221,556 5.4% 5.2% 233,601 32.5% 5.6% (5,792) 15.46$ 27.84$ - - Burlington A 25 2,106,629 118,529 5.6% 10.9% 194,393 4.5% 9.2% 112,087 17.63$ 30.71$ - - Burlington B 32 1,406,737 68,197 4.8% 7.4% 98,684 3.5% 7.0% 35,699 14.57$ 23.54$ - - Burlington All 57 3,513,366 186,726 5.3% 9.5% 293,077 4.2% 8.3% 147,786 16.60$ 28.30$ - - Cooksville A 2 150,534 - 0.0% 1.9% - 0.0% 0.0% 2,887 - - - - Cooksville B 15 1,109,467 51,689 4.7% 4.2% 63,390 3.2% 5.7% (5,092) 15.39$ 28.74$ - - Cooksville All 17 1,260,001 51,689 4.1% 3.9% 63,390 3.2% 5.0% (2,205) 15.39$ 28.74$ - - Hwy 401-Hurontario A 26 3,029,007 204,865 6.8% 5.3% 298,167 38.2% 9.8% (43,851) 14.82$ 28.80$ - - Hwy 401-Hurontario B 15 805,245 168,502 20.9% 20.1% 190,987 6.4% 23.7% (6,502) 12.65$ 24.78$ - - Hwy 401-Hurontario All 41 3,834,252 373,367 9.7% 8.4% 489,154 25.8% 12.8% (50,353) 13.70$ 26.72$ - - Hwy 427/Bloor/Islington A 11 2,101,631 155,632 7.4% 9.8% 188,530 0.0% 9.0% 50,439 19.33$ 35.27$ - - Hwy 427/Bloor/Islington B 43 2,396,523 375,549 15.7% 19.4% 415,945 6.8% 17.4% 89,647 12.86$ 30.13$ - - Hwy 427/Bloor/Islington All 54 4,498,154 531,181 11.8% 14.9% 604,475 4.7% 13.4% 140,086 16.47$ 33.00$ - - Meadowvale A 32 4,684,613 640,677 13.7% 12.5% 681,024 34.2% 14.5% (56,648) 20.59$ 33.46$ - - Meadowvale B 28 1,956,406 247,441 12.6% 10.9% 291,039 0.0% 14.9% (34,397) 17.29$ 28.50$ - - Meadowvale All 60 6,641,019 888,118 13.4% 12.0% 972,063 23.9% 14.6% (91,045) 19.55$ 31.90$ - - Mississauga City Centre A 18 3,210,382 423,618 13.2% 12.7% 449,211 5.8% 14.0% (16,302) 17.08$ 33.50$ - - Mississauga City Centre B 17 1,233,421 96,565 7.8% 7.7% 112,826 0.0% 9.1% (1,201) 17.15$ 34.28$ - - Mississauga City Centre All 35 4,443,803 520,183 11.7% 11.3% 562,037 4.6% 12.6% (17,503) 17.10$ 33.69$ - - Oakville A 25 1,927,848 159,023 8.2% 6.3% 266,881 9.8% 13.8% 59,222 19.53$ 32.34$ 104,000 - Oakville B 18 1,094,759 92,133 8.4% 9.3% 110,820 1.0% 10.1% 9,833 15.65$ 29.56$ - - Oakville All 43 3,022,607 251,156 8.3% 7.4% 377,701 7.2% 12.5% 69,055 18.26$ 31.43$ 104,000 - Sheridan-Winston A 14 1,609,716 233,681 14.5% 16.6% 572,511 2.0% 35.6% 34,261 22.16$ 35.41$ - - Sheridan-Winston B 24 1,349,286 92,048 6.8% 3.9% 146,630 0.0% 10.9% (39,155) 17.43$ 30.04$ - - Sheridan-Winston All 38 2,959,002 325,729 11.0% 10.8% 719,141 1.6% 24.3% (4,894) 20.91$ 33.99$ - - GTA West Total A 233 27,748,709 2,887,399 10.4% 10.9% 3,757,291 18.8% 13.5% 216,850 18.22$ 32.32$ 104,000 - GTA West Total B 305 19,780,677 1,713,679 8.7% 8.9% 2,093,807 8.8% 10.6% 44,134 14.19$ 27.97$ - - GTA West Total All 538 47,529,386 4,601,078 9.7% 10.0% 5,851,098 15.2% 12.3% 260,984 16.67$ 30.65$ 104,000 - Survey results presented on this report have been condensed for reference. Results are updated periodically to ensure accuracy and therefore historically published results are subject to change. Notes: 1 Office Inventory: For the purpose of this report, buildings with less than 20,000 SF of office space and buildings owned and occupied by the government have not been included in the office inventory. 2 Vacancy Rate: The Vacancy Rate is the amount of vacant space divided by the existing building inventory. Vacant space is physically unoccupied, and it includes both headlease and sublease space. 3 Proportion of Sublease Availability: This ratio represents the share of available sublease space of the total available space. 4 Availability Rate: The Availability Rate is the amount of available space divided by the building inventory base. Available space is space that is available for lease and can be occupied, vacant or unknown. 5 Average Rental Rates: Average rental rates are calculated from available spaces, which also quote rental figures. 6 Absorption: Absorption is the difference in occupied space from quarter to quarter or year-over-year. 7 Currently Under Construction: Total square feet for currently under construction includes all buildings, even where building class is un-listed. Colliers GTA West | Office Statistics 2017 Q1