Q2 15 office dashboard - midtown - yonge bloor #cre
•
0 likes•286 views

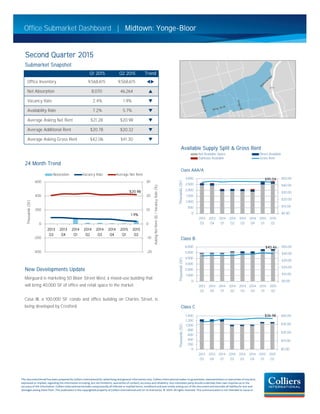
This document summarizes office market trends in a particular submarket for the second quarter of 2015. Net absorption increased significantly from the previous quarter while the vacancy rate declined. The average asking rent for various office space classifications like Class AAA/A and Class B decreased slightly. Two new development projects were announced that will add over 140,000 square feet of new office and retail space to the market.
Recommended

Recommended
More Related Content
Similar to Q2 15 office dashboard - midtown - yonge bloor #cre
Similar to Q2 15 office dashboard - midtown - yonge bloor #cre (20)
More from Chris Fyvie
More from Chris Fyvie (20)
Recently uploaded
Recently uploaded (20)
Q2 15 office dashboard - midtown - yonge bloor #cre
- 1. Second Quarter 2015 Submarket Snapshot Q1 2015 Q2 2015 Trend Office Inventory 9,568,615 9,568,615 tu Net Absorption 8,070 46,264 p MAP Vacancy Rate 2.4% 1.9% q Availability Rate 7.2% 5.7% q Average Asking Net Rent $21.28 $20.98 q Average Additional Rent $20.78 $20.32 q Average Asking Gross Rent $42.06 $41.30 q Available Supply Split & Gross Rent 24 Month Trend Class AAA/A Class B New Developments Update Morguard is marketing 50 Bloor Street West, a mixed-use building that will bring 40,000 SF of office and retail space to the market. Casa III, a 100,000 SF condo and office building on Charles Street, is being developed by Cresford. Class C Office Submarket Dashboard | This document/email has been prepared by Colliers International for advertising and general information only. Colliers International makes no guarantees, representations or warranties of any kind, expressed or implied, regarding the information including, but not limited to, warranties of content, accuracy and reliability. Any interested party should undertake their own inquiries as to the accuracy of the information. Colliers International excludes unequivocally all inferred or implied terms, conditions and warranties arising out of this document and excludes all liabilityfor loss and damages arising there from. This publication is the copyrighted property of Colliers International and /or its licensor(s). © 2014. All rights reserved. This communication is not intended to cause or $45.04 $0.00 $10.00 $20.00 $30.00 $40.00 $50.00 0 500 1,000 1,500 2,000 2,500 3,000 2013 Q3 2013 Q4 2014 Q1 2014 Q2 2014 Q3 2014 Q4 2015 Q1 2015 Q2 Thousands(SF) Not Available Space Direct Available Sublease Available Gross Rent $40.46 $0.00 $10.00 $20.00 $30.00 $40.00 $50.00 0 1,000 2,000 3,000 4,000 5,000 6,000 2013 Q3 2013 Q4 2014 Q1 2014 Q2 2014 Q3 2014 Q4 2015 Q1 2015 Q2 Thousands(SF) $36.98 $0.00 $10.00 $20.00 $30.00 $40.00 0 200 400 600 800 1,000 1,200 1,400 2013 Q3 2013 Q4 2014 Q1 2014 Q2 2014 Q3 2014 Q4 2015 Q1 2015 Q2 Thousands(SF) Midtown: Yonge-Bloor $20.98 1.9% -20 -10 0 10 20 30 -400 -200 0 200 400 600 2013 Q3 2013 Q4 2014 Q1 2014 Q2 2014 Q3 2014 Q4 2015 Q1 2015 Q2 AskingNetRent($)/VacancyRate(%) Thousands(SF) Absorption Vacancy Rate Average Net Rent