Beyond the EU: DORA and NIS 2 Directive's Global Impact
Chapter 8 making sense of sample data
1. 2013/05/07
1
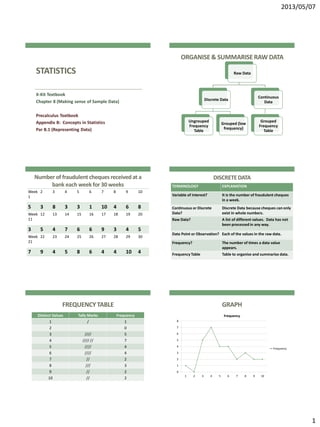
STATISTICS
X-Kit Textbook
Chapter 8 (Making sense of Sample Data)
Precalculus Textbook
Appendix B: Concepts in Statistics
Par B.1 (Representing Data)
ORGANISE& SUMMARISERAW DATA
Raw Data
Discrete Data
Ungrouped
Frequency
Table
Grouped (low
frequency)
Continuous
Data
Grouped
Frequency
Table
Number of fraudulent cheques receivedat a
bank each week for 30 weeks
Week
1
2 3 4 5 6 7 8 9 10
5 3 8 3 3 1 10 4 6 8
Week
11
12 13 14 15 16 17 18 19 20
3 5 4 7 6 6 9 3 4 5
Week
21
22 23 24 25 26 27 28 29 30
7 9 4 5 8 6 4 4 10 4
DISCRETEDATA
TERMINOLOGY EXPLANATION
Variable of Interest? It is the number of fraudulent cheques
in a week.
Continuous or Discrete
Data?
Discrete Data because cheques can only
exist in whole numbers.
Raw Data? A list of different values. Data has not
been processed in any way.
Data Point or Observation? Each of the values in the raw data.
Frequency? The number of times a data value
appears.
Frequency Table Table to organise and summarise data.
FREQUENCYTABLE
Distinct Values Tally Marks Frequency
1 / 1
2 0
3 //// 5
4 //// // 7
5 //// 4
6 //// 4
7 // 2
8 /// 3
9 // 2
10 // 2
GRAPH
0
1
2
3
4
5
6
7
8
1 2 3 4 5 6 7 8 9 10
Frequency
Frequency
2. 2013/05/07
2
Truck Data: weights(in tonnes) of 20 fully
loaded trucks
Truck
1
2 3 4 5 6 7 8 9 10
Weight
4.54
3.81 4.29 5.16 2.51 4.63 4.75 3.98 5.04 2.80
Truck
11
12 13 14 15 16 17 18 19 20
Weight
2.52
5.88 2.95 3.59 3.87 4.17 3.30 5.48 4.26 3.53
CONTINUOUSDATA
TERMINOLOGY EXPLANATION
Variable of Interest? The weight of a loaded truck.
Continuous or Discrete
Data?
Continuous Data, you can get any
number of values between two
given values.
Frequency Table Table to organise and summarise
data.
Grouped Frequency Table
FREQUENCYTABLE
Class Intervals Tally Marks Frequency
𝟐. 𝟓 ≤ 𝒙 ≤ 𝟑. 𝟎 //// 4
𝟑. 𝟎 ≤ 𝒙 ≤ 𝟑. 𝟓 / 1
𝟑. 𝟓 ≤ 𝒙 ≤ 𝟒. 𝟎 //// 5
𝟒. 𝟎 ≤ 𝒙 ≤ 𝟒. 𝟓 /// 3
𝟒. 𝟓 ≤ 𝒙 ≤ 𝟓. 𝟎 /// 3
𝟓. 𝟎 ≤ 𝒙 ≤ 𝟓. 𝟓 // 2
𝟓. 𝟓 ≤ 𝒙 ≤ 𝟔. 𝟎 // 2
GRAPH
0
1
2
3
4
5
6
0 - 2.5 2.5 - 3.0 3.0 - 3.5 3.5 - 4.0 4.0 - 4.5 4.5 - 5.0 5.0 - 5.5 5.5 - 6.0
Frequency
Frequency
PRESENTATIONOF DATA
Frequency
Table
Pictogram
Bar
Graphs
Histogram
Pie
Chart
Line
Graphs
Stem-and-
Leaf
Ogive
FREQUENCYTABLE
Class Intervals Frequency Cumulative
Frequency
𝟐. 𝟓 ≤ 𝒙 ≤ 𝟑. 𝟎 4 4
𝟑. 𝟎 ≤ 𝒙 ≤ 𝟑. 𝟓 1 5
𝟑. 𝟓 ≤ 𝒙 ≤ 𝟒. 𝟎 5 10
𝟒. 𝟎 ≤ 𝒙 ≤ 𝟒. 𝟓 3 13
𝟒. 𝟓 ≤ 𝒙 ≤ 𝟓. 𝟎 3 16
𝟓. 𝟎 ≤ 𝒙 ≤ 𝟓. 𝟓 3 19
𝟓. 𝟓 ≤ 𝒙 ≤ 𝟔. 𝟎 1 20
3. 2013/05/07
3
OGIVE
0
5
10
15
20
25
2.5 3 3.5 4 4.5 5 5.5 6
Cumulative Frequency
Cumulative Frequency
Pictogram: Net Worthof America'sRichest Billionaires
Pie Chart: Average Annual Expenses in a U.S. Household
EXAMPLE
In a class with 30 pupils there are 12 with
blue eyes; 9 with brown eyes; 4 with dark
brown eyes and 5 with green eyes.
1. Draw a pie chart showing this
information.
2. Calculate the fraction and percentage
represented by each eye colour.
EXAMPLE: SOLUTION
Colour of
Eyes
Frequency Angle at Centre Percentage
Blue 12 𝟏𝟐
𝟑𝟎
× 𝟑𝟔𝟎°
= 𝟏𝟒𝟒°
𝟏𝟐
𝟑𝟎
× 𝟏𝟎𝟎 = 𝟒𝟎%
Brown 9 𝟗
𝟑𝟎
× 𝟑𝟔𝟎°
= 𝟏𝟎𝟖°
𝟗
𝟑𝟎
× 𝟏𝟎𝟎 = 𝟑𝟎%
Dark Brown 4 𝟒
𝟑𝟎
× 𝟑𝟔𝟎°
= 𝟒𝟖°
𝟒
𝟑𝟎
× 𝟏𝟎𝟎 = 𝟏𝟑, 𝟑%
Green 5 𝟓
𝟑𝟎
× 𝟑𝟔𝟎°
= 𝟔𝟎°
𝟓
𝟑𝟎
× 𝟏𝟎𝟎 = 𝟏𝟔, 𝟕%
Total 30 𝟑𝟔𝟎° 𝟏𝟎𝟎%
PIE CHART
Blue
Brown
Dark Brown
Green