Download as PDF, PPTX

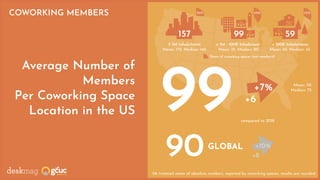
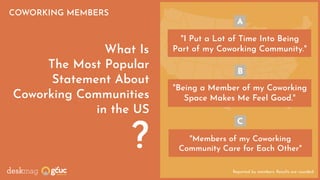
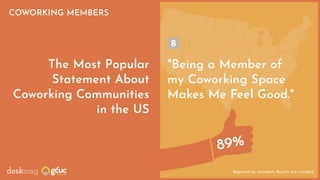
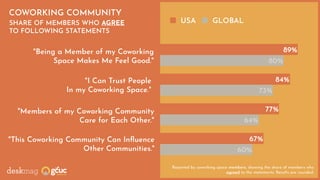

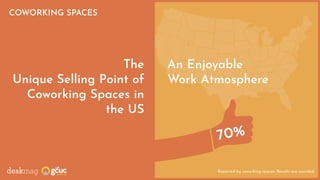
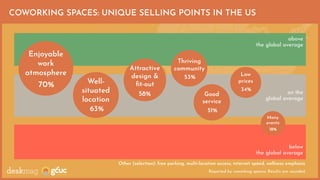
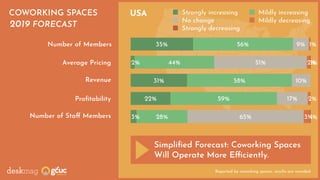


This document presents statistics from the 2019 Global Coworking Survey. Some key findings include: - The average number of members per coworking space in the US was 112, with larger spaces found in more populated areas. - 89% of coworking members in the US said that being a member makes them feel good, the most popular statement about coworking communities. - 70% of coworking spaces in the US cited an enjoyable work atmosphere as their unique selling point. - Coworking spaces in the US forecast operating more efficiently in 2019, with mild increases expected in members but decreases in other areas like staffing and prices.


![[DSC Europe 25] Josip Saban - Career building for data professionals.pptx](https://cdn.slidesharecdn.com/ss_thumbnails/zroflcttkm1vmli0txea-josip-saban-career-building-for-data-professionals-260123083019-587cdb8c-thumbnail.jpg?width=640&height=640&fit=bounds)


![[DSC Europe 25] Predrag Maletic - Scaling AI in Banking – Our Strategic Journ...](https://cdn.slidesharecdn.com/ss_thumbnails/qu2onv0aruwlvqtygmxx-predrag-maletic-scaling-ai-in-banking-260123083019-6cf1da1d-thumbnail.jpg?width=640&height=640&fit=bounds)

![[DSC Europe 25] Ekaterina Bubenko - Behind the Curtain: How Data Roles Collab...](https://cdn.slidesharecdn.com/ss_thumbnails/anmv6x8dstqbbzchoklr-ekaterina-bubenko-behind-the-curtain-how-data-roles-collaborate-in-the-ai-era-a-260123083019-4b252ec7-thumbnail.jpg?width=640&height=640&fit=bounds)

