2. Madhusudana C. K., Hemantha Kumar, Narendranath S/ Journal of Vibration Analysis, Measurement, and Control
(2016) Vol. 4 No. 1 pp. 10-28
11
works based on the acquired process parameters such as current signal, acoustic emission (AE)
signal, cutting force, vibration signal, etc. to determine the condition of the cutting tool. Among
these acquired signals, vibration gives better results about tool condition. One of the advantages of
vibration signal measurement is that no modifications are required for experimental setup (Teti et
al., 2010).
In signal processing techniques, no matter which process parameters are selected, signal processing
techniques such as time domain, frequency domain and time-frequency domain analyses are very
much useful to predict tool condition. Abouelatta and Madl (2001) correlated the surface profile of
workpiece with the cutting parameters and cutting tool vibrations. Huang et al. (2012) investigated
the stable and chatter machining processes through spectrum plots of cutting force and vibrational
signals. Bisu et al. (2012) examined the dynamic behavior of the milling process to monitor the
condition of the cutting tool through spectrum analysis using vibration signals. Sivasakthivel et al.
(2011) developed a mathematical model with process parameters to analyze the vibration
amplitude in high speed end milling of Al 6063 material using spectrum analysis. Antonialli et al.
(2010) analyzed the variations in cutting force during milling of titanium alloy in time and
frequency domain analyses.
From the past two decades, wavelet analysis has become one of the emerging and efficient tools for
identifying the faults in signal processing and has its distinct merits. Some of the wavelet
applications such as the time-frequency domain, denoising of weak signals and extraction of
features related to faults, vibration signals compression, singularity detection for signals, etc. were
used in machine condition monitoring and fault diagnostics (Peng and Chu, 2004). Mori et al. (1999)
analyzed the transient responses in cutting force signals during drilling process using discrete
wavelet transform (DWT) instead of using traditional spectrum analysis. Spectrum analysis has its
own limitations (Zhu et al., 2009) as it can only be used for stationary signals. Li et al. (2005)
revealed that the fast algorithm of wavelet transform is more reliable, sensitive and faster than
spectrum analysis in prediction of tool wear condition during turning process. Li and Guan (2004)
analyzed the feed motor current signals to predict cutting edge fracture through time-frequency
plots in end milling process. Lee and Tarng (1999) determined milling tool breakage through
discrete wavelet transform (DWT) using cutting force signals. Hsieh et al. (2012) studied the
micro-milling tool condition monitoring using vibration signals and proposed a classifier to monitor
the tool condition with the help of relevant features extracted from the vibration signals. Yao et al.
(2010) applied wavelet transform for chatter detection and support vector machine (SVM)
technique for pattern classification during boring process using vibration signals.
Limited literature is available regarding the usage of advanced signal processing techniques such as
wavelet and cepstrum analysis in milling tool condition monitoring. This study aims to analyze the
3. Madhusudana C. K., Hemantha Kumar, Narendranath S/ Journal of Vibration Analysis, Measurement, and Control
(2016) Vol. 4 No. 1 pp. 10-28
12
spindle vibration signals of healthy and faulty conditions of face milling cutter using signal
processing techniques for tool condition monitoring. The conventional vibration analyses such as
time-domain, frequency domain, quefrency domain and advanced signal processing technique such
as CWT method have been used to predict the tool conditions.
2. Signal Processing Technique
2.1 Time and Frequency Domain Analysis
Time domain plot helps to examine the amplitude and phase information of the vibration signal to
determine the failure/defect of any rotating machinery system. Fault diagnosis using time series
response is a difficult task. Fourier transform (FT) is the most widely used technique in vibration
signal analysis. It converts given signal from time domain to frequency domain by integrating the
given function over the entire time period. Fourier transform for the angular frequency 𝜔 =
2𝜋𝑓 and time ‘t’ is given by,
𝑋(⍵) = ∫ 𝑥(𝑡)
+∞
−∞
𝑒−𝑗⍵𝑡
𝑑𝑡 (1)
Where X(ω) is the Fourier transform of the signal x(t). FT technique earned much of its importance
in processing stationary signal. Fast Fourier transform (FFT) is one of the extension of FT (Vernekar
et al., 2014).
In milling process, one of the reasons for vibration of the cutting tool is due to variation in the
cutting force. This cutting force signal is periodic and its variation frequency is tooth passing
frequency (TPF), which depends on spindle rotating frequency (fs) and number of teeth in the
cutting tool. Spindle rotating frequency ‘fs’ is defined as,
𝑓𝑠 =
𝑁
60
=
1000𝑣
60𝜋𝐷
(2)
where D is the diameter of the mill, N is the spindle speed (in revolutions per minute) and v is linear
speed (in meters per minute) . TPF is defined as,
𝑇𝑃𝐹 = 𝑁 𝑇 ∗ 𝑓𝑠 =
1000𝑣 𝑁 𝑇
60𝜋𝐷
(3)
Where 𝑁 𝑇 is the teeth numbers of the cutter, while the presence of peaks at additional
frequencies represents the chatter. This TPF of milling dynamics is often used for detection of the
4. Madhusudana C. K., Hemantha Kumar, Narendranath S/ Journal of Vibration Analysis, Measurement, and Control
(2016) Vol. 4 No. 1 pp. 10-28
13
chatter (Huang et al., 2013).
2.2 Cepstrum Analysis
A cepstrum is considered as forward Fourier transformation of the logarithm of a spectrum. It is
therefore defined as the spectrum of a spectrum. The cepstrum was originally referred as the power
spectrum of the logarithmic power spectrum. Thus, the calculation of cepstrum involves the inverse
Fourier transform of the natural logarithm of a spectrum (Randall, 1982). Given a real signal x(n),
cepstrum form can be expressed as follows.
The real cepstrum of a signal x(n) (Hasegawa, 2000):
𝑐(𝑛) =
1
2𝜋
∫ 𝑙𝑜𝑔
𝜋
−𝜋
|𝑋(𝑒 𝑗𝜔
)|𝑒 𝑗𝜔𝑛
𝑑𝜔 (4)
Where n is cepstral ‘lag’, if x(n) is real, then log|𝑋(𝑒 𝑗𝜔
)| is even. Cepstrum reveals the periodicity
in frequency domain usually as results of modulation. Fig. 1 depicts relationship between spectrum
and cepstrum.
Fig. 1. The relationship between a spectrum and a cepstrum
2.3 Wavelet Analysis
The Fourier transform is not suitable for analyzing non-stationary signals since it fails to reveal the
frequency content of a signal at a particular time. In signal processing, the limitation of FT led to the
introduction of new time-frequency analysis called wavelet transform (WT) (Vernekar et al., 2014).
Generally, conventional data processing is computed in time or frequency domain. Wavelet
processing method combines both time and frequency informations. Wavelet analysis is one of the
‘time-frequency’ analysis. A wavelet is a basis function characterized by two aspects; first is its
shape and amplitude, which is chosen by the user, second is its scale (frequency) and time (location)
relative to the signal.
FFT log (FFT) FFT
CepstrumSpectrum
Signal
5. Madhusudana C. K., Hemantha Kumar, Narendranath S/ Journal of Vibration Analysis, Measurement, and Control
(2016) Vol. 4 No. 1 pp. 10-28
14
The continuous wavelet transform can be used to generate spectrograms which show the frequency
content of signals as a function of time. A continuous-time wavelet transform of x(t) is defined as,
𝐶𝑊𝑇 𝑋 𝜓(𝑎, 𝑏) =
1
√|𝑎|
∫ 𝑥(𝑡)𝜓∗
(
𝑡 − 𝑏
𝑎
) 𝑑𝑡,
∞
−∞
{𝑎, 𝑏 𝜖 𝑅, 𝑎 ≠ 0} (5)
In the above equation (5), ψ(t) is a continuous wavelet function in time domain as well as the
frequency domain called the mother wavelet and ψ*(t) indicates complex conjugate of the analyzing
wavelet ψ(t). The parameter ‘a’ is termed as scaling parameter and ‘b’ is the translation parameter.
The transformed signal Xψ(a, b) is a function of the translation parameter ‘b’ and the scale
parameter ‘a’. In WT, signal energy is normalized by dividing the wavelet coefficients by
1
√|𝑎|
at each
scale.
Morlet Wavelet
The Morlet wavelet transform belongs to CWT family. It is one of the most popular wavelet used in
practice and its mother wavelet is given by,
𝜓(𝑡) =
1
√ 𝜋
4 (𝑒 𝑗𝑤0 𝑡
− 𝑒−
𝑤0
2
2 ) 𝑒−
𝑡2
2 (6)
In the above equation (6), w0 refers to central frequency of the mother wavelet. The term 𝑒−
𝑤0
2
2
involved in the equation is specifically used for correcting the non-zero mean of the complex
sinusoid and in most cases, it can be negligible when w0 > 5. Therefore, when the central frequency
w0 >5, the mother wavelet can be redefined as follows (Vernekar et al., 2014);
𝜓(𝑡) =
1
√ 𝜋
4 𝑒 𝑗𝑤0 𝑡
∗ 𝑒−
𝑡2
2 (7)
3. Experimental Setup
Experiments were carried out using universal milling machine with machining parameters
recommended by Mitsubishi as mentioned in Table 1. Experimental setup consists of universal
milling machine with data acquisition system as shown in Fig. 2. Face milling cutter with 3 carbide
inserts (Mitsubishi make: SEMT13T3AGSN- VP15TF) of 80 mm diameter and work-piece material
of AISI H13 steel were used in this work.
6. Madhusudana C. K., Hemantha Kumar, Narendranath S/ Journal of Vibration Analysis, Measurement, and Control
(2016) Vol. 4 No. 1 pp. 10-28
15
Fig. 2. Experimental setup
Table 1 Experimental condition of face milling process
Experimental Condition
Work material AISI H13 steel
Insert material Carbide
Cutting speed 75 m/min
Feed rate 0.067 mm/tooth
Depth of cut 0.5 mm
Faulty conditions of the tool Flank wear, chipping and breakage
Lubrication Dry
Experiments were conducted with four different conditions of the tool (Fig. 3), out of which one is
healthy and three fault conditions, namely;
a) Healthy tool [Fig. 3(a)]
b) Flank wear (one insert) [Fig. 3(b)]
c) Chipping on rake face (one insert) [Fig. 3(c)]
d) Tip breakage (one insert) [Fig. 3(d)]
7. Madhusudana C. K., Hemantha Kumar, Narendranath S/ Journal of Vibration Analysis, Measurement, and Control
(2016) Vol. 4 No. 1 pp. 10-28
16
a) Healthy b) Flank wear c) Chipping d) Breakage
Fig. 3. Different conditions of face milling tool insert
In healthy condition (Fig. 3a) of the tool, all three inserts are new/unworn inserts, whereas in faulty
condition of the tool, one out of three inserts is either flank wear or chipping or breakage (Fig. 3(b)
or 3(c) or 3(d)) condition has been considered for analysis.
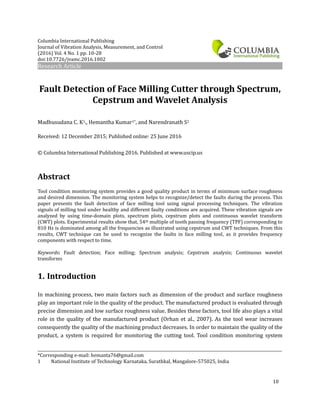
Fig. 4. Schematic representation of condition monitoring of face milling cutter.
Vibrational signals were acquired using tri-axial piezoelectric accelerometer (YMC145A100) which
Vibration signals Cepstrum
0.00 0.02 0.04 0.06 0.08
-0.02
-0.01
0.00
0.01
0.02
0.03
0.04
0.05
0.06
Acceleration
quefrency
Spectrum
0 50 100 150 200
0.00
0.01
0.02
0.03
0.04
Acceleration
Frequency
CWT
Milling cutter condition
(a) healthy, (b) flank
wear, (c) chipping and
(d) breakage
Fault detection
of face milling
cutter condition
8. Madhusudana C. K., Hemantha Kumar, Narendranath S/ Journal of Vibration Analysis, Measurement, and Control
(2016) Vol. 4 No. 1 pp. 10-28
17
was mounted on spindle housing. Data acquisition system (National Instruments DAQ 9234) was
used to acquire the acceleration signals from the sensor with sampling frequency of 5 kHz and these
signals were then processed by LabVIEW software and data was saved. Initially, rough machining
was carried out with few passes to remove the oxidized layer and unevenness of the work-piece.
The process was kept running for two or three minutes to stabilize the machine vibration before
starting data acquisition. The procedure for fault detection of face milling tool using different signal
processing techniques is as shown in Fig. 4.
4. Results and Discussion
4.1 Time-Domain Analysis
(a) (b)
(c) (d)
Fig. 5. Time-series plots of (a) healthy, (b) flank wear, (c) chipping and (d) breakage face milling
tool conditions
0.0 0.2 0.4 0.6 0.8 1.0
-25
-20
-15
-10
-5
0
5
10
15
20
25
Acceleration(g)
Time (sec)
0.0 0.2 0.4 0.6 0.8 1.0
-25
-20
-15
-10
-5
0
5
10
15
20
25
acceleration(g)
Time (sec)
0.0 0.2 0.4 0.6 0.8 1.0
-25
-20
-15
-10
-5
0
5
10
15
20
25
Acceleration(g)
Time (sec)
0.0 0.2 0.4 0.6 0.8 1.0
-25
-20
-15
-10
-5
0
5
10
15
20
25
Acceleration(g)
Time (sec)
9. Madhusudana C. K., Hemantha Kumar, Narendranath S/ Journal of Vibration Analysis, Measurement, and Control
(2016) Vol. 4 No. 1 pp. 10-28
18
The acceleration signals were acquired for healthy and different faulty conditions of the tool. Fig. 5
shows the time-series plots in feed direction for different conditions (healthy, flank wear, chipping
and breakage) of the milling tool. In time domain analysis, slight variations in amplitude of vibration
patterns is observed, but it is very difficult to recognize the different condition of the tool. It means
time domain analysis does not give sufficient information about tool condition.
4.2 Spectrum Analysis
The experimental results of spectrum for different condition of the tool are shown in Fig. 6. From
spectrum plot, under normal cutting condition in a milling process, the dominant frequency
components in the spectrum graph are around the spindle rotating frequency (fs), tooth passing
frequency (TPF) and their harmonics (Orhan et al., 2007).
0 200 400 600 800 1000
0.00
0.02
0.04
0.06
0.08
0.10
0.12
0.14
(a) Healthy
Acceleration(g)
Frequency (Hz)
10. Madhusudana C. K., Hemantha Kumar, Narendranath S/ Journal of Vibration Analysis, Measurement, and Control
(2016) Vol. 4 No. 1 pp. 10-28
19
0 200 400 600 800 1000
0.00
0.02
0.04
0.06
0.08
0.10
0.12
0.14
x: 810 Hz
y: 0.1 g
(b) Flank wear
Acceleration(g)
Frequency (Hz)
0 200 400 600 800 1000
0.00
0.02
0.04
0.06
0.08
0.10
0.12
0.14
x: 810 Hz
y: 0.125 g
(c) Chipping
Acceleration(g)
Frequency (Hz)
11. Madhusudana C. K., Hemantha Kumar, Narendranath S/ Journal of Vibration Analysis, Measurement, and Control
(2016) Vol. 4 No. 1 pp. 10-28
20
Fig. 6. Spectrum plots (a) healthy, (b) flank wear, (c) chipping and (d) breakage
Table 2 Characteristic vibration frequency of spindle speed running at 300 rpm.
Parameters Value
Spindle frequency (fs) 5 Hz
Tooth pass frequency (TPF) 15 Hz
Total number of inserts in milling
tool
3
Table 2 shows the characteristic vibration frequency of milling process with spindle speed running
at 300 rpm. Tooth pass frequency for the given spindle speed and tool inserts is about 15 Hz. It can
be noticed from spectrum plot that along with tooth pass frequency and its harmonics (1x, 2x,
3x,….etc.), few peaks corresponding to chatter are also present. Figs. 6 (a) and (b) show the
spectrum of healthy and flank wear conditions of the tool respectively, 54th multiple of tooth passing
frequency (810 Hz) shows the dominancy among all other harmonics. The corresponding
acceleration amplitude of 54th multiple of TPF is about 0.1 m/s2. This signifies the presence of fault
in the milling tool. The increase in the amplitude level of same frequency (54th multiple of TPF) with
increase in severity of fault (chipping) can be visualized in spectrum as illustrated in Fig. 6(c). The
0 200 400 600 800 1000
0.00
0.02
0.04
0.06
0.08
0.10
0.12
0.14
x: 810 Hz
y: 0.1 g
(d) Breakage
Acceleration(g)
Frequency (Hz)
12. Madhusudana C. K., Hemantha Kumar, Narendranath S/ Journal of Vibration Analysis, Measurement, and Control
(2016) Vol. 4 No. 1 pp. 10-28
21
magnitude of acceleration is increased from 0.1 to 0.125 m/s2, which signifies the increase of fault
level in the milling tool. Also for breakage condition, 54th TPF is the dominant frequency among all
TPF harmonics. It might be evident that, 54th multiple of TPF coincides with the natural frequency
(810 Hz) of tool-workpiece material structure. The cepstrum analysis has been carried out in order
to recognize the tool conditions and also to validate the results of spectrum analysis.
4.3 Cepstrum Analysis
The cepstrum plots of face milling tool under different conditions (healthy, flank wear, chipping and
breakage) are as shown in Fig. 7. As discussed in spectrum analysis, the dominant peak
corresponding to 810 Hz (54th multiple of TPF) is the defect frequency. In cepstrum analysis, the
defect frequency is called as defect quefrency of about 0.0012s (1/810Hz) which shows the
variation in amplitude of acceleration for different conditions of the tool. Fig. 7(a) shows the
cepstrum plot of a healthy tool where the acceleration of dominant peak at quefrency (0.0012s) is
about 0.015 m/s2 which is to be considered as a reference margin for fault detection. As the faults
(flank wear, chipping and breakage) are introduced into the milling tool, the acceleration value at
defect quefrency (0.0012s) is increased. In case of flank wear condition (Fig. 7(b)), 54th multiples of
tooth passing quefrency (0.0012s) has the acceleration of about 0.031 m/s2, which implies the
presence of faults in the milling tool. For chipping condition (Fig. 7(c)), the acceleration value at
quefrency (0.0012s) is about 0.04 m/s2, which signifies the increase in the level of faults during
milling process. In case of breakage tool condition, the acceleration at defect quefrency is about
0.035 m/s2 as shown in Fig. 7(d).
From the above discussion of spectrum and cepstrum analyses of the face milling tool, it can be
visualized that even with the presence of defect in the tool, it is quite difficult to identify the
particular time at which the defect frequency/quefrency is being attained and it requires
time-frequency domain analysis. Wavelet analysis demonstrates both time and frequency domains,
meaning that it generates frequency content signals as a function of time.
14. Madhusudana C. K., Hemantha Kumar, Narendranath S/ Journal of Vibration Analysis, Measurement, and Control
(2016) Vol. 4 No. 1 pp. 10-28
23
Fig. 7. Cepstrum plots (a) healthy, (b) flank wear, (c) chipping and (d) breakage conditions.
0.00 0.02 0.04 0.06 0.08
-0.02
-0.01
0.00
0.01
0.02
0.03
0.04
0.05
0.06
x: 0.00124 sec
y: 0.04 g
(c) Chipping
Acceleration(g)
Quefrency (sec)
0.00 0.02 0.04 0.06 0.08
-0.02
-0.01
0.00
0.01
0.02
0.03
0.04
0.05
0.06
x: 0.00124 sec
y: 0.035 g
(d) Breakage
Acceleration(g)
Quefrency (sec)
15. Madhusudana C. K., Hemantha Kumar, Narendranath S/ Journal of Vibration Analysis, Measurement, and Control
(2016) Vol. 4 No. 1 pp. 10-28
24
4.4 Wavelet Analysis
Fig. 8 illustrates CWT plots of the milling machine spindle vibration with healthy and fault
conditions of the face milling tool.
(c) Chipping
(a) Healthy
(b) Flank wear
16. Madhusudana C. K., Hemantha Kumar, Narendranath S/ Journal of Vibration Analysis, Measurement, and Control
(2016) Vol. 4 No. 1 pp. 10-28
25
Fig. 8. CWT plots of (a) healthy, (b) flank wear, (c) chipping and (d) breakage
From Fig. 8, one can say that for the given time period (one second) there is some variation in
intensity of high frequency band at 810 Hz, as the faults occur in the milling tool. The presence of
high-frequency component at 810 Hz (54th multiple of TPF) which is one of the harmonics of TPF.
Fig. 8 (a) depicts the CWT plot of healthy condition as a reference margin for fault detection. As the
faults such as flank wear, chipping and breakage occur in milling tool, intensity of the high
frequency (810 Hz) band has been increased as shown in Fig. 8(b), (c) and (d). This variations in
intensity of high frequency band indicate the fault existence in milling tool.
5. Conclusion
In this paper, signal processing techniques such as spectrum analysis, cepstrum analysis and CWT
were used to analyze the vibration signals under healthy and faulty conditions for identifying the
faults in face milling tool. As seen from the plots of spectrum, cepstrum and CWT techniques, as the
severity of fault increases, there is a dominant peak at 54th multiples of TPF and it nearly coincides
with the natural frequency (about 810 Hz) of tool-workpiece material structure. This signifies the
faults occurring in milling tool for the given workpiece material and process condition. Based on the
experimental results, following conclusions are drawn.
Time-series plots provide insufficient diagnostic information in vibration signals of different
tool condition.
Spectrum plots are used to detect faults in milling tool, it only gives information about
frequency component of vibration signals as a dominant peak and does not provide time
information about faults.
In cepstrum plots, it is very much useful to assess defect quefrency of milling tool and it was
observed that amplitude of this quefrency varies with the increase in fault level.
CWT plots with vibration signals provide enough information about faults in milling tool in
(d) Breakage
17. Madhusudana C. K., Hemantha Kumar, Narendranath S/ Journal of Vibration Analysis, Measurement, and Control
(2016) Vol. 4 No. 1 pp. 10-28
26
both time and frequency domain.
Based on the results obtained, it can be judged that cepstrum and CWT are recommended for
practical applications in fault detection of the face milling tool.
Acknowledgement
The authors acknowledge the support from SOLVE: The Virtual Lab @ NITK, Surathkal
(www.solve.nitk.ac.in) for providing experimental facility.
References
Abouelatta, O. B., and Madl, J. (2001). Surface roughness prediction based on cutting parameters and tool
vibrations in turning operations. Journal of materials processing technology, 118(1), 269-277.
http://dx.doi.org/10.1016/S0924-0136(01)00959-1
Antonialli, A. I. S., Diniz, A. E., and Pederiva, R. (2010). Vibration analysis of cutting force in titanium alloy
milling. International Journal of Machine Tools and Manufacture, 50(1), 65-74.
http://dx.doi.org/10.1016/j.ijmachtools.2009.09.006
Bisu, C. F., Zapciu, M., Cahuc, O., Gérard, A., and Anica, M. (2012). Envelope dynamic analysis: a new approach
for milling process monitoring. The International Journal of Advanced Manufacturing Technology, 62(5-8),
471-486.
http://dx.doi.org/10.1007/s00170-011-3814-4
Hasegawa-Johnson, M. (2000). Lecture notes in speech production, speech coding, and speech recognition.
Class notes, University of Illinois at Urbana-Champaign, Fall, Chicago.
Hsieh, W. H., Lu, M. C., and Chiou, S. J. (2012). Application of backpropagation neural network for spindle
vibration-based tool wear monitoring in micro-milling. The International Journal of Advanced
Manufacturing Technology, 61(1-4), 53-61.
http://dx.doi.org/10.1007/s00170-011-3703-x
Huang, P., Li, J., Sun, J., and Ge, M. (2012). Milling force vibration analysis in high-speed-milling titanium alloy
using variable pitch angle mill. The International Journal of Advanced Manufacturing Technology, 58(1-4),
153-160.
http://dx.doi.org/10.1007/s00170-011-3380-9
Huang, P., Li, J., Sun, J., and Zhou, J. (2013). Vibration analysis in milling titanium alloy based on signal
processing of cutting force. The International Journal of Advanced Manufacturing Technology, 64(5-8),
613-621.
http://dx.doi.org/10.1007/s00170-012-4039-x
18. Madhusudana C. K., Hemantha Kumar, Narendranath S/ Journal of Vibration Analysis, Measurement, and Control
(2016) Vol. 4 No. 1 pp. 10-28
27
Lee, B. Y., and Tarng, Y. S. (1999). Milling cutter breakage detection by the discretewavelet transform.
Mechatronics, 9(3), 225-234.
http://dx.doi.org/10.1016/S0957-4158(98)00049-X
Li, W., Gong, W., Obikawa, T., and Shirakashi, T. (2005). A method of recognizing tool-wear states based on a fast
algorithm of wavelet transform. Journal of materials processing technology, 170(1), 374-380.
http://dx.doi.org/10.1016/j.jmatprotec.2005.05.018
Li, X., and Guan, X. P. (2004). Time-frequency-analysis-based minor cutting edge fracture detection during end
milling. Mechanical Systems and Signal Processing, 18(6), 1485-1496.
http://dx.doi.org/10.1016/S0888-3270(03)00096-7
Mori, K., Kasashima, N., Fu, J. C., and Muto, K. (1999). Prediction of small drill bit breakage by wavelet
transforms and linear discriminant functions. International Journal of Machine Tools and Manufacture,
39(9), 1471-1484.
http://dx.doi.org/10.1016/S0890-6955(99)00004-8
Orhan, S., Er, A. O., Camuşcu, N., and Aslan, E. (2007). Tool wear evaluation by vibration analysis during end
milling of AISI D3 cold work tool steel with 35 HRC hardness. NDT and E International, 40(2), 121-126.
http://dx.doi.org/10.1016/j.ndteint.2006.09.006
Peng, Z. K., and Chu, F. L. (2004). Application of the wavelet transform in machine condition monitoring and
fault diagnostics: a review with bibliography. Mechanical systems and signal processing, 18(2), 199-221.
http://dx.doi.org/10.1016/S0888-3270(03)00075-X
Randall, R. B. (1982). Cepstrum analysis and gearbox fault-diagnosis. Maintenance Management International,
3(3), 183-208.
Sivasakthivel, P. S., Velmurugan, V., and Sudhakaran, R. (2011). Prediction of vibration amplitude from
machining parameters by response surface methodology in end milling. The International Journal of
Advanced Manufacturing Technology, 53(5-8), 453-461.
http://dx.doi.org/10.1007/s00170-010-2872-3
Teti, R., Jemielniak, K., O'Donnell, G., and Dornfeld, D. (2010). Advanced monitoring of machining operations.
CIRP Annals-Manufacturing Technology, 59(2), 717-739.
http://dx.doi.org/10.1016/j.cirp.2010.05.010
Vernekar, K., Kumar, H., and Gangadharan, K. V. (2014). Gear Fault Detection Using Vibration Analysis and
Continuous Wavelet Transform. Procedia Materials Science, 5, 1846-1852.
http://dx.doi.org/10.1016/j.mspro.2014.07.492
Yao, Z., Mei, D., and Chen, Z. (2010). On-line chatter detection and identification based on wavelet and support
vector machine. Journal of Materials Processing Technology, 210(5), 713-719.
http://dx.doi.org/10.1016/j.jmatprotec.2009.11.007
Zhu, K., San Wong, Y., and Hong, G. S. (2009). Wavelet analysis of sensor signals for tool condition monitoring: a
review and some new results. International Journal of Machine Tools and Manufacture, 49(7), 537-553.
19. Madhusudana C. K., Hemantha Kumar, Narendranath S/ Journal of Vibration Analysis, Measurement, and Control
(2016) Vol. 4 No. 1 pp. 10-28
28
http://dx.doi.org/10.1016/j.ijmachtools.2009.02.003
nd Manufacture, 49(7), 537-553.