Download as PDF, PPTX


![5 VictorRentea.ro
a training by
Join the European So3ware Cra3ers community at victorrentea.ro/community
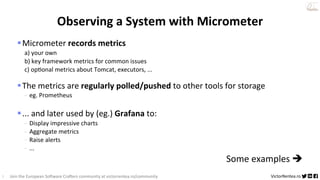
Micrometer
@Timed !// wraps the method with an aspect that monitors spent time
List<CommentDto> fetchComments(Long id) {
!// suspect code
}
then, in a Spring application
GET /actuator/prometheus returns:
method_timed_seconds_sum{method="fetchComments",} 100.0
method_timed_seconds_count{method="fetchComments",} 400
è avg = 0.25 s/call
sampled again after 5 seconds:
method_timed_seconds_sum{method="fetchComments",} 150.0 – 100 = 50 s
method_timed_seconds_count{method="fetchComments",} 500 – 400 = 100 calls
è avg = 50 s / 100 = 0.5 s/call (spike)
time
average[ms]
250
500](https://image.slidesharecdn.com/profiling-230920204425-aeeb3c1c/85/Profiling-your-Java-Application-5-320.jpg)


![45 VictorRentea.ro
a training by
Join the European Software Crafters community at victorrentea.ro/community
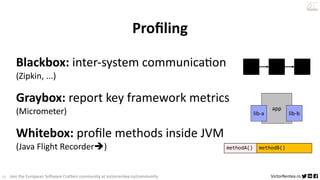
JFR Profiling – Lessons Learned
✅ "Sees" inside unknown code / library
❌ Can't see into naAve C code
⚠ 1 sample/second è requires load tests or ran in prod
✅ Can be used in produc5on (x-low overhead)
⚠ Tuning requires paAence, expectaAons, and library awareness
⚠ Sampling Biases and JIT-influenced if profiling CPU-bound code
❌ Cannot follow async calls/reacAve chains (change threads)
✅ Can record Virtual Threads[JEP-444 in Java 21 LTS]
and thread forking done using Structured Concurrency[JEP-428 in Java19+]](https://image.slidesharecdn.com/profiling-230920204425-aeeb3c1c/85/Profiling-your-Java-Application-37-320.jpg)


This document discusses Java application profiling, covering tools and techniques for identifying performance issues such as slow endpoint response times and connection starvation. It highlights the use of Micrometer for monitoring system metrics, Java Flight Recorder for profiling, and provides practical examples of how to implement these tools in applications. The content also addresses challenges in distributed systems and emphasizes the importance of proper profiling and monitoring for optimizing performance.