SlideShare a Scribd company logo
1 of 12
Download to read offline
Paris, Wednesday, August 29, 2012
First Half 2012 Results
Revenues: +17.7%
EBITDA: +27.2% to €180.8 million
Net income, group share: €17 million
"Against the backdrop of a continuing favorable market environment, BOURBON reports growth in
line with the BOURBON 2015 Leadership Strategy plan, as the positive impact of the increase in
average daily rates applies to an expanding fleet", says Christian Lefèvre, BOURBON's Chief
Executive Officer. "With the relative slowdown in the rate of commissioning of new vessels, our
focus is now more than ever on safety, operational excellence and cost control."
BOURBON Marine Services Subsea Services
H1 2012 Δ/H1 2011 H1 2012 Δ/H1 2011 H1 2012 Δ/H1 2011
Number of vessels
(end of period)
446 +22 vessels 428 +22 vessels 17 +0
in millions of euros
Revenues 568.0 +17.7% 460.4 +22.4% 92.1 +11.9%
EBITDA 180.8 +27.2% 142.6 +42.7% 34.9 +1.0%
EBIT 63.8 +48.2%
Deepwater
Offshore
Shallow
water
offshore
IMR
Total fleet
excl.
crewboats
Crewboats
Utilization rate
(in %)
H1 2012 91.9 88.5 87.7 89.7 78.9
H2 2011 92.1 87.5 92.7 89.8 80.9
H1 2011 87.5 87.5 94.2 88.2 80.8
Average daily rate
(in US$/d)
H1 2012 20,145 13,519 37,866 18,352 4,678
H2 2011 20,163 12,872 34,030 18,000 4,380
H1 2011 18,994 12,821 32,117 17,451 4,319
H1 2012 highlights
 With a satisfactory utilization rate, the growth in revenues reflects a favorable trend in rates
combined with a positive impact from the dollar, which enabled the Group to post a
disproportionate increase in earnings before interest and tax (EBIT) (+27.2% and +48.2%).
 The positive effects of BOURBON's cost-reduction strategy, especially for the Crewboats
segment, are apparent in the first half of the year, offsetting the impact of the many scheduled
classification dry-dock periods in Subsea Services.
 Net income, group share recovered to €17 million, from the €21.4 million loss in the first half of
2011.
2
Half-year results
in millions of euros H1 2012 H2 2011
Change
H1 2012 /
H2 2011
H1 2011
Change
H1 2012 /
H1 2011
Revenues 568.0 525.3 +8.1% 482.7 +17.7%
Gross operating income (EBITDA)
% of revenues
180.8
31.8%
158.2
30.1%
+14.3% 142.1
29.4%
+27.2%
Operating income (EBIT) 63.8 42.2 +51.0% 43.1 +48.2%
Financial profit/(loss) (32.3) (8.9) (62.7) -48.5%
Income tax (7.1) (3.8) +87.3% (6.9) +2.9%
Income from discontinued operations 0.8 (0.0) 0.5 +79.0%
Minority interests (8.3) (1.2) 4.5
Net income/(loss), Group share 17.0 28.2 -39.8% (21.4)
- Revenues
Compared to the first half of 2011, revenues are up 17.7% to €568 million, with a strong 20.5% overall increase
in Marine Services and Subsea Services. This growth mainly stems from the expansion of the fleet, particularly in
the Shallow water Offshore segment (with 12 more vessels than in H1 2011), the rise in average daily rates and
the firmer dollar exchange rate (14.5% at constant exchange rates).
Compared to the second half of 2011, revenues grew 8.1% (+3.9% at constant exchange rates), driven
essentially by the Shallow water Offshore and Crewboats segments, which gained 20.1% and 10.2%,
respectively. These gains primarily reflect the expansion of the fleet, the improvement in daily rates and the firmer
dollar.
The sharp increase in average daily rates in Subsea Services more than offset the impact of Classification
dry-dock periods.
- Gross operating income (EBITDA)
Compared to the first half of 2011, at €180.8 million, gross operating income (EBITDA) for the first half of 2012
was up 27.2%. This increase is clearly above the gain in revenues, since EBITDA reflects the impact of price
increases combined with the strengthening of the dollar, which was however moderated somewhat by cost
inflation. The improvement in EBITDA stems exclusively from Marine Services, while Subsea Services EBITDA
remained stable, despite the numerous Classification dry-dock periods.
Compared to the second half of 2011, the 14.3% gain in EBITDA was substantially higher than the rise in
revenues, reflecting the impact of price increases and the strengthening of the dollar. The increase is mainly due
to the Shallow water Offshore vessels and Crewboats segments.
- Earnings before interest and tax (EBIT)
Compared to the first half of 2011, at €63.8 million, EBIT for H1 2012 increased 48.2%. As for EBITDA above,
the improvement in daily rates combined with the stronger dollar explain this growth rate, largely surpassing the
gain in revenues. This robust increase is mainly due to the performance of the Deepwater Offshore vessels and
Crewboats segments.
Compared to the second half of 2011, EBIT is up 51%.
- Financial income / (loss)
In the first half of the year, financial loss amounted to a net charge of €32.3 million for a cost of net debt of
€33.7 million.
The change in currency exchange rates generated net financial income of €2.3 million. Note that the change in
foreign exchange rates in H1 2011 resulted in a €30.5 million loss and a €29.2 million gain in H2 2011.
- Net income / (loss), Group share
Net income, Group share was positive at €17 million, compared to a €21.4 million loss in the same period the
previous year. This marked improvement reflects the growth in EBIT and the absence of foreign exchange losses.
3
 MARINE SERVICES
H1 2012 H2 2011
Change
H1 2012 /
H2 2011
H1 2011
Change
H1 2012 /
H1 2011
Number of vessels (end of period) 428 418 +10 406 +22
Utilization rate 83.2% 84.3% -1.1 pt 83.4% -0.2 pt
in millions of euros H1 2012 H2 2011
Change
H1 2012 /
H2 2011
H1 2011
Change
H1 2012 /
H1 2011
Revenues 460.4 416.8 +10.5% 376.1 +22.4%
Direct costs (269.7) (255.4) +5.6% (233.4) +15.6%
Operating margin 190.8 161.4 +18.2% 142.8 +33.6%
General and administrative costs (48.2) (40.3) +19.5% (42.9) +12.4%
Gross operating income (EBITDA) 142.6 121.5 +17.4% 100.0 +42.7%
% of revenues 31.0% 29.1% 26.6%
Compared to the first half of 2011, Marine Services revenues increased 22.4% to €460.4 million, with growth
driven by the higher rates, especially in Deepwater Offshore, the expansion of the fleet, particularly the Shallow
water Offshore fleet, and the firmer dollar. At €142.6 million, H1 EBITDA rose a steep 42.7%, almost twice the rate
of growth of revenues. Profitability measured by the “EBITDA to average capital employed excluding installments”
ratio improved by 3.3 percentage points to 12.9%. The three segments, Deepwater Offshore, Shallow water
Offshore and Crewboats all contributed to this improvement.
Revenues gained 10.5%, compared to the second half of 2011, primarily due to the higher rates in the Shallow
water Offshore and Crewboats segments, combined with the favorable impact of foreign exchange rates. EBITDA
increased 17.4%.
Results by segment
 Deepwater Offshore vessels
H1 2012 H2 2011
Change
H1 2012 /
H2 2011
H1 2011
Change
H1 2012 /
H1 2011
Number of vessels (end of period) 71 70 +1 vessel 70 +1 vessel
Utilization rate 91.9% 92.1% -0.2 pt 87.5% +4.4 pts
in millions of euros H1 2012 H2 2011
Change
H1 2012 /
H2 2011
H1 2011
Change
H1 2012 /
H1 2011
Revenues 175.0 169.2 +3.4% 149.2 +17.3%
Direct costs (94.0) (91.1) +3.2% (83.4) +12.7%
Operating margin 81.1 78.2 +3.7% 65.8 +23.2%
General and administrative costs (18.3) (16.4) +11.6% (17.0) +7.7%
Gross operating income (EBITDA) 62.8 61.8 +1.6% 48.8 +28.6%
% of revenues 35.9% 36.5% 32.7%
Compared to the first half of the previous year, revenues for the period from Deepwater Offshore vessels were
up 17.3% to €175 million, due primarily to improved rates and a stronger dollar, and, to a lesser extent, a higher
utilization rate at 91.9%. EBITDA increased at a stronger rate than revenues to €62.8 million, a 28.6% increase.
Compared to the second half of 2011, revenues and EBITDA increased slightly (by 3.4% and 1.6%,
respectively).
4
 Shallow water Offshore
H1 2012 H2 2011
Change
H1 2012 /
H2 2011
H1 2011
Change
H1 2012 /
H1 2011
Number of vessels (end of period) 97 91 +6 vessels 85 +12 vessels
Utilization rate 88.5% 87.5% +1 pt 87.5% +1 pt
in millions of euros H1 2012 H2 2011
Change
H1 2012 /
H2 2011
H1 2011
Change
H1 2012 /
H1 2011
Revenues 153.8 128.1 +20.1% 113.3 +35.7%
Direct costs (97.5) (84.2) +15.8% (72.0) +35.4%
Operating margin 56.4 43.9 +28.3% 41.4 +36.4%
General and administrative costs (16.1) (12.4) +29.7% (12.9) +24.6%
Gross operating income (EBITDA) 40.4 31.9 +26.7% 28.4 +42.1%
% of revenues 26.3% 24.9% 25.1%
Compared to the first half of 2011, revenues for the period from Shallow water Offshore vessels increased
35.7% to reach €153.8 million, mainly driven by the expansion of the fleet (+12 vessels in the past 12 months), the
firmer dollar and the upturn in rates.
First-half EBITDA for the segment totaled €40.4 million, up 42.1%, proportionately outstripping the growth in
revenues.
Compared to the second half of 2011, revenues for the period for this segment rose 20.1%, reaping the benefits
of these same impacts. EBITDA increased 26.7% for the second half of the year.
Crewboats
H1 2012 H2 2011
Change
H1 2012 /
H2 2011
H1 2011
Change
H1 2012 /
H1 2011
Number of vessels (end of period) 260 257 +3 vessels 251 +9 vessels
Utilization rate 78.9% 80.9% -2 pts 80.8% -1.9 pt
in millions of euros H1 2012 H2 2011
Change
H1 2012 /
H2 2011
H1 2011
Change
H1 2012 /
H1 2011
Revenues 131.6 119.4 +10.2% 113.6 +15.8%
Direct costs (78.3) (80.2) -2.3% (78.0) +0.3%
Operating margin 53.3 39.3 +35.7% 35.6 +49.7%
General and administrative costs (13.8) (11.5) +19.7% (12.9) +6.3%
Gross operating income (EBITDA) 39.4 27.8 +42.4% 22.7 +73.6%
% of revenues 30.0% 23.3% 20.0%
Compared to the first half of 2011, revenues for the Crewboats segment reached €131.6 million, up 15.8%
thanks to the improvement in rates, the stronger dollar and the expansion of the fleet (+9 vessels in the past
12 months).
Rising by a steep 73.6%, EBITDA was €39,4 million, buoyed by the increase in revenues and excellent cost
control.
Compared to the second half of 2011, revenues for the period for this segment increased 10.2%, mainly due to
the higher rates. EBITDA for the second half of the year rose 42.4% for the same reasons.
5
 SUBSEA SERVICES
H1 2012 H2 2011
Change
H1 2012 /
H2 2011
H1 2011
Change
H1 2012 /
H1 2011
Number of vessels (end of period) 17 18 -1 vessel 17 -
Utilization rate 87.7% 92.7% -5 pts 94.2% -6.5 pts
in millions of euros H1 2012 H2 2011
Change
H1 2012 /
H2 2011
H1 2011
Change
H1 2012 /
H1 2011
Revenues 92.1 90.4 +1.9% 82.4 +11.9%
Direct costs (47.6) (48.8) -2.5% (38.7) +23.0%
Operating margin 44.5 41.6 +7.1% 43.7 +2.0%
General and administrative costs (9.6) (8.7) +10.3% (9.4) +2.7%
Gross operating income (EBITDA) 34.9 32.9 +6.0% 34.6 +1.0%
% of revenues 37.9% 36.4% 42.0%
Compared to the first half of 2011, revenues posted by Subsea Services for the period rose 11.9% to
€92.1 million, while EBITDA remained practically stable. As a result, the ratio of EBITDA to Revenues dipped
slightly from 42% to 37.9%.
Profitability measured by the “EBITDA to average capital employed excluding installments” ratio was 15.1%.
Compared to the second half of 2011, revenues improved very slightly, by 1.9%, as the positive impact of the
stronger dollar and the increase in rates was largely offset by the effect of Classification dry-dock periods. EBITDA
increased 6.0% due to good cost control.
To recap, two "small" IMR vessels were transferred from Subsea Services to Marine Services, and one
well-stimulation vessel was transferred from Marine Services to Subsea Services.
 OTHER
in millions of euros H1 2012 H2 2011
Change
H1 2012 /
H2 2011
H1 2011
Change
H1 2012 /
H1 2011
Revenues 15.4 18.1 -15.0% 24.2 -36.3%
Direct costs (11.4) (13.7) -16.6% (15.9) -28.4%
Operating margin 4.0 4.4 -10.2% 8.2 -51.6%
General and administrative costs (0.7) (0.7) +5.7% (0.7) +8.3%
Gross operating income (EBITDA) 3.3 3.8 -13.1% 7.6 -56.8%
% of revenues 21.2% 20.8% 31.3%
“Other” mainly includes the business from the cement carrier Endeavor, externally chartered offshore vessels, as
well as items not included in the two other Activities. The decline in revenues and EBITDA reflects the slowdown
in external chartering in the Offshore activities.
6
 OUTLOOK
Despite the continued uncertainty surrounding global economies, investments by oil and gas sector clients
continue to be backed by the price per barrel (US$113 on average for the first half of the year), while demand for
offshore service vessels is predicted to increase over the next two years.
Orders for drilling rigs due to be commissioned in the next few years and the order books of offshore construction
companies are set to stimulate demand for vessels.
In Shallow water Offshore, accelerating the process of replacing older vessels (deemed obsolete) on the market
seems vital in order to meet the increasingly stringent risk management demands of oil and gas companies.
Clients will continue to favor innovative, high-productivity vessels, which is where BOURBON’s fleet of vessels is
particularly appreciated. The global Deepwater Offshore fleet continues to increase with new orders for "large"
PSVs. In line with its strategy of taking into account the risk of over-capacity, BOURBON has very limited
exposure to this market and concentrates on medium-sized vessels, for which demand remains strong in
international markets.
BOURBON's earnings are influenced by the €/US$ exchange rate. Accordingly, BOURBON set up €/US$ hedging
contracts to cover the entirety of its estimated EBITDA exposure in 2012. These dollar forward sales were made
at an average exchange rate of €1 = US$1.3070.
 ADDITIONAL INFORMATION
- In August 2012, typhoon Haikui struck China, affecting the construction of 15 vessels in Sinopacific's
shipyards in Zhejiang. The estimated delay for delivery and transfer of title to BOURBON of these vessels is
five to six months.
- The accounts for the first half of 2012 were closed by the Board of Directors on Monday, August 27, 2012.
- The accounts for the first half of 2012 underwent a limited examination by the statutory auditors.
 FINANCIAL CALENDAR
- Publication of Q3 2012 Revenues November 7, 2012
- Publication of Q4 and
full-year 2012 Revenues February 6, 2013
- Presentation of 2012 Annual Results March 6, 2013
The financial data related to the results for H1 2012 include this press release as well as the presentation
of the press conference, which will be available on the Group's website on August 29, 2012 at 12:00pm, at
the end of the press conference scheduled for this date.
View the press conference live or recorded on our website, www.bourbon-online.com
7
APPENDIX I
Simplified consolidated balance sheet
in millions of euros
6/30/2012 12/31/2011 6/30/2012 12/31/2011
Shareholders’ equity 1,387 1,417
Net property, plant and
equipment
3,319 3,244 Financial debt > 1 year 1,502 1,565
Other
Non-current assets
99 101
Other
Non-current liabilities
140 134
TOTAL
NON-CURRENT
ASSETS
3,418 3,345
TOTAL
NON-CURRENT
LIABILITIES
1,642 1,699
Other current assets 518 484 Financial debt < 1 year 734 620
Cash on hand and in
banks
185 230 Other current liabilities 358 323
TOTAL CURRENT
ASSETS
703 714
TOTAL CURRENT
LIABILITIES
1,092 943
Non-current assets held
for sale
- -
Non-current liabilities held
for sale
- -
TOTAL ASSETS 4,121 4,059 TOTAL LIABILITIES 4,121 4,059
8
APPENDIX II
Consolidated Cash Flow Statement
in millions of euros
H1 2012 H1 2011
Consolidated net income (loss) 25.3 (25.9)
Cash flow (*) 145.5 86.1
Net cash flow from operating activities(*)
168.1 64.0
Net cash flow consumed by investing activities (*)
Of which acquisition of property, plant and equipment and intangible
assets
Of which sale of property, plant and equipment and intangible assets
(165.6)
1.2
(164.1)
(166.9)
31.0
(121.5)
Net cash flow from/(consumed by) financing activities(*)
Of which increase (decrease) in borrowings
Of which dividends paid to shareholders of the group
Of which net financial interest paid
(81.2)
(53.3)
(33.7)
(167.0)
(15.1)
(53.2)
(30.2)
(98.6)
Impact from the change in exchange rates (0.0) (2.5)
Net cash increase (decrease) (163.0) (158.7)
Net cash at beginning of period
Net cash at end of period
Net cash increase (decrease)
(44.0)
(207.0)
(163.0)
(61.1)
(219.7)
(158.7)
* Including discontinued operations
9
APPENDIX III
Quarterly revenue breakdown
(In € millions)
2012 2011
Q2 Q1 Q4 Q3 Q2 Q1
Marine Services 238.4 222.1 216.5 200.3 191.1 185.1
Deepwater offshore vessels 88.5 86.5 87.5 81.7 74.4 74.8
Shallow water offshore vessels 83.4 70.5 66.6 61.5 58.9 54.4
Crewboats 66.4 65.1 62.4 57.0 57.8 55.8
Subsea Services
IMR vessels 46.4 45.7 48.1 42.3 41.6 40.7
Other 5.2 10.2 8.5 9.6 14.5 9.7
GROUP TOTAL 290.0 278.0 273.1 252.2 247.2 235.5
Quarterly average utilization rates for the BOURBON offshore fleet
(in %)
2012 2011
Q2 Q1 Q4 Q3 Q2 Q1
Deepwater offshore vessels 91.3 92.5 93.7 90.2 86.9 88.1
Shallow water offshore vessels 92.5 84.3 88.3 86.4 90.2 84.8
Crewboats 78.6 81.0 82.1 79.7 81.4 80.5
Marine Services average utilization rate 83.9 83.7 85.5 83.0 84.2 82.7
Subsea Services average utilization rate 89.7 85.7 91.0 94.0 96.3 92.0
Total fleet excluding Crewboats average
utilization rate
91.8 87.6 90.7 88.7 89.5 86.9
Total fleet average utilization rate 84.0 83.7 85.7 83.4 84.7 83.1
Quarterly average daily rates for the BOURBON offshore fleet
(in US$/day)
2012 2011
Q2 Q1 Q4 Q3 Q2 Q1
Deepwater offshore vessels 20,480 20,011 20,222 20,547 19,154 18,835
Shallow water offshore vessels 13,773 13,290 12,681 13,179 12,883 12,653
Crewboats 4,763 4,447 4,349 4,409 4,361 4,263
IMR vessels 38,018 38,181 34,516 33,822 32,379 31,842
Total fleet excluding Crewboats average
daily rate
18,526 18,309 17,965 18,303 17,498 17,354
Quarterly commissioning of vessels
(in number of vessels)
2012 2011
Q2 Q1 Q4 Q3 Q2 Q1
TOTAL FLEET 6 8 3 15 11 10
Marine Services 6 8 2 15 11 10
Deepwater Offshore vessels
Shallow water Offshore
Crewboats
2
1
3
0
3
5
0
1
1
0
6
9
1
5
5
0
3
7
Subsea Services / IMR 0 0 1 0 0 0
10
Half-year revenue breakdown
(In € millions)
2012 2011
H1 H2 H1
Marine Services 460.4 416.8 376.1
Deepwater Offshore vessels 175.0 169.2 149.2
Shallow water Offshore 153.8 128.1 113.3
Crewboats 131.6 119.4 113.6
Subsea Services
IMR vessels 92.1 90.4 82.4
Other 15.4 18.1 24.2
GROUP TOTAL 568.0 525.3 482.7
Half-year average utilization rates for the BOURBON offshore fleet
(in %)
2012 2011
H1 H2 H1
Deepwater Offshore vessels 91.9 92.1 87.5
Shallow water Offshore 88.5 87.5 87.5
Crewboats 78.9 80.9 80.8
Marine Services average utilization rate 83.2 84.3 83.4
Subsea Services average utilization rate 87.7 92.7 94.2
Total fleet excluding Crewboats average
utilization rate
89.7 89.8 88.2
Total fleet average utilization rate 83.3 84.6 83.8
Half-year average daily rates for the BOURBON offshore fleet
(in US$/day)
2012 2011
H1 H2 H1
Deepwater Offshore vessels 20,145 20,163 18,994
Shallow water Offshore 13,519 12,872 12,821
Crewboats 4,678 4,380 4,319
IMR vessels 37,866 34,030 32,117
Total fleet excluding Crewboats average
utilization rate
18,352 18,000 17,451
Half-year commissioning of vessels
(in number of vessels)
2012 2011
H1 H2 H1
TOTAL FLEET 14 18 21
Marine Services 14 17 21
Deepwater Offshore vessels
Shallow water Offshore
Crewboats
2
4
8
0
7
10
1
8
12
Subsea Services / IMR 0 1 0
11
Breakdown of BOURBON revenues by geographical region
Second quarter First half
(In € millions) Q2 2012 Q2 2011 Change H1 2012 H1 2011 Change
Africa 176.9 147.9 19.6% 356.2 298.7 19.2%
Europe & Mediterranean/Middle East 50.2 50.8 -1.0% 96.3 88.3 9.1%
American Continent 36.6 29.4 24.2% 70.4 59.4 18.4%
Asia 26.3 19.0 38.2% 45.1 36.2 24.4%
Other key indicators
Quarterly breakdown
2012 2011
Q2 Q1 Q4 Q3 Q2 Q1
Average €/US$ exchange rate for the quarter
(in €)
1.28 1.31 1.35 1.41 1.44 1.37
€/US$ exchange rate at closing (in €) 1.26 1.34 1.29 1.35 1.45 1.42
Average price of Brent for the quarter (in
US$/bbl)
108 119 109 113 117 105
Half-yearly breakdown
2012 2011
H1 H2 H1
Average €/US$ exchange rate for the half year
(in €)
1.30 1.38 1.40
€/US$ exchange rate at closing (in €) 1.26 1.29 1.45
Average price of Brent for the half year (in
US$/bbl)
113 111 111
12
About BOURBON
BOURBON offers the most demanding oil and gas companies a comprehensive range of surface and subsea marine services
for offshore oil and gas fields and wind farms, based on a extensive range of latest-generation vessels. The Group provides a
local service through its 27 operating subsidiaries, close to clients and their operations, guaranteeing the highest standards of
service quality and safety worldwide.
BOURBON has two Businesses (Marine Services and Subsea Services) and also protects the French coastline for the
French Navy.
Under the "BOURBON 2015 Leadership Strategy" plan, the Group is investing in a large fleet of innovative and high-
performance offshore vessels built in series.
In 2011, BOURBON posted revenues of €1.008 billion and operated a fleet of 446 vessels as of June 30, 2012.
Classified by ICB (Industry Classification Benchmark) in the “Oil Services” sector, BOURBON is listed for trading on Euronext
Paris, Compartment A, participates in the Deferred Settlement Service (“SRD”) and is included in the SBF 120, CAC Mid 60
and Dow Jones Stoxx 600 indices.
CONTACTS
Publicis Consultants
Jérôme Goaer +33 (0)1 44 82 46 24 - jerome.goaer@consultants.publicis.fr
Véronique Duhoux +33 (0)1 44 82 46 33 - veronique.duhoux@consultants.publicis.fr
Vilizara Lazarova +33 (0)1 44 82 46 34 - vilizara.lazarova@consultants.publicis.fr
BOURBON
Investors - Analysts – Shareholders Relations
Patrick Mangaud +33 (0)1 40 13 86 09 - patrick.mangaud@bourbon-online.com
Corporate Communication
Christa Roqueblave +33 (0)1 40 13 86 06 - christa.roqueblave@bourbon-online.com
www.bourbon-online.com

More Related Content

What's hot

Press release H1 2015
Press release H1 2015Press release H1 2015
Press release H1 2015Hera Group
 
Press release H1 2011 Hera Group
Press release H1 2011 Hera GroupPress release H1 2011 Hera Group
Press release H1 2011 Hera GroupHera Group
 
Elringklinger - Conference Call Q2 2014
Elringklinger - Conference Call Q2 2014Elringklinger - Conference Call Q2 2014
Elringklinger - Conference Call Q2 2014Company Spotlight
 
Hera Group approves results as at 31/12/2015
Hera Group approves results as at 31/12/2015Hera Group approves results as at 31/12/2015
Hera Group approves results as at 31/12/2015Hera Group
 
AkzoNobel Q1 2012 Investor Presentation
AkzoNobel Q1 2012 Investor PresentationAkzoNobel Q1 2012 Investor Presentation
AkzoNobel Q1 2012 Investor PresentationAkzoNobel
 
Kloeckner & Co Analysts and Investor Presentation 3rd Quarter results 2014
Kloeckner & Co Analysts and Investor Presentation 3rd Quarter results 2014Kloeckner & Co Analysts and Investor Presentation 3rd Quarter results 2014
Kloeckner & Co Analysts and Investor Presentation 3rd Quarter results 2014Klöckner & Co SE
 
ACCIONA H1 2015 results
ACCIONA H1 2015 resultsACCIONA H1 2015 results
ACCIONA H1 2015 resultsacciona
 
FY2014 and 2015-2019 Strategic Plan (26 marzo 2015)
FY2014 and 2015-2019 Strategic Plan (26 marzo 2015)FY2014 and 2015-2019 Strategic Plan (26 marzo 2015)
FY2014 and 2015-2019 Strategic Plan (26 marzo 2015)Terna SpA
 
Tom tom 2014 q2 2014 results presentation
Tom tom 2014 q2 2014 results presentationTom tom 2014 q2 2014 results presentation
Tom tom 2014 q2 2014 results presentationLudovic Privat
 
2015 Half-Year Results
2015 Half-Year Results2015 Half-Year Results
2015 Half-Year ResultsWolters Kluwer
 
Generali Group 2015 First Half Results
Generali Group 2015 First Half ResultsGenerali Group 2015 First Half Results
Generali Group 2015 First Half ResultsGenerali
 
Klöckner & Co - German Industrial Opportunities
Klöckner & Co - German Industrial OpportunitiesKlöckner & Co - German Industrial Opportunities
Klöckner & Co - German Industrial OpportunitiesKlöckner & Co SE
 
Snam 2019 - 1 H Results
Snam 2019 - 1 H ResultsSnam 2019 - 1 H Results
Snam 2019 - 1 H ResultsSnam
 
Half-Year Financial Report 2018/19
Half-Year Financial Report 2018/19Half-Year Financial Report 2018/19
Half-Year Financial Report 2018/19AT&S_IR
 
ERG - Fourth Quarter and 2012 Results
ERG - Fourth Quarter and 2012 ResultsERG - Fourth Quarter and 2012 Results
ERG - Fourth Quarter and 2012 ResultsERG S.p.A.
 
2014 Full-Year Results
2014 Full-Year Results2014 Full-Year Results
2014 Full-Year ResultsWolters Kluwer
 

What's hot (18)

Press release H1 2015
Press release H1 2015Press release H1 2015
Press release H1 2015
 
Press release H1 2011 Hera Group
Press release H1 2011 Hera GroupPress release H1 2011 Hera Group
Press release H1 2011 Hera Group
 
Elringklinger - Conference Call Q2 2014
Elringklinger - Conference Call Q2 2014Elringklinger - Conference Call Q2 2014
Elringklinger - Conference Call Q2 2014
 
Cs be2010
Cs be2010Cs be2010
Cs be2010
 
Hera Group approves results as at 31/12/2015
Hera Group approves results as at 31/12/2015Hera Group approves results as at 31/12/2015
Hera Group approves results as at 31/12/2015
 
AkzoNobel Q1 2012 Investor Presentation
AkzoNobel Q1 2012 Investor PresentationAkzoNobel Q1 2012 Investor Presentation
AkzoNobel Q1 2012 Investor Presentation
 
Kloeckner & Co Analysts and Investor Presentation 3rd Quarter results 2014
Kloeckner & Co Analysts and Investor Presentation 3rd Quarter results 2014Kloeckner & Co Analysts and Investor Presentation 3rd Quarter results 2014
Kloeckner & Co Analysts and Investor Presentation 3rd Quarter results 2014
 
Transnet annual results 2015
Transnet annual results 2015Transnet annual results 2015
Transnet annual results 2015
 
ACCIONA H1 2015 results
ACCIONA H1 2015 resultsACCIONA H1 2015 results
ACCIONA H1 2015 results
 
FY2014 and 2015-2019 Strategic Plan (26 marzo 2015)
FY2014 and 2015-2019 Strategic Plan (26 marzo 2015)FY2014 and 2015-2019 Strategic Plan (26 marzo 2015)
FY2014 and 2015-2019 Strategic Plan (26 marzo 2015)
 
Tom tom 2014 q2 2014 results presentation
Tom tom 2014 q2 2014 results presentationTom tom 2014 q2 2014 results presentation
Tom tom 2014 q2 2014 results presentation
 
2015 Half-Year Results
2015 Half-Year Results2015 Half-Year Results
2015 Half-Year Results
 
Generali Group 2015 First Half Results
Generali Group 2015 First Half ResultsGenerali Group 2015 First Half Results
Generali Group 2015 First Half Results
 
Klöckner & Co - German Industrial Opportunities
Klöckner & Co - German Industrial OpportunitiesKlöckner & Co - German Industrial Opportunities
Klöckner & Co - German Industrial Opportunities
 
Snam 2019 - 1 H Results
Snam 2019 - 1 H ResultsSnam 2019 - 1 H Results
Snam 2019 - 1 H Results
 
Half-Year Financial Report 2018/19
Half-Year Financial Report 2018/19Half-Year Financial Report 2018/19
Half-Year Financial Report 2018/19
 
ERG - Fourth Quarter and 2012 Results
ERG - Fourth Quarter and 2012 ResultsERG - Fourth Quarter and 2012 Results
ERG - Fourth Quarter and 2012 Results
 
2014 Full-Year Results
2014 Full-Year Results2014 Full-Year Results
2014 Full-Year Results
 

Viewers also liked

Press Release of the Horizon 2010
Press Release of the Horizon 2010Press Release of the Horizon 2010
Press Release of the Horizon 2010BOURBON
 
Press Release Strong first half 2009 results
Press Release Strong first half 2009 resultsPress Release Strong first half 2009 results
Press Release Strong first half 2009 resultsBOURBON
 
Press release quarterly financial results
Press release quarterly financial resultsPress release quarterly financial results
Press release quarterly financial resultsBOURBON
 
Press Release Second quarter 2010 revenues
Press Release Second quarter 2010 revenuesPress Release Second quarter 2010 revenues
Press Release Second quarter 2010 revenuesBOURBON
 
Horizon 2010 slideshow
Horizon 2010 slideshowHorizon 2010 slideshow
Horizon 2010 slideshowBOURBON
 
Press Release Horizon 2012
Press Release Horizon 2012 Press Release Horizon 2012
Press Release Horizon 2012 BOURBON
 
BOURBON Presentation to shareholders September 4, 2014
BOURBON Presentation to shareholders September 4, 2014BOURBON Presentation to shareholders September 4, 2014
BOURBON Presentation to shareholders September 4, 2014BOURBON
 
BOURBON factsheet 2014
BOURBON factsheet 2014BOURBON factsheet 2014
BOURBON factsheet 2014BOURBON
 
BOURBON 2015 Leadership Strategy slideshow
BOURBON 2015 Leadership Strategy slideshowBOURBON 2015 Leadership Strategy slideshow
BOURBON 2015 Leadership Strategy slideshowBOURBON
 
Presentation to shareholders sept 2015
Presentation to shareholders sept 2015Presentation to shareholders sept 2015
Presentation to shareholders sept 2015BOURBON
 
Transforming for beyond action plan and 2012 annual results
Transforming for beyond action plan and 2012 annual resultsTransforming for beyond action plan and 2012 annual results
Transforming for beyond action plan and 2012 annual resultsBOURBON
 
BOURBON's Fleet
BOURBON's FleetBOURBON's Fleet
BOURBON's FleetBOURBON
 

Viewers also liked (12)

Press Release of the Horizon 2010
Press Release of the Horizon 2010Press Release of the Horizon 2010
Press Release of the Horizon 2010
 
Press Release Strong first half 2009 results
Press Release Strong first half 2009 resultsPress Release Strong first half 2009 results
Press Release Strong first half 2009 results
 
Press release quarterly financial results
Press release quarterly financial resultsPress release quarterly financial results
Press release quarterly financial results
 
Press Release Second quarter 2010 revenues
Press Release Second quarter 2010 revenuesPress Release Second quarter 2010 revenues
Press Release Second quarter 2010 revenues
 
Horizon 2010 slideshow
Horizon 2010 slideshowHorizon 2010 slideshow
Horizon 2010 slideshow
 
Press Release Horizon 2012
Press Release Horizon 2012 Press Release Horizon 2012
Press Release Horizon 2012
 
BOURBON Presentation to shareholders September 4, 2014
BOURBON Presentation to shareholders September 4, 2014BOURBON Presentation to shareholders September 4, 2014
BOURBON Presentation to shareholders September 4, 2014
 
BOURBON factsheet 2014
BOURBON factsheet 2014BOURBON factsheet 2014
BOURBON factsheet 2014
 
BOURBON 2015 Leadership Strategy slideshow
BOURBON 2015 Leadership Strategy slideshowBOURBON 2015 Leadership Strategy slideshow
BOURBON 2015 Leadership Strategy slideshow
 
Presentation to shareholders sept 2015
Presentation to shareholders sept 2015Presentation to shareholders sept 2015
Presentation to shareholders sept 2015
 
Transforming for beyond action plan and 2012 annual results
Transforming for beyond action plan and 2012 annual resultsTransforming for beyond action plan and 2012 annual results
Transforming for beyond action plan and 2012 annual results
 
BOURBON's Fleet
BOURBON's FleetBOURBON's Fleet
BOURBON's Fleet
 

Similar to Press Release First Half 2012 Results

The complete presentation “First half 2011 results”
 The complete presentation “First half 2011 results” The complete presentation “First half 2011 results”
The complete presentation “First half 2011 results”BOURBON
 
Analyst presentation: first Half 2008 Results
Analyst presentation: first Half 2008 ResultsAnalyst presentation: first Half 2008 Results
Analyst presentation: first Half 2008 ResultsHera Group
 
2015 Combined meeting
2015 Combined meeting2015 Combined meeting
2015 Combined meetingvefinance
 
Press release q1 2011
Press release q1 2011Press release q1 2011
Press release q1 2011Hera Group
 
Eni 2011 4Q Results and full year results (unaudited)
Eni 2011 4Q Results and full year results (unaudited)Eni 2011 4Q Results and full year results (unaudited)
Eni 2011 4Q Results and full year results (unaudited)Eni
 
ACCIONA Q1 2015 Results Report
ACCIONA Q1 2015 Results ReportACCIONA Q1 2015 Results Report
ACCIONA Q1 2015 Results Reportacciona
 
Analyst presentation 1Q 2017
Analyst presentation 1Q 2017Analyst presentation 1Q 2017
Analyst presentation 1Q 2017Hera Group
 
Hera Group press release h1 2008 results
Hera Group press release h1 2008 resultsHera Group press release h1 2008 results
Hera Group press release h1 2008 resultsHera Group
 
Analyst presentation: first Half 2009 Results
Analyst presentation: first Half 2009 ResultsAnalyst presentation: first Half 2009 Results
Analyst presentation: first Half 2009 ResultsHera Group
 
Wessanen q1 2014 analyst&investor meeting 25 april
Wessanen q1 2014 analyst&investor meeting 25 aprilWessanen q1 2014 analyst&investor meeting 25 april
Wessanen q1 2014 analyst&investor meeting 25 aprilKlaus Arntz
 
Press Release Annual results 2010
Press Release Annual results 2010Press Release Annual results 2010
Press Release Annual results 2010BOURBON
 
Hera’s Board of Directors approves the results for the third quarter of 2015
Hera’s Board of Directors approves the results for the third quarter of 2015Hera’s Board of Directors approves the results for the third quarter of 2015
Hera’s Board of Directors approves the results for the third quarter of 2015Hera Group
 
Analyst presentation H1 2015
 Analyst presentation H1 2015 Analyst presentation H1 2015
Analyst presentation H1 2015Hera Group
 
Analyst presentation H1 2018
Analyst presentation H1 2018Analyst presentation H1 2018
Analyst presentation H1 2018Hera Group
 
AT&S Quarterly Financial Report Q1 2018/19
AT&S Quarterly Financial Report Q1 2018/19AT&S Quarterly Financial Report Q1 2018/19
AT&S Quarterly Financial Report Q1 2018/19AT&S_IR
 
Eni Interim Consolidated Report, July 29th, 2011
Eni Interim Consolidated Report, July 29th, 2011Eni Interim Consolidated Report, July 29th, 2011
Eni Interim Consolidated Report, July 29th, 2011Eni
 
Deutsche EuroShop | Quarterly Statement 9M 2017
Deutsche EuroShop | Quarterly Statement 9M 2017 Deutsche EuroShop | Quarterly Statement 9M 2017
Deutsche EuroShop | Quarterly Statement 9M 2017 Deutsche EuroShop AG
 
3M results 2012
3M results 20123M results 2012
3M results 2012Ageas
 
140212 Presentation Financial Analysts En
140212   Presentation Financial Analysts En140212   Presentation Financial Analysts En
140212 Presentation Financial Analysts Enjohnvandepar
 
Analyst presentation 1Q 2008 Results
Analyst presentation 1Q 2008 ResultsAnalyst presentation 1Q 2008 Results
Analyst presentation 1Q 2008 ResultsHera Group
 

Similar to Press Release First Half 2012 Results (20)

The complete presentation “First half 2011 results”
 The complete presentation “First half 2011 results” The complete presentation “First half 2011 results”
The complete presentation “First half 2011 results”
 
Analyst presentation: first Half 2008 Results
Analyst presentation: first Half 2008 ResultsAnalyst presentation: first Half 2008 Results
Analyst presentation: first Half 2008 Results
 
2015 Combined meeting
2015 Combined meeting2015 Combined meeting
2015 Combined meeting
 
Press release q1 2011
Press release q1 2011Press release q1 2011
Press release q1 2011
 
Eni 2011 4Q Results and full year results (unaudited)
Eni 2011 4Q Results and full year results (unaudited)Eni 2011 4Q Results and full year results (unaudited)
Eni 2011 4Q Results and full year results (unaudited)
 
ACCIONA Q1 2015 Results Report
ACCIONA Q1 2015 Results ReportACCIONA Q1 2015 Results Report
ACCIONA Q1 2015 Results Report
 
Analyst presentation 1Q 2017
Analyst presentation 1Q 2017Analyst presentation 1Q 2017
Analyst presentation 1Q 2017
 
Hera Group press release h1 2008 results
Hera Group press release h1 2008 resultsHera Group press release h1 2008 results
Hera Group press release h1 2008 results
 
Analyst presentation: first Half 2009 Results
Analyst presentation: first Half 2009 ResultsAnalyst presentation: first Half 2009 Results
Analyst presentation: first Half 2009 Results
 
Wessanen q1 2014 analyst&investor meeting 25 april
Wessanen q1 2014 analyst&investor meeting 25 aprilWessanen q1 2014 analyst&investor meeting 25 april
Wessanen q1 2014 analyst&investor meeting 25 april
 
Press Release Annual results 2010
Press Release Annual results 2010Press Release Annual results 2010
Press Release Annual results 2010
 
Hera’s Board of Directors approves the results for the third quarter of 2015
Hera’s Board of Directors approves the results for the third quarter of 2015Hera’s Board of Directors approves the results for the third quarter of 2015
Hera’s Board of Directors approves the results for the third quarter of 2015
 
Analyst presentation H1 2015
 Analyst presentation H1 2015 Analyst presentation H1 2015
Analyst presentation H1 2015
 
Analyst presentation H1 2018
Analyst presentation H1 2018Analyst presentation H1 2018
Analyst presentation H1 2018
 
AT&S Quarterly Financial Report Q1 2018/19
AT&S Quarterly Financial Report Q1 2018/19AT&S Quarterly Financial Report Q1 2018/19
AT&S Quarterly Financial Report Q1 2018/19
 
Eni Interim Consolidated Report, July 29th, 2011
Eni Interim Consolidated Report, July 29th, 2011Eni Interim Consolidated Report, July 29th, 2011
Eni Interim Consolidated Report, July 29th, 2011
 
Deutsche EuroShop | Quarterly Statement 9M 2017
Deutsche EuroShop | Quarterly Statement 9M 2017 Deutsche EuroShop | Quarterly Statement 9M 2017
Deutsche EuroShop | Quarterly Statement 9M 2017
 
3M results 2012
3M results 20123M results 2012
3M results 2012
 
140212 Presentation Financial Analysts En
140212   Presentation Financial Analysts En140212   Presentation Financial Analysts En
140212 Presentation Financial Analysts En
 
Analyst presentation 1Q 2008 Results
Analyst presentation 1Q 2008 ResultsAnalyst presentation 1Q 2008 Results
Analyst presentation 1Q 2008 Results
 

More from BOURBON

BOURBON Présentation actionnaires 25 septembre 2015
BOURBON Présentation actionnaires 25 septembre 2015BOURBON Présentation actionnaires 25 septembre 2015
BOURBON Présentation actionnaires 25 septembre 2015BOURBON
 
BOURBON corporate presentation
BOURBON corporate presentationBOURBON corporate presentation
BOURBON corporate presentationBOURBON
 
Bourbon reunion-actionnaires-04-09-2014
Bourbon reunion-actionnaires-04-09-2014Bourbon reunion-actionnaires-04-09-2014
Bourbon reunion-actionnaires-04-09-2014BOURBON
 
Rapport Développement Durable 2013
Rapport Développement Durable 2013Rapport Développement Durable 2013
Rapport Développement Durable 2013BOURBON
 
Charte BOURBON
Charte BOURBONCharte BOURBON
Charte BOURBONBOURBON
 
BOURBON Document de Référence 2006
BOURBON Document de Référence 2006BOURBON Document de Référence 2006
BOURBON Document de Référence 2006BOURBON
 
BOURBON Document de Référence
BOURBON Document de RéférenceBOURBON Document de Référence
BOURBON Document de RéférenceBOURBON
 
Présentation de l’Assemblée Générale Mixte 2013
Présentation de l’Assemblée Générale Mixte 2013Présentation de l’Assemblée Générale Mixte 2013
Présentation de l’Assemblée Générale Mixte 2013BOURBON
 
Présentation de l’Assemblée Générale Mixte 2012
Présentation de l’Assemblée Générale Mixte 2012Présentation de l’Assemblée Générale Mixte 2012
Présentation de l’Assemblée Générale Mixte 2012BOURBON
 
Rapport dev durable 2013 - BOURBON
Rapport dev durable 2013 - BOURBONRapport dev durable 2013 - BOURBON
Rapport dev durable 2013 - BOURBONBOURBON
 
Présentation Assemblée Générale Mixte 2014
Présentation Assemblée Générale Mixte 2014Présentation Assemblée Générale Mixte 2014
Présentation Assemblée Générale Mixte 2014BOURBON
 
Webnews Deepwater Asia Congress 2011 Presentation
Webnews Deepwater Asia Congress 2011 PresentationWebnews Deepwater Asia Congress 2011 Presentation
Webnews Deepwater Asia Congress 2011 PresentationBOURBON
 
Webnews Conférence Deepwater Asia Congress 2011
Webnews Conférence Deepwater Asia Congress 2011Webnews Conférence Deepwater Asia Congress 2011
Webnews Conférence Deepwater Asia Congress 2011BOURBON
 
Webnews BOURBON Training Centers
Webnews BOURBON Training CentersWebnews BOURBON Training Centers
Webnews BOURBON Training CentersBOURBON
 
Webnews The assistance and salvage tugs draw crowds
Webnews The assistance and salvage tugs draw crowdsWebnews The assistance and salvage tugs draw crowds
Webnews The assistance and salvage tugs draw crowdsBOURBON
 
Webnews Les remorqueurs de sauvetage attirent les foules
Webnews Les remorqueurs de sauvetage attirent les foules Webnews Les remorqueurs de sauvetage attirent les foules
Webnews Les remorqueurs de sauvetage attirent les foules BOURBON
 
Webnews Focus on Bourbon Alexandre's attack
Webnews Focus on Bourbon Alexandre's attackWebnews Focus on Bourbon Alexandre's attack
Webnews Focus on Bourbon Alexandre's attackBOURBON
 
Carnet de l'actionnaire
Carnet de l'actionnaireCarnet de l'actionnaire
Carnet de l'actionnaireBOURBON
 
Webnews Point sur l'attaque du Bourbon Alexandre
Webnews Point sur l'attaque du Bourbon Alexandre Webnews Point sur l'attaque du Bourbon Alexandre
Webnews Point sur l'attaque du Bourbon Alexandre BOURBON
 
Webnews Contrat de 3 ans pour le Bourbon Oceanteam 104
Webnews Contrat de 3 ans pour le Bourbon Oceanteam 104Webnews Contrat de 3 ans pour le Bourbon Oceanteam 104
Webnews Contrat de 3 ans pour le Bourbon Oceanteam 104BOURBON
 

More from BOURBON (20)

BOURBON Présentation actionnaires 25 septembre 2015
BOURBON Présentation actionnaires 25 septembre 2015BOURBON Présentation actionnaires 25 septembre 2015
BOURBON Présentation actionnaires 25 septembre 2015
 
BOURBON corporate presentation
BOURBON corporate presentationBOURBON corporate presentation
BOURBON corporate presentation
 
Bourbon reunion-actionnaires-04-09-2014
Bourbon reunion-actionnaires-04-09-2014Bourbon reunion-actionnaires-04-09-2014
Bourbon reunion-actionnaires-04-09-2014
 
Rapport Développement Durable 2013
Rapport Développement Durable 2013Rapport Développement Durable 2013
Rapport Développement Durable 2013
 
Charte BOURBON
Charte BOURBONCharte BOURBON
Charte BOURBON
 
BOURBON Document de Référence 2006
BOURBON Document de Référence 2006BOURBON Document de Référence 2006
BOURBON Document de Référence 2006
 
BOURBON Document de Référence
BOURBON Document de RéférenceBOURBON Document de Référence
BOURBON Document de Référence
 
Présentation de l’Assemblée Générale Mixte 2013
Présentation de l’Assemblée Générale Mixte 2013Présentation de l’Assemblée Générale Mixte 2013
Présentation de l’Assemblée Générale Mixte 2013
 
Présentation de l’Assemblée Générale Mixte 2012
Présentation de l’Assemblée Générale Mixte 2012Présentation de l’Assemblée Générale Mixte 2012
Présentation de l’Assemblée Générale Mixte 2012
 
Rapport dev durable 2013 - BOURBON
Rapport dev durable 2013 - BOURBONRapport dev durable 2013 - BOURBON
Rapport dev durable 2013 - BOURBON
 
Présentation Assemblée Générale Mixte 2014
Présentation Assemblée Générale Mixte 2014Présentation Assemblée Générale Mixte 2014
Présentation Assemblée Générale Mixte 2014
 
Webnews Deepwater Asia Congress 2011 Presentation
Webnews Deepwater Asia Congress 2011 PresentationWebnews Deepwater Asia Congress 2011 Presentation
Webnews Deepwater Asia Congress 2011 Presentation
 
Webnews Conférence Deepwater Asia Congress 2011
Webnews Conférence Deepwater Asia Congress 2011Webnews Conférence Deepwater Asia Congress 2011
Webnews Conférence Deepwater Asia Congress 2011
 
Webnews BOURBON Training Centers
Webnews BOURBON Training CentersWebnews BOURBON Training Centers
Webnews BOURBON Training Centers
 
Webnews The assistance and salvage tugs draw crowds
Webnews The assistance and salvage tugs draw crowdsWebnews The assistance and salvage tugs draw crowds
Webnews The assistance and salvage tugs draw crowds
 
Webnews Les remorqueurs de sauvetage attirent les foules
Webnews Les remorqueurs de sauvetage attirent les foules Webnews Les remorqueurs de sauvetage attirent les foules
Webnews Les remorqueurs de sauvetage attirent les foules
 
Webnews Focus on Bourbon Alexandre's attack
Webnews Focus on Bourbon Alexandre's attackWebnews Focus on Bourbon Alexandre's attack
Webnews Focus on Bourbon Alexandre's attack
 
Carnet de l'actionnaire
Carnet de l'actionnaireCarnet de l'actionnaire
Carnet de l'actionnaire
 
Webnews Point sur l'attaque du Bourbon Alexandre
Webnews Point sur l'attaque du Bourbon Alexandre Webnews Point sur l'attaque du Bourbon Alexandre
Webnews Point sur l'attaque du Bourbon Alexandre
 
Webnews Contrat de 3 ans pour le Bourbon Oceanteam 104
Webnews Contrat de 3 ans pour le Bourbon Oceanteam 104Webnews Contrat de 3 ans pour le Bourbon Oceanteam 104
Webnews Contrat de 3 ans pour le Bourbon Oceanteam 104
 

Recently uploaded

Russian Call Girls in Kolkata Vaishnavi 🤌 8250192130 🚀 Vip Call Girls Kolkata
Russian Call Girls in Kolkata Vaishnavi 🤌  8250192130 🚀 Vip Call Girls KolkataRussian Call Girls in Kolkata Vaishnavi 🤌  8250192130 🚀 Vip Call Girls Kolkata
Russian Call Girls in Kolkata Vaishnavi 🤌 8250192130 🚀 Vip Call Girls Kolkataanamikaraghav4
 
Work Remotely with Confluence ACE 2.pptx
Work Remotely with Confluence ACE 2.pptxWork Remotely with Confluence ACE 2.pptx
Work Remotely with Confluence ACE 2.pptxmavinoikein
 
Open Source Strategy in Logistics 2015_Henrik Hankedvz-d-nl-log-conference.pdf
Open Source Strategy in Logistics 2015_Henrik Hankedvz-d-nl-log-conference.pdfOpen Source Strategy in Logistics 2015_Henrik Hankedvz-d-nl-log-conference.pdf
Open Source Strategy in Logistics 2015_Henrik Hankedvz-d-nl-log-conference.pdfhenrik385807
 
OSCamp Kubernetes 2024 | SRE Challenges in Monolith to Microservices Shift at...
OSCamp Kubernetes 2024 | SRE Challenges in Monolith to Microservices Shift at...OSCamp Kubernetes 2024 | SRE Challenges in Monolith to Microservices Shift at...
OSCamp Kubernetes 2024 | SRE Challenges in Monolith to Microservices Shift at...NETWAYS
 
Navi Mumbai Call Girls Service Pooja 9892124323 Real Russian Girls Looking Mo...
Navi Mumbai Call Girls Service Pooja 9892124323 Real Russian Girls Looking Mo...Navi Mumbai Call Girls Service Pooja 9892124323 Real Russian Girls Looking Mo...
Navi Mumbai Call Girls Service Pooja 9892124323 Real Russian Girls Looking Mo...Pooja Nehwal
 
LANDMARKS AND MONUMENTS IN NIGERIA.pptx
LANDMARKS  AND MONUMENTS IN NIGERIA.pptxLANDMARKS  AND MONUMENTS IN NIGERIA.pptx
LANDMARKS AND MONUMENTS IN NIGERIA.pptxBasil Achie
 
OSCamp Kubernetes 2024 | Zero-Touch OS-Infrastruktur für Container und Kubern...
OSCamp Kubernetes 2024 | Zero-Touch OS-Infrastruktur für Container und Kubern...OSCamp Kubernetes 2024 | Zero-Touch OS-Infrastruktur für Container und Kubern...
OSCamp Kubernetes 2024 | Zero-Touch OS-Infrastruktur für Container und Kubern...NETWAYS
 
OSCamp Kubernetes 2024 | A Tester's Guide to CI_CD as an Automated Quality Co...
OSCamp Kubernetes 2024 | A Tester's Guide to CI_CD as an Automated Quality Co...OSCamp Kubernetes 2024 | A Tester's Guide to CI_CD as an Automated Quality Co...
OSCamp Kubernetes 2024 | A Tester's Guide to CI_CD as an Automated Quality Co...NETWAYS
 
NATIONAL ANTHEMS OF AFRICA (National Anthems of Africa)
NATIONAL ANTHEMS OF AFRICA (National Anthems of Africa)NATIONAL ANTHEMS OF AFRICA (National Anthems of Africa)
NATIONAL ANTHEMS OF AFRICA (National Anthems of Africa)Basil Achie
 
Microsoft Copilot AI for Everyone - created by AI
Microsoft Copilot AI for Everyone - created by AIMicrosoft Copilot AI for Everyone - created by AI
Microsoft Copilot AI for Everyone - created by AITatiana Gurgel
 
Open Source Camp Kubernetes 2024 | Running WebAssembly on Kubernetes by Alex ...
Open Source Camp Kubernetes 2024 | Running WebAssembly on Kubernetes by Alex ...Open Source Camp Kubernetes 2024 | Running WebAssembly on Kubernetes by Alex ...
Open Source Camp Kubernetes 2024 | Running WebAssembly on Kubernetes by Alex ...NETWAYS
 
SBFT Tool Competition 2024 -- Python Test Case Generation Track
SBFT Tool Competition 2024 -- Python Test Case Generation TrackSBFT Tool Competition 2024 -- Python Test Case Generation Track
SBFT Tool Competition 2024 -- Python Test Case Generation TrackSebastiano Panichella
 
Simulation-based Testing of Unmanned Aerial Vehicles with Aerialist
Simulation-based Testing of Unmanned Aerial Vehicles with AerialistSimulation-based Testing of Unmanned Aerial Vehicles with Aerialist
Simulation-based Testing of Unmanned Aerial Vehicles with AerialistSebastiano Panichella
 
Genesis part 2 Isaiah Scudder 04-24-2024.pptx
Genesis part 2 Isaiah Scudder 04-24-2024.pptxGenesis part 2 Isaiah Scudder 04-24-2024.pptx
Genesis part 2 Isaiah Scudder 04-24-2024.pptxFamilyWorshipCenterD
 
Open Source Camp Kubernetes 2024 | Monitoring Kubernetes With Icinga by Eric ...
Open Source Camp Kubernetes 2024 | Monitoring Kubernetes With Icinga by Eric ...Open Source Camp Kubernetes 2024 | Monitoring Kubernetes With Icinga by Eric ...
Open Source Camp Kubernetes 2024 | Monitoring Kubernetes With Icinga by Eric ...NETWAYS
 
Call Girls in Rohini Delhi 💯Call Us 🔝8264348440🔝
Call Girls in Rohini Delhi 💯Call Us 🔝8264348440🔝Call Girls in Rohini Delhi 💯Call Us 🔝8264348440🔝
Call Girls in Rohini Delhi 💯Call Us 🔝8264348440🔝soniya singh
 
Presentation for the Strategic Dialogue on the Future of Agriculture, Brussel...
Presentation for the Strategic Dialogue on the Future of Agriculture, Brussel...Presentation for the Strategic Dialogue on the Future of Agriculture, Brussel...
Presentation for the Strategic Dialogue on the Future of Agriculture, Brussel...Krijn Poppe
 
CTAC 2024 Valencia - Henrik Hanke - Reduce to the max - slideshare.pdf
CTAC 2024 Valencia - Henrik Hanke - Reduce to the max - slideshare.pdfCTAC 2024 Valencia - Henrik Hanke - Reduce to the max - slideshare.pdf
CTAC 2024 Valencia - Henrik Hanke - Reduce to the max - slideshare.pdfhenrik385807
 
call girls in delhi malviya nagar @9811711561@
call girls in delhi malviya nagar @9811711561@call girls in delhi malviya nagar @9811711561@
call girls in delhi malviya nagar @9811711561@vikas rana
 
Exploring protein-protein interactions by Weak Affinity Chromatography (WAC) ...
Exploring protein-protein interactions by Weak Affinity Chromatography (WAC) ...Exploring protein-protein interactions by Weak Affinity Chromatography (WAC) ...
Exploring protein-protein interactions by Weak Affinity Chromatography (WAC) ...Salam Al-Karadaghi
 

Recently uploaded (20)

Russian Call Girls in Kolkata Vaishnavi 🤌 8250192130 🚀 Vip Call Girls Kolkata
Russian Call Girls in Kolkata Vaishnavi 🤌  8250192130 🚀 Vip Call Girls KolkataRussian Call Girls in Kolkata Vaishnavi 🤌  8250192130 🚀 Vip Call Girls Kolkata
Russian Call Girls in Kolkata Vaishnavi 🤌 8250192130 🚀 Vip Call Girls Kolkata
 
Work Remotely with Confluence ACE 2.pptx
Work Remotely with Confluence ACE 2.pptxWork Remotely with Confluence ACE 2.pptx
Work Remotely with Confluence ACE 2.pptx
 
Open Source Strategy in Logistics 2015_Henrik Hankedvz-d-nl-log-conference.pdf
Open Source Strategy in Logistics 2015_Henrik Hankedvz-d-nl-log-conference.pdfOpen Source Strategy in Logistics 2015_Henrik Hankedvz-d-nl-log-conference.pdf
Open Source Strategy in Logistics 2015_Henrik Hankedvz-d-nl-log-conference.pdf
 
OSCamp Kubernetes 2024 | SRE Challenges in Monolith to Microservices Shift at...
OSCamp Kubernetes 2024 | SRE Challenges in Monolith to Microservices Shift at...OSCamp Kubernetes 2024 | SRE Challenges in Monolith to Microservices Shift at...
OSCamp Kubernetes 2024 | SRE Challenges in Monolith to Microservices Shift at...
 
Navi Mumbai Call Girls Service Pooja 9892124323 Real Russian Girls Looking Mo...
Navi Mumbai Call Girls Service Pooja 9892124323 Real Russian Girls Looking Mo...Navi Mumbai Call Girls Service Pooja 9892124323 Real Russian Girls Looking Mo...
Navi Mumbai Call Girls Service Pooja 9892124323 Real Russian Girls Looking Mo...
 
LANDMARKS AND MONUMENTS IN NIGERIA.pptx
LANDMARKS  AND MONUMENTS IN NIGERIA.pptxLANDMARKS  AND MONUMENTS IN NIGERIA.pptx
LANDMARKS AND MONUMENTS IN NIGERIA.pptx
 
OSCamp Kubernetes 2024 | Zero-Touch OS-Infrastruktur für Container und Kubern...
OSCamp Kubernetes 2024 | Zero-Touch OS-Infrastruktur für Container und Kubern...OSCamp Kubernetes 2024 | Zero-Touch OS-Infrastruktur für Container und Kubern...
OSCamp Kubernetes 2024 | Zero-Touch OS-Infrastruktur für Container und Kubern...
 
OSCamp Kubernetes 2024 | A Tester's Guide to CI_CD as an Automated Quality Co...
OSCamp Kubernetes 2024 | A Tester's Guide to CI_CD as an Automated Quality Co...OSCamp Kubernetes 2024 | A Tester's Guide to CI_CD as an Automated Quality Co...
OSCamp Kubernetes 2024 | A Tester's Guide to CI_CD as an Automated Quality Co...
 
NATIONAL ANTHEMS OF AFRICA (National Anthems of Africa)
NATIONAL ANTHEMS OF AFRICA (National Anthems of Africa)NATIONAL ANTHEMS OF AFRICA (National Anthems of Africa)
NATIONAL ANTHEMS OF AFRICA (National Anthems of Africa)
 
Microsoft Copilot AI for Everyone - created by AI
Microsoft Copilot AI for Everyone - created by AIMicrosoft Copilot AI for Everyone - created by AI
Microsoft Copilot AI for Everyone - created by AI
 
Open Source Camp Kubernetes 2024 | Running WebAssembly on Kubernetes by Alex ...
Open Source Camp Kubernetes 2024 | Running WebAssembly on Kubernetes by Alex ...Open Source Camp Kubernetes 2024 | Running WebAssembly on Kubernetes by Alex ...
Open Source Camp Kubernetes 2024 | Running WebAssembly on Kubernetes by Alex ...
 
SBFT Tool Competition 2024 -- Python Test Case Generation Track
SBFT Tool Competition 2024 -- Python Test Case Generation TrackSBFT Tool Competition 2024 -- Python Test Case Generation Track
SBFT Tool Competition 2024 -- Python Test Case Generation Track
 
Simulation-based Testing of Unmanned Aerial Vehicles with Aerialist
Simulation-based Testing of Unmanned Aerial Vehicles with AerialistSimulation-based Testing of Unmanned Aerial Vehicles with Aerialist
Simulation-based Testing of Unmanned Aerial Vehicles with Aerialist
 
Genesis part 2 Isaiah Scudder 04-24-2024.pptx
Genesis part 2 Isaiah Scudder 04-24-2024.pptxGenesis part 2 Isaiah Scudder 04-24-2024.pptx
Genesis part 2 Isaiah Scudder 04-24-2024.pptx
 
Open Source Camp Kubernetes 2024 | Monitoring Kubernetes With Icinga by Eric ...
Open Source Camp Kubernetes 2024 | Monitoring Kubernetes With Icinga by Eric ...Open Source Camp Kubernetes 2024 | Monitoring Kubernetes With Icinga by Eric ...
Open Source Camp Kubernetes 2024 | Monitoring Kubernetes With Icinga by Eric ...
 
Call Girls in Rohini Delhi 💯Call Us 🔝8264348440🔝
Call Girls in Rohini Delhi 💯Call Us 🔝8264348440🔝Call Girls in Rohini Delhi 💯Call Us 🔝8264348440🔝
Call Girls in Rohini Delhi 💯Call Us 🔝8264348440🔝
 
Presentation for the Strategic Dialogue on the Future of Agriculture, Brussel...
Presentation for the Strategic Dialogue on the Future of Agriculture, Brussel...Presentation for the Strategic Dialogue on the Future of Agriculture, Brussel...
Presentation for the Strategic Dialogue on the Future of Agriculture, Brussel...
 
CTAC 2024 Valencia - Henrik Hanke - Reduce to the max - slideshare.pdf
CTAC 2024 Valencia - Henrik Hanke - Reduce to the max - slideshare.pdfCTAC 2024 Valencia - Henrik Hanke - Reduce to the max - slideshare.pdf
CTAC 2024 Valencia - Henrik Hanke - Reduce to the max - slideshare.pdf
 
call girls in delhi malviya nagar @9811711561@
call girls in delhi malviya nagar @9811711561@call girls in delhi malviya nagar @9811711561@
call girls in delhi malviya nagar @9811711561@
 
Exploring protein-protein interactions by Weak Affinity Chromatography (WAC) ...
Exploring protein-protein interactions by Weak Affinity Chromatography (WAC) ...Exploring protein-protein interactions by Weak Affinity Chromatography (WAC) ...
Exploring protein-protein interactions by Weak Affinity Chromatography (WAC) ...
 

Press Release First Half 2012 Results

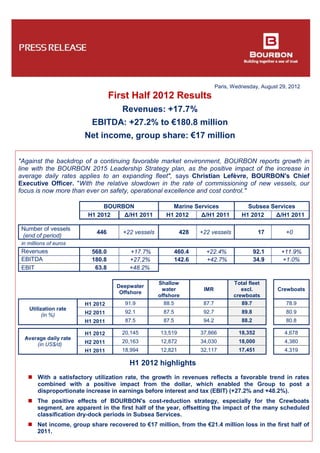
  • 1. Paris, Wednesday, August 29, 2012 First Half 2012 Results Revenues: +17.7% EBITDA: +27.2% to €180.8 million Net income, group share: €17 million "Against the backdrop of a continuing favorable market environment, BOURBON reports growth in line with the BOURBON 2015 Leadership Strategy plan, as the positive impact of the increase in average daily rates applies to an expanding fleet", says Christian Lefèvre, BOURBON's Chief Executive Officer. "With the relative slowdown in the rate of commissioning of new vessels, our focus is now more than ever on safety, operational excellence and cost control." BOURBON Marine Services Subsea Services H1 2012 Δ/H1 2011 H1 2012 Δ/H1 2011 H1 2012 Δ/H1 2011 Number of vessels (end of period) 446 +22 vessels 428 +22 vessels 17 +0 in millions of euros Revenues 568.0 +17.7% 460.4 +22.4% 92.1 +11.9% EBITDA 180.8 +27.2% 142.6 +42.7% 34.9 +1.0% EBIT 63.8 +48.2% Deepwater Offshore Shallow water offshore IMR Total fleet excl. crewboats Crewboats Utilization rate (in %) H1 2012 91.9 88.5 87.7 89.7 78.9 H2 2011 92.1 87.5 92.7 89.8 80.9 H1 2011 87.5 87.5 94.2 88.2 80.8 Average daily rate (in US$/d) H1 2012 20,145 13,519 37,866 18,352 4,678 H2 2011 20,163 12,872 34,030 18,000 4,380 H1 2011 18,994 12,821 32,117 17,451 4,319 H1 2012 highlights  With a satisfactory utilization rate, the growth in revenues reflects a favorable trend in rates combined with a positive impact from the dollar, which enabled the Group to post a disproportionate increase in earnings before interest and tax (EBIT) (+27.2% and +48.2%).  The positive effects of BOURBON's cost-reduction strategy, especially for the Crewboats segment, are apparent in the first half of the year, offsetting the impact of the many scheduled classification dry-dock periods in Subsea Services.  Net income, group share recovered to €17 million, from the €21.4 million loss in the first half of 2011.
  • 2. 2 Half-year results in millions of euros H1 2012 H2 2011 Change H1 2012 / H2 2011 H1 2011 Change H1 2012 / H1 2011 Revenues 568.0 525.3 +8.1% 482.7 +17.7% Gross operating income (EBITDA) % of revenues 180.8 31.8% 158.2 30.1% +14.3% 142.1 29.4% +27.2% Operating income (EBIT) 63.8 42.2 +51.0% 43.1 +48.2% Financial profit/(loss) (32.3) (8.9) (62.7) -48.5% Income tax (7.1) (3.8) +87.3% (6.9) +2.9% Income from discontinued operations 0.8 (0.0) 0.5 +79.0% Minority interests (8.3) (1.2) 4.5 Net income/(loss), Group share 17.0 28.2 -39.8% (21.4) - Revenues Compared to the first half of 2011, revenues are up 17.7% to €568 million, with a strong 20.5% overall increase in Marine Services and Subsea Services. This growth mainly stems from the expansion of the fleet, particularly in the Shallow water Offshore segment (with 12 more vessels than in H1 2011), the rise in average daily rates and the firmer dollar exchange rate (14.5% at constant exchange rates). Compared to the second half of 2011, revenues grew 8.1% (+3.9% at constant exchange rates), driven essentially by the Shallow water Offshore and Crewboats segments, which gained 20.1% and 10.2%, respectively. These gains primarily reflect the expansion of the fleet, the improvement in daily rates and the firmer dollar. The sharp increase in average daily rates in Subsea Services more than offset the impact of Classification dry-dock periods. - Gross operating income (EBITDA) Compared to the first half of 2011, at €180.8 million, gross operating income (EBITDA) for the first half of 2012 was up 27.2%. This increase is clearly above the gain in revenues, since EBITDA reflects the impact of price increases combined with the strengthening of the dollar, which was however moderated somewhat by cost inflation. The improvement in EBITDA stems exclusively from Marine Services, while Subsea Services EBITDA remained stable, despite the numerous Classification dry-dock periods. Compared to the second half of 2011, the 14.3% gain in EBITDA was substantially higher than the rise in revenues, reflecting the impact of price increases and the strengthening of the dollar. The increase is mainly due to the Shallow water Offshore vessels and Crewboats segments. - Earnings before interest and tax (EBIT) Compared to the first half of 2011, at €63.8 million, EBIT for H1 2012 increased 48.2%. As for EBITDA above, the improvement in daily rates combined with the stronger dollar explain this growth rate, largely surpassing the gain in revenues. This robust increase is mainly due to the performance of the Deepwater Offshore vessels and Crewboats segments. Compared to the second half of 2011, EBIT is up 51%. - Financial income / (loss) In the first half of the year, financial loss amounted to a net charge of €32.3 million for a cost of net debt of €33.7 million. The change in currency exchange rates generated net financial income of €2.3 million. Note that the change in foreign exchange rates in H1 2011 resulted in a €30.5 million loss and a €29.2 million gain in H2 2011. - Net income / (loss), Group share Net income, Group share was positive at €17 million, compared to a €21.4 million loss in the same period the previous year. This marked improvement reflects the growth in EBIT and the absence of foreign exchange losses.
  • 3. 3  MARINE SERVICES H1 2012 H2 2011 Change H1 2012 / H2 2011 H1 2011 Change H1 2012 / H1 2011 Number of vessels (end of period) 428 418 +10 406 +22 Utilization rate 83.2% 84.3% -1.1 pt 83.4% -0.2 pt in millions of euros H1 2012 H2 2011 Change H1 2012 / H2 2011 H1 2011 Change H1 2012 / H1 2011 Revenues 460.4 416.8 +10.5% 376.1 +22.4% Direct costs (269.7) (255.4) +5.6% (233.4) +15.6% Operating margin 190.8 161.4 +18.2% 142.8 +33.6% General and administrative costs (48.2) (40.3) +19.5% (42.9) +12.4% Gross operating income (EBITDA) 142.6 121.5 +17.4% 100.0 +42.7% % of revenues 31.0% 29.1% 26.6% Compared to the first half of 2011, Marine Services revenues increased 22.4% to €460.4 million, with growth driven by the higher rates, especially in Deepwater Offshore, the expansion of the fleet, particularly the Shallow water Offshore fleet, and the firmer dollar. At €142.6 million, H1 EBITDA rose a steep 42.7%, almost twice the rate of growth of revenues. Profitability measured by the “EBITDA to average capital employed excluding installments” ratio improved by 3.3 percentage points to 12.9%. The three segments, Deepwater Offshore, Shallow water Offshore and Crewboats all contributed to this improvement. Revenues gained 10.5%, compared to the second half of 2011, primarily due to the higher rates in the Shallow water Offshore and Crewboats segments, combined with the favorable impact of foreign exchange rates. EBITDA increased 17.4%. Results by segment  Deepwater Offshore vessels H1 2012 H2 2011 Change H1 2012 / H2 2011 H1 2011 Change H1 2012 / H1 2011 Number of vessels (end of period) 71 70 +1 vessel 70 +1 vessel Utilization rate 91.9% 92.1% -0.2 pt 87.5% +4.4 pts in millions of euros H1 2012 H2 2011 Change H1 2012 / H2 2011 H1 2011 Change H1 2012 / H1 2011 Revenues 175.0 169.2 +3.4% 149.2 +17.3% Direct costs (94.0) (91.1) +3.2% (83.4) +12.7% Operating margin 81.1 78.2 +3.7% 65.8 +23.2% General and administrative costs (18.3) (16.4) +11.6% (17.0) +7.7% Gross operating income (EBITDA) 62.8 61.8 +1.6% 48.8 +28.6% % of revenues 35.9% 36.5% 32.7% Compared to the first half of the previous year, revenues for the period from Deepwater Offshore vessels were up 17.3% to €175 million, due primarily to improved rates and a stronger dollar, and, to a lesser extent, a higher utilization rate at 91.9%. EBITDA increased at a stronger rate than revenues to €62.8 million, a 28.6% increase. Compared to the second half of 2011, revenues and EBITDA increased slightly (by 3.4% and 1.6%, respectively).
  • 4. 4  Shallow water Offshore H1 2012 H2 2011 Change H1 2012 / H2 2011 H1 2011 Change H1 2012 / H1 2011 Number of vessels (end of period) 97 91 +6 vessels 85 +12 vessels Utilization rate 88.5% 87.5% +1 pt 87.5% +1 pt in millions of euros H1 2012 H2 2011 Change H1 2012 / H2 2011 H1 2011 Change H1 2012 / H1 2011 Revenues 153.8 128.1 +20.1% 113.3 +35.7% Direct costs (97.5) (84.2) +15.8% (72.0) +35.4% Operating margin 56.4 43.9 +28.3% 41.4 +36.4% General and administrative costs (16.1) (12.4) +29.7% (12.9) +24.6% Gross operating income (EBITDA) 40.4 31.9 +26.7% 28.4 +42.1% % of revenues 26.3% 24.9% 25.1% Compared to the first half of 2011, revenues for the period from Shallow water Offshore vessels increased 35.7% to reach €153.8 million, mainly driven by the expansion of the fleet (+12 vessels in the past 12 months), the firmer dollar and the upturn in rates. First-half EBITDA for the segment totaled €40.4 million, up 42.1%, proportionately outstripping the growth in revenues. Compared to the second half of 2011, revenues for the period for this segment rose 20.1%, reaping the benefits of these same impacts. EBITDA increased 26.7% for the second half of the year. Crewboats H1 2012 H2 2011 Change H1 2012 / H2 2011 H1 2011 Change H1 2012 / H1 2011 Number of vessels (end of period) 260 257 +3 vessels 251 +9 vessels Utilization rate 78.9% 80.9% -2 pts 80.8% -1.9 pt in millions of euros H1 2012 H2 2011 Change H1 2012 / H2 2011 H1 2011 Change H1 2012 / H1 2011 Revenues 131.6 119.4 +10.2% 113.6 +15.8% Direct costs (78.3) (80.2) -2.3% (78.0) +0.3% Operating margin 53.3 39.3 +35.7% 35.6 +49.7% General and administrative costs (13.8) (11.5) +19.7% (12.9) +6.3% Gross operating income (EBITDA) 39.4 27.8 +42.4% 22.7 +73.6% % of revenues 30.0% 23.3% 20.0% Compared to the first half of 2011, revenues for the Crewboats segment reached €131.6 million, up 15.8% thanks to the improvement in rates, the stronger dollar and the expansion of the fleet (+9 vessels in the past 12 months). Rising by a steep 73.6%, EBITDA was €39,4 million, buoyed by the increase in revenues and excellent cost control. Compared to the second half of 2011, revenues for the period for this segment increased 10.2%, mainly due to the higher rates. EBITDA for the second half of the year rose 42.4% for the same reasons.
  • 5. 5  SUBSEA SERVICES H1 2012 H2 2011 Change H1 2012 / H2 2011 H1 2011 Change H1 2012 / H1 2011 Number of vessels (end of period) 17 18 -1 vessel 17 - Utilization rate 87.7% 92.7% -5 pts 94.2% -6.5 pts in millions of euros H1 2012 H2 2011 Change H1 2012 / H2 2011 H1 2011 Change H1 2012 / H1 2011 Revenues 92.1 90.4 +1.9% 82.4 +11.9% Direct costs (47.6) (48.8) -2.5% (38.7) +23.0% Operating margin 44.5 41.6 +7.1% 43.7 +2.0% General and administrative costs (9.6) (8.7) +10.3% (9.4) +2.7% Gross operating income (EBITDA) 34.9 32.9 +6.0% 34.6 +1.0% % of revenues 37.9% 36.4% 42.0% Compared to the first half of 2011, revenues posted by Subsea Services for the period rose 11.9% to €92.1 million, while EBITDA remained practically stable. As a result, the ratio of EBITDA to Revenues dipped slightly from 42% to 37.9%. Profitability measured by the “EBITDA to average capital employed excluding installments” ratio was 15.1%. Compared to the second half of 2011, revenues improved very slightly, by 1.9%, as the positive impact of the stronger dollar and the increase in rates was largely offset by the effect of Classification dry-dock periods. EBITDA increased 6.0% due to good cost control. To recap, two "small" IMR vessels were transferred from Subsea Services to Marine Services, and one well-stimulation vessel was transferred from Marine Services to Subsea Services.  OTHER in millions of euros H1 2012 H2 2011 Change H1 2012 / H2 2011 H1 2011 Change H1 2012 / H1 2011 Revenues 15.4 18.1 -15.0% 24.2 -36.3% Direct costs (11.4) (13.7) -16.6% (15.9) -28.4% Operating margin 4.0 4.4 -10.2% 8.2 -51.6% General and administrative costs (0.7) (0.7) +5.7% (0.7) +8.3% Gross operating income (EBITDA) 3.3 3.8 -13.1% 7.6 -56.8% % of revenues 21.2% 20.8% 31.3% “Other” mainly includes the business from the cement carrier Endeavor, externally chartered offshore vessels, as well as items not included in the two other Activities. The decline in revenues and EBITDA reflects the slowdown in external chartering in the Offshore activities.
  • 6. 6  OUTLOOK Despite the continued uncertainty surrounding global economies, investments by oil and gas sector clients continue to be backed by the price per barrel (US$113 on average for the first half of the year), while demand for offshore service vessels is predicted to increase over the next two years. Orders for drilling rigs due to be commissioned in the next few years and the order books of offshore construction companies are set to stimulate demand for vessels. In Shallow water Offshore, accelerating the process of replacing older vessels (deemed obsolete) on the market seems vital in order to meet the increasingly stringent risk management demands of oil and gas companies. Clients will continue to favor innovative, high-productivity vessels, which is where BOURBON’s fleet of vessels is particularly appreciated. The global Deepwater Offshore fleet continues to increase with new orders for "large" PSVs. In line with its strategy of taking into account the risk of over-capacity, BOURBON has very limited exposure to this market and concentrates on medium-sized vessels, for which demand remains strong in international markets. BOURBON's earnings are influenced by the €/US$ exchange rate. Accordingly, BOURBON set up €/US$ hedging contracts to cover the entirety of its estimated EBITDA exposure in 2012. These dollar forward sales were made at an average exchange rate of €1 = US$1.3070.  ADDITIONAL INFORMATION - In August 2012, typhoon Haikui struck China, affecting the construction of 15 vessels in Sinopacific's shipyards in Zhejiang. The estimated delay for delivery and transfer of title to BOURBON of these vessels is five to six months. - The accounts for the first half of 2012 were closed by the Board of Directors on Monday, August 27, 2012. - The accounts for the first half of 2012 underwent a limited examination by the statutory auditors.  FINANCIAL CALENDAR - Publication of Q3 2012 Revenues November 7, 2012 - Publication of Q4 and full-year 2012 Revenues February 6, 2013 - Presentation of 2012 Annual Results March 6, 2013 The financial data related to the results for H1 2012 include this press release as well as the presentation of the press conference, which will be available on the Group's website on August 29, 2012 at 12:00pm, at the end of the press conference scheduled for this date. View the press conference live or recorded on our website, www.bourbon-online.com
  • 7. 7 APPENDIX I Simplified consolidated balance sheet in millions of euros 6/30/2012 12/31/2011 6/30/2012 12/31/2011 Shareholders’ equity 1,387 1,417 Net property, plant and equipment 3,319 3,244 Financial debt > 1 year 1,502 1,565 Other Non-current assets 99 101 Other Non-current liabilities 140 134 TOTAL NON-CURRENT ASSETS 3,418 3,345 TOTAL NON-CURRENT LIABILITIES 1,642 1,699 Other current assets 518 484 Financial debt < 1 year 734 620 Cash on hand and in banks 185 230 Other current liabilities 358 323 TOTAL CURRENT ASSETS 703 714 TOTAL CURRENT LIABILITIES 1,092 943 Non-current assets held for sale - - Non-current liabilities held for sale - - TOTAL ASSETS 4,121 4,059 TOTAL LIABILITIES 4,121 4,059
  • 8. 8 APPENDIX II Consolidated Cash Flow Statement in millions of euros H1 2012 H1 2011 Consolidated net income (loss) 25.3 (25.9) Cash flow (*) 145.5 86.1 Net cash flow from operating activities(*) 168.1 64.0 Net cash flow consumed by investing activities (*) Of which acquisition of property, plant and equipment and intangible assets Of which sale of property, plant and equipment and intangible assets (165.6) 1.2 (164.1) (166.9) 31.0 (121.5) Net cash flow from/(consumed by) financing activities(*) Of which increase (decrease) in borrowings Of which dividends paid to shareholders of the group Of which net financial interest paid (81.2) (53.3) (33.7) (167.0) (15.1) (53.2) (30.2) (98.6) Impact from the change in exchange rates (0.0) (2.5) Net cash increase (decrease) (163.0) (158.7) Net cash at beginning of period Net cash at end of period Net cash increase (decrease) (44.0) (207.0) (163.0) (61.1) (219.7) (158.7) * Including discontinued operations
  • 9. 9 APPENDIX III Quarterly revenue breakdown (In € millions) 2012 2011 Q2 Q1 Q4 Q3 Q2 Q1 Marine Services 238.4 222.1 216.5 200.3 191.1 185.1 Deepwater offshore vessels 88.5 86.5 87.5 81.7 74.4 74.8 Shallow water offshore vessels 83.4 70.5 66.6 61.5 58.9 54.4 Crewboats 66.4 65.1 62.4 57.0 57.8 55.8 Subsea Services IMR vessels 46.4 45.7 48.1 42.3 41.6 40.7 Other 5.2 10.2 8.5 9.6 14.5 9.7 GROUP TOTAL 290.0 278.0 273.1 252.2 247.2 235.5 Quarterly average utilization rates for the BOURBON offshore fleet (in %) 2012 2011 Q2 Q1 Q4 Q3 Q2 Q1 Deepwater offshore vessels 91.3 92.5 93.7 90.2 86.9 88.1 Shallow water offshore vessels 92.5 84.3 88.3 86.4 90.2 84.8 Crewboats 78.6 81.0 82.1 79.7 81.4 80.5 Marine Services average utilization rate 83.9 83.7 85.5 83.0 84.2 82.7 Subsea Services average utilization rate 89.7 85.7 91.0 94.0 96.3 92.0 Total fleet excluding Crewboats average utilization rate 91.8 87.6 90.7 88.7 89.5 86.9 Total fleet average utilization rate 84.0 83.7 85.7 83.4 84.7 83.1 Quarterly average daily rates for the BOURBON offshore fleet (in US$/day) 2012 2011 Q2 Q1 Q4 Q3 Q2 Q1 Deepwater offshore vessels 20,480 20,011 20,222 20,547 19,154 18,835 Shallow water offshore vessels 13,773 13,290 12,681 13,179 12,883 12,653 Crewboats 4,763 4,447 4,349 4,409 4,361 4,263 IMR vessels 38,018 38,181 34,516 33,822 32,379 31,842 Total fleet excluding Crewboats average daily rate 18,526 18,309 17,965 18,303 17,498 17,354 Quarterly commissioning of vessels (in number of vessels) 2012 2011 Q2 Q1 Q4 Q3 Q2 Q1 TOTAL FLEET 6 8 3 15 11 10 Marine Services 6 8 2 15 11 10 Deepwater Offshore vessels Shallow water Offshore Crewboats 2 1 3 0 3 5 0 1 1 0 6 9 1 5 5 0 3 7 Subsea Services / IMR 0 0 1 0 0 0
  • 10. 10 Half-year revenue breakdown (In € millions) 2012 2011 H1 H2 H1 Marine Services 460.4 416.8 376.1 Deepwater Offshore vessels 175.0 169.2 149.2 Shallow water Offshore 153.8 128.1 113.3 Crewboats 131.6 119.4 113.6 Subsea Services IMR vessels 92.1 90.4 82.4 Other 15.4 18.1 24.2 GROUP TOTAL 568.0 525.3 482.7 Half-year average utilization rates for the BOURBON offshore fleet (in %) 2012 2011 H1 H2 H1 Deepwater Offshore vessels 91.9 92.1 87.5 Shallow water Offshore 88.5 87.5 87.5 Crewboats 78.9 80.9 80.8 Marine Services average utilization rate 83.2 84.3 83.4 Subsea Services average utilization rate 87.7 92.7 94.2 Total fleet excluding Crewboats average utilization rate 89.7 89.8 88.2 Total fleet average utilization rate 83.3 84.6 83.8 Half-year average daily rates for the BOURBON offshore fleet (in US$/day) 2012 2011 H1 H2 H1 Deepwater Offshore vessels 20,145 20,163 18,994 Shallow water Offshore 13,519 12,872 12,821 Crewboats 4,678 4,380 4,319 IMR vessels 37,866 34,030 32,117 Total fleet excluding Crewboats average utilization rate 18,352 18,000 17,451 Half-year commissioning of vessels (in number of vessels) 2012 2011 H1 H2 H1 TOTAL FLEET 14 18 21 Marine Services 14 17 21 Deepwater Offshore vessels Shallow water Offshore Crewboats 2 4 8 0 7 10 1 8 12 Subsea Services / IMR 0 1 0
  • 11. 11 Breakdown of BOURBON revenues by geographical region Second quarter First half (In € millions) Q2 2012 Q2 2011 Change H1 2012 H1 2011 Change Africa 176.9 147.9 19.6% 356.2 298.7 19.2% Europe & Mediterranean/Middle East 50.2 50.8 -1.0% 96.3 88.3 9.1% American Continent 36.6 29.4 24.2% 70.4 59.4 18.4% Asia 26.3 19.0 38.2% 45.1 36.2 24.4% Other key indicators Quarterly breakdown 2012 2011 Q2 Q1 Q4 Q3 Q2 Q1 Average €/US$ exchange rate for the quarter (in €) 1.28 1.31 1.35 1.41 1.44 1.37 €/US$ exchange rate at closing (in €) 1.26 1.34 1.29 1.35 1.45 1.42 Average price of Brent for the quarter (in US$/bbl) 108 119 109 113 117 105 Half-yearly breakdown 2012 2011 H1 H2 H1 Average €/US$ exchange rate for the half year (in €) 1.30 1.38 1.40 €/US$ exchange rate at closing (in €) 1.26 1.29 1.45 Average price of Brent for the half year (in US$/bbl) 113 111 111
  • 12. 12 About BOURBON BOURBON offers the most demanding oil and gas companies a comprehensive range of surface and subsea marine services for offshore oil and gas fields and wind farms, based on a extensive range of latest-generation vessels. The Group provides a local service through its 27 operating subsidiaries, close to clients and their operations, guaranteeing the highest standards of service quality and safety worldwide. BOURBON has two Businesses (Marine Services and Subsea Services) and also protects the French coastline for the French Navy. Under the "BOURBON 2015 Leadership Strategy" plan, the Group is investing in a large fleet of innovative and high- performance offshore vessels built in series. In 2011, BOURBON posted revenues of €1.008 billion and operated a fleet of 446 vessels as of June 30, 2012. Classified by ICB (Industry Classification Benchmark) in the “Oil Services” sector, BOURBON is listed for trading on Euronext Paris, Compartment A, participates in the Deferred Settlement Service (“SRD”) and is included in the SBF 120, CAC Mid 60 and Dow Jones Stoxx 600 indices. CONTACTS Publicis Consultants Jérôme Goaer +33 (0)1 44 82 46 24 - jerome.goaer@consultants.publicis.fr Véronique Duhoux +33 (0)1 44 82 46 33 - veronique.duhoux@consultants.publicis.fr Vilizara Lazarova +33 (0)1 44 82 46 34 - vilizara.lazarova@consultants.publicis.fr BOURBON Investors - Analysts – Shareholders Relations Patrick Mangaud +33 (0)1 40 13 86 09 - patrick.mangaud@bourbon-online.com Corporate Communication Christa Roqueblave +33 (0)1 40 13 86 06 - christa.roqueblave@bourbon-online.com www.bourbon-online.com www.bourbon-online.com www.bourbon-online.com