Press Release First Half 2011 results
•
0 likes•428 views

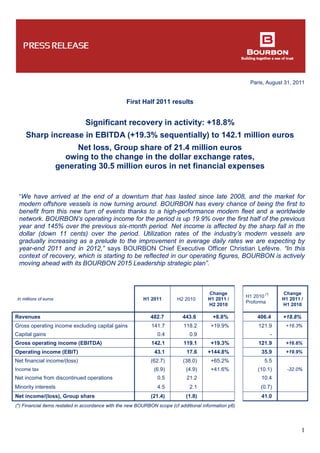
Significant recovery in activity: +18.8% Sharp increase in EBITDA (+19.3% sequentially) to 142.1 million euros Net loss, Group share of 21.4 million euros owing to the change in the dollar exchange rates, generating 30.5 million euros in net financial expenses

Recommended
Recommended
More Related Content
What's hot
What's hot (20)
Viewers also liked
Viewers also liked (8)
Similar to Press Release First Half 2011 results
Similar to Press Release First Half 2011 results (20)
More from BOURBON
More from BOURBON (20)
Recently uploaded
Recently uploaded (20)
Press Release First Half 2011 results
- 1. Paris, August 31, 2011 1 First Half 2011 results Significant recovery in activity: +18.8% Sharp increase in EBITDA (+19.3% sequentially) to 142.1 million euros Net loss, Group share of 21.4 million euros owing to the change in the dollar exchange rates, generating 30.5 million euros in net financial expenses “We have arrived at the end of a downturn that has lasted since late 2008, and the market for modern offshore vessels is now turning around. BOURBON has every chance of being the first to benefit from this new turn of events thanks to a high-performance modern fleet and a worldwide network. BOURBON’s operating income for the period is up 19.9% over the first half of the previous year and 145% over the previous six-month period. Net income is affected by the sharp fall in the dollar (down 11 cents) over the period. Utilization rates of the industry’s modern vessels are gradually increasing as a prelude to the improvement in average daily rates we are expecting by year-end 2011 and in 2012,” says BOURBON Chief Executive Officer Christian Lefèvre. “In this context of recovery, which is starting to be reflected in our operating figures, BOURBON is actively moving ahead with its BOURBON 2015 Leadership strategic plan”. In millions of euros H1 2011 H2 2010 Change H1 2011 / H2 2010 H1 2010 (*) Proforma Change H1 2011 / H1 2010 Revenues 482.7 443.6 +8.8% 406.4 +18.8% Gross operating income excluding capital gains 141.7 118.2 +19.9% 121.9 +16.3% Capital gains 0.4 0.9 - Gross operating income (EBITDA) 142.1 119.1 +19.3% 121.9 +16.6% Operating income (EBIT) 43.1 17.6 +144.8% 35.9 +19.9% Net financial income/(loss) (62.7) (38.0) +65.2% 5.5 Income tax (6.9) (4.9) +41.6% (10.1) -32.0% Net income from discontinued operations 0.5 21.2 10.4 Minority interests 4.5 2.1 (0.7) Net income/(loss), Group share (21.4) (1.8) 41.0 (*) Financial items restated in accordance with the new BOURBON scope (cf additional information p6)
- 2. 2 Revenues for the period amount to 482.7 million euros, up 18.8% over the first half of the previous year, owing mainly to the strong growth of shallow water offshore, as well as the good performance of the Subsea Services Activity. Compared with the second half of 2010, revenues are up 8.8%. This growth comes mainly from the Shallow water offshore segment, which is seeing both an increase in utilization rates and a steadily increasing number of vessels. Gross operating income (EBITDA) for the period amounts to 142.1 million euros, which is up 16.6% compared with the first half of the previous year, very close to the revenue growth rate. Compared with the second half of 2010, EBITDA is up 19.3%. After a fall in profitability to 26.8% in the second half of 2010, the Group is returning to first half 2010 levels with a ratio of EBITDA to Revenues again approaching 30%. Operating income for the period stands at 43.1 million euros, up 19.9% compared to the first half of the previous year, despite the increase in depreciation related to the arrival of new vessels. The very sharp increase (+144.8%) over the second half of 2010 comes from the increase in EBITDA and the size of the provisions set up in the previous half year. Financial income in the first half is negative at 62.7 million euros. The cost of net debt amounts to 30.2 million euros owing to a slight increase in the average debt. The change in currency exchange rates generated net financial expenses of 30.5 million euros, including a 14.9 million euros unrealized exchange loss. For the record, the change in foreign exchange rates in the first half of 2010 resulted in a reverse trend in the form of foreign exchange gains of 16.9 million euros. The Group share shows a net loss of 21.4 million euros in the first half. MARINE SERVICES H1 2011 H2 2010 Change H1 2011 / H2 2010 H1 2010 Change H1 2011 / H1 2010 Number of vessels (end of period) 406 390 +16 373 +33 Utilization rate 83.4% 79.8% +3.6 pts 79.3% +4.1 pts In millions of euros H1 2011 H2 2010 Change H1 2011 / H2 2010 H1 2010 Change H1 2011 / H1 2010 Revenues 376.1 345.1 +9.0% 315.2 +19.3% Direct costs (233.4) (219.0) +6.6% (187.5) +24.5% Operating margin 142.8 126.1 +13.2% 127.7 +11.8% General and administrative costs (42.9) (39.5) +8.6% (32.2) +33.0% Gross operating income (EBITDA) 100.0 87.5 +14.2% 95.4 +4.8% % of revenues 26.6% 25.4% 30.3% Compared with the first half of 2010, revenues for the period of the Marine Services Activity amount to 376.1 million euros, up 19.3% thanks to the continuous increase in utilization rates and the addition of 47 vessels to the fleet over the past twelve months. Compared with the second half of 2010, revenues are up 9%, based on a significant increase in utilization rates. Compared with the first half of the previous year, EBITDA for the period rose by 4.8% to 100 million euros. Compared with the low point of the second half of 2010, EBITDA is up 14.2%, and profitability measured by the ratio of EBITDA to Revenues rose 1.2 points to 26.6%.
- 3. 3 Results by segment Deepwater Offshore vessels H1 2011 H2 2010 Change H1 2011 / H2 2010 H1 2010 Change H1 2011 / H1 2010 Number of vessels (end of period) 70 69 +1 69 +1 Utilization rate 87.5% 89.5% -2 pts 90.7% -3.2 pts In millions of euros H1 2011 H2 2010 Change H1 2011 / H2 2010 H1 2010 Change H1 2011 / H1 2010 Revenues 149.2 155.0 -3.7% 153.7 -2.9% Direct costs (83.4) (86.0) -3.1% (80.5) +3.6% Operating margin 65.8 69.0 -4.6% 73.2 -10.1% General and administrative costs (17.0) (17.8) -4.5% (15.7) +8.2% Gross operating income (EBITDA) 48.8 50.9 -4.0% 57.5 -15.1% % of revenues 32.7% 32.8% 37.4% Compared with the first half of the previous year, revenues for the period earned by Deepwater Offshore vessels stand at 149.2 million euros, slightly down. Only two vessels were added to the fleet in the past twelve months, in accordance with the strategy of slowing down investments in a segment suffering from over- capacity, particularly for large AHTS. Concerning BOURBON, the utilization rate fell by 3.2 points, largely due to the a high numbers of Classification drydock periods and still an AHTS overcapacity in the Nord Sea that temporarily affect revenues and the margin. Compared with the second half of 2010, revenues are slightly down owing to a lower utilization rate. Compared with the first half of 2010, EBITDA stands at 48.8 million euros, down 15.1%. Compared with the second half of 2010, the decrease is limited to 4.0% as costs fell over the period. Shallow water Offshore vessels H1 2011 H2 2010 Change H1 2011 / H2 2010 H1 2010 Change H1 2011 / H1 2010 Number of vessels (end of period) 85 78 +7 67 +18 Utilization rate 87.5% 72.7% +14.8 pts 74.0% +13.5 pts In millions of euros H1 2011 H2 2010 Change H1 2011 / H2 2010 H1 2010 Change H1 2011 / H1 2010 Revenues 113.3 85.1 +33.2% 66.7 +70.0% Direct costs (72.0) (62.9) +14.4% (44.8) +60.5% Operating margin 41.4 22.2 +86.5% 21.8 +89.4% General and administrative costs (12.9) (9.7) +33.7% (6.8) +89.5% Gross operating income (EBITDA) 28.4 13.5 +111.0% 15.0 +89.4% % of revenues 25.1% 15.8% 22.5% Compared with the first half of 2010, revenues for the period posted by the Shallow water Offshore vessels amount to 113.3 million euros, up 70%. They reaped the benefits of the addition to the fleet of 18 new Bourbon Liberty vessels and the sharp increase in utilization rates (up 13.5 points). Compared with the second half of 2010, revenues are up more than 33% thanks to the increase in the fleet and the very significant improvement in utilization rates (+14.8 points) following, among other things, a return to normal of the business in Brazil (vessels blocked for administrative reasons) and the acceleration of the 25 year-old vessels substitution by modern tonnage.
- 4. 4 The EBITDA in the first half posted by Shallow water Offshore vessels stands at 28.4 million euros and accounts for more than 28% of the total EBITDA from Marine Services. Compared with the first half of 2010, the increase (+89.4%) is higher than the increase in revenues, and the ratio of EBITDA to Revenues improved by 2.6 points. Compared with the second half of 2010, EBITDA more than doubled (+111%), and the ratio of EBITDA to Revenues rose 9.3 points. Crewboats H1 2011 H2 2010 Change H1 2011 / H2 2010 H1 2010 Change H1 2011 / H1 2010 Number of vessels (end of period) 251 243 +8 237 +14 Utilization rate 80.8% 79.1% +1.7 pt 77.3% +3.5 pts In millions of euros H1 2011 H2 2010 Change H1 2011 / H2 2010 H1 2010 Change H1 2011 / H1 2010 Revenues 113.6 105.1 +8.1% 94.8 +19.8% Direct costs (78.0) (70.1) +11.3% (62.2) +25.4% Operating margin 35.6 35.0 +1.8% 32.6 +9.0% General and administrative costs (12.9) (12.0) +7.9% (9.7) +33.5% Gross operating income (EBITDA) 22.7 23.2 -2.0% 22.9 -1.0% % of revenues 20.0% 22.1% 24.2% Compared with the first half of 2010, revenues for the period earned by Crewboats amount to 113.6 million euros compared with the first half of 2010, up 19.8% thanks to the commissioning of 27 new vessels over the past twelve months and a 3.5 point improvement in the utilization rate. Compared with the second half of 2010, revenues rose by 8.1% and the utilization rate by 1.7 points. Compared with the first half of 2010, EBITDA remains nearly stable at 22.7 million euros, as costs rose more than proportionately from one year to the next. Compared with the second half of 2010, EBITDA is slightly down despite the growth in revenues, owing to an increase in costs due to an engine renewal campaign. SUBSEA SERVICES H1 2011 H2 2010 Change H1 2011 / H2 2010 H1 2010 Change H1 2011 / H1 2010 Number of vessels (end of period) 17 17 - 15 +2 Utilization rate 94.2% 91.3% +2.9 pts 85.4% +8.8 pts In millions of euros H1 2011 H2 2010 Change H1 2011 / H2 2010 H1 2010 Change H1 2011 / H1 2010 Revenues 82.4 81.7 +0.8% 67.9 +21.3% Direct costs (38.7) (44.4) -12.9% (36.2) +6.9% Operating margin 43.7 37.3 +17.1% 31.7 +37.7% General and administrative costs (9.4) (9.3) 0.9% (6.9) +35.2% Gross operating income (EBITDA) 34.6 28.0 +23.5% 24.8 +39.5% % of revenues 42.0% 34.2% 36.5%
- 5. 5 Compared to the first half of 2010, revenues for the period posted by the Subsea Services Activity stand at 82.4 million euros, showing an increase of 21.3%, resulting from the addition to the fleet of two new vessels and a substantial improvement in the utilization rate which, with an increase of 8.8 points, stands at 94.2%. Compared to the second half of 2010, revenues are fairly stable despite the 2.9 points increase in the utilization rate. Compared to the first half 2010, EBITDA for the period shows a sharp increase of 39.5% to 34.6 million euros, resulting from strong revenue growth combined with a gradual improvement in vessel availability. This brings the ratio of EBITDA to Revenues to 42%, up 5.5 points. Compared to the second half of 2010, EBITDA is up 23.5%, and the ratio of EBITDA to Revenues is up 7.8 points. BOURBON has continued for more than a year to position itself in the emerging wind farm markets in the North Sea, in Great Britain, then in Germany and recently in Portugal. OTHER In millions of euros H1 2011 H2 2010 Change H1 2011 / H2 2010 H1 2010 Change H1 2011 / H1 2010 Revenues 24.2 16.7 +44.7% 23.3 +3.8% Direct costs (15.9) (12.4) 28.5% (20.9) -23.8% Operating margin 8.2 4.3 +91.4% 2.4 General and administrative costs (0.7) (0.8) -13.1% (0.7) -5.5% Gross operating income (EBITDA) 7.6 3.5 +113.5% 1.7 % of revenues 31.3% 21.2% 7.2% “Other” mainly includes the activity of the cement carrier Endeavor, offshore vessels chartered externally as well as items not allocated to the other two Activities. OUTLOOK The market continues to show signs of recovery despite the recent financial crisis. Investments in the offshore oil and gas sector are being driven by steady per-barrel prices for several months (price of Brent still around USD 100 at the end of August) and are also proving necessary to replace the reserves. BOURBON activity should take full advantage of the 15% increase in investments by the oil companies, recently announced for 2011, a revision of the 12% initially forecast on the market compared with 2010. Orders for drilling rigs confirm the market’s optimistic outlook, with 61 orders in the first half of 2011 compared with only two over the same period in 2010. With these new drilling rigs, priority will undoubtedly be given to modern, multipurpose vessels operating in complete safety. The order books of the offshore construction companies are also filling up much faster. While the average utilization rate of the modern vessels on the market is rising, the utilization rate for vessels over 25 years old is continuing to decline, confirming the already proven trend of a preference among oil clients for chartering vessels that are modern, safer, more efficient and more reliable. The policy of efficient management of fuel consumption of vessels operating for clients, implemented as part of the cost-reduction operating strategy, will also be a considerable advantage in a context of high oil prices.
- 6. 6 At the same time as the gradual increase in utilization rates for modern vessels and in line with the increase in the rates of deepwater offshore supply vessels, which is already noticeable today, the market is expecting daily rates to rise as of end of 2011 and in 2012. It is logical to expect BOURBON to be one of the first companies to benefit from this. BOURBON’s strategy, which is based on a very modern and high-performance fleet, positions the Group very favorably to reap the benefit of the upcoming increase in charter rates. Finally, BOURBON’s 2011 results will continue to be affected by the euro/dollar exchange rate. ADDITIONAL INFORMATION The accounts for the first half of 2011 were closed by the Board of Directors on August 29, 2011. The accounts were subjected to a limited examination by the statutory auditors. In 2010, the Group completed the process of shifting its focus to offshore oil and gas marine services by selling bulk carriers, the Bulk transport operator activity and its sugar activity in Vietnam. The financial statements as of June 30, 2010 have been restated in accordance with IFRS 5. Restatement of the 2010 interim financial statements FINANCIAL CALENDAR - 3rd quarter 2011 financial information November 10, 2011 - 4th quarter and full-year 2011 revenue release February 8, 2012 - Presentation of 2011 annual results March 7, 2012 The financial data related to the first half 2011 results include : - this press release (as from 7.30am Paris local time) - the first half 2011 financial report (as from 7.30am Paris local time) - the live access to the press conference webcast including the Questions & Answers cession (at 9.00am Paris local time) - the global press conference video with direct access to each part (at 1.00pm Paris local time). All these elements are available on the dedicated “Conference” page on BOURBON’s website Click on the following link
- 7. 7 APPENDIX I Simplified consolidated balance sheet In millions of euros 06.30.2011 12.31.2010 06.30.2011 12.31.2010 Shareholder’s equity 1,368 1,468 Net properties and equipment 3,139 3,077 Financial debt > 1 year 1,434 1,504 Other non-current assets 84 80 Other long-term liabilities 84 96 TOTAL NON-CURRENT ASSETS 3,223 3,158 TOTAL NON-CURRENT LIABILITIES 1,518 1,600 Other current assets 477 423 Financial debt < 1 year 628 472 Cash and cash equivalents 161 210 Other current liabilities 347 266 TOTAL CURRENT ASSETS 638 633 TOTAL CURRENT LIABILITIES 975 738 Current assets held for sale - 15 Non-current liabilities held for sale - 0 TOTAL ASSETS 3,861 3,805 TOTAL LIABILITIES 3,861 3,805
- 8. 8 APPENDIX II Consolidated Cash Flow Statement In millions of euros H1 2011 H1 2010 Consolidated net income (loss) (25.9) 41.8 Cash flow (*) 86.1 134.8 Net cash flow from operating activities excluding discontinued operations Net cash flow from operating activities including discontinued operations (*) 64.0 64.0 55.4 102.2 Net cash flow consumed by investing activities (*) Of which acquisition of property, plant and equipment and intangible assets Of which sale of property, plant and equipment and intangible assets (166.9) 31.0 (121.5) (318.7) 71.0 (263.2) Net cash flow from financing activities (*) Of which increase (decrease) in borrowings Of which dividends paid to shareholders of the group Of which net financial interest paid (15.1) (53.2) (30.2) (98.6) 137.1 (52.9) (27.4) 50.2 Effect of the change in exchange rates (2.5) 10.9 Net cash increase (decrease) (*) (158.7) (100.0) Net cash at beginning of period Net cash at end of period Net cash increase (decrease) (*) (61.1) (219.7) (158.7) (68.9) (168.8) (100.0) (*) including discontinued operations
- 9. 9 APPENDIX III Average utilization rate of the BOURBON fleet Quarterly breakdown of the average daily rate for the BOURBON fleet Quarterly commissioning of vessels (in %) 2011 2010 Q2 Q1 Q4 Q3 Q2 Q1 Deepwater Offshore vessels 86.9 88.1 88.7 90.4 92.1 89.4 Shallow water Offshore vessels 90.2 84.8 74.2 71.0 75.4 72.4 Crewboats 81.4 80.5 80.5 77.4 78.6 75.9 Marine Services average utilization rate 84.2 82.7 80.7 78.7 80.6 77.9 Subsea Services average utilization rate 96.3 92.0 91.2 91.5 89.8 80.9 Total fleet average utilization rate 84.7 83.1 81.1 79.2 81.0 78.1 (in US$/day) 2011 2010 Q2 Q1 Q4 Q3 Q2 Q1 Deepwater Offshore vessels 19,154 18,835 18,637 19,244 19 978 19,406 Shallow water Offshore vessels 12,883 12,653 12,255 12,420 12,371 12,623 Crewboats 4,361 4,263 4,160 3,863 4,021 4,135 IMR vessels 32,379 31,842 31,485 32,491 32,999 33,707 (in number of vessels) 2011 2010 Q2 Q1 Q4 Q3 Q2 Q1 TOTAL COMMISSIONING OF VESSELS 11 10 12 16 18 15 Marine Services 11 10 11 15 18 14 Deepwater Offshore Shallow water Offshore Crewboats 1 5 5 0 3 7 - 4 7 1 6 8 1 8 9 - 8 6 Subsea Services / IMR 0 0 1 1 0 1
- 10. 10 Breakdown of half-year indicators Marine Services H1 2011 H1 2010 Change H2 2010 Revenues (in millions of euros) 376.1 315.2 +19.3% 345.1 Number of vessels (end of period) 406 373 +33 390 Average utilization rate 83.4% 79.3% +4.1 pts 79.8% Average daily rate (US$/d) 8,641 8,582 +0.7% 8,559 Of which Deepwater Offshore vessels H1 2011 H1 2010 Change H2 2010 Revenues (in millions of euros) 149.2 153.7 -2.9% 155.0 Number of vessels (end of period) 70 69 +1 69 Average utilization rate 87.5% 90.7% -3.2 pts 89.5% Average daily rate (US$/d) 18,994 19,725 -3.7% 18,935 Of which Shallow water Offshore vessels H1 2011 H1 2010 Change H2 2010 Revenues (in millions of euros) 113.3 66.7 +70% 85.1 Number of vessels (end of period) 85 67 +18 78 Average utilization rate 87.5% 74.0% +13.5 pts 72.7% Average daily rate (US$/d) 12,821 12,488 +2.7% 12,332 Of which Crewboats H1 2011 H1 2010 Change H2 2010 Revenues (in millions of euros) 113.6 94.8 +19.8% 105.1 Number of vessels (end of period) 251 237 +14 243 Average utilization rate 80.8% 77.3% +3.5 pts 79.1% Average daily rate (US$/d) 4,319 4,079 +5,9% 4,070 Subsea Services H1 2011 H1 2010 Change H2 2010 Revenues (in millions of euros) 82.4 67.9 +21.3% 81.7 Number of vessels (end of period) 17 15 +2 17 Average utilization rate 94.2% 85.4% +8.8 pts 91.3% Average daily rate (US$/d) 32,117 33,328 -3.6% 31,961
- 11. 11 Other key indicators About BOURBON BOURBON offers oil & gas companies with the most demanding requirements a comprehensive range of surface and subsea marine services for offshore oil & gas fields and wind farms, based on an extensive range of latest-generation vessels. The Group provides a local service through its 26 operating subsidiaries, close to clients and their operations, and it guarantees the highest standards of service quality and safety worldwide. BOURBON, a pure player in offshore, has two operating Activities: Marine Services and Subsea Services. BOURBON also protects the French coastline for the French Navy. Under the “BOURBON 2015 Leadership Strategy” plan, the company is investing US$2 billion in a large fleet and by 2015 it will have 600 innovative and high-performance offshore vessels. Classified by ICB (Industry Classification Benchmark) in the "Oil Services" sector, BOURBON is listed for trading on Euronext Paris, Compartment A, and is included in the Deferred Settlement Service SRD and in the SBF 120, CAC Mid 60 and Dow Jones Stoxx 600 indices. CONTACTS Publicis Consultants Jérôme Goaer +33 (0)1 44 82 46 24 - jerome.goaer@consultants.publicis.fr Caroline Decaux +33 (0)1 44 82 46 38 - caroline.decaux@consultants.publicis.fr BOURBON Investors – Analysts – Shareholders Relations Patrick Mangaud +33 (0)1 40 13 86 09 - patrick.mangaud@bourbon-online.com Communication Department Christa Roqueblave +33 (0)1 40 13 86 06 - christa.roqueblave@bourbon-online.com 2011 2010 Q2 Q1 Q4 Q3 Q2 Q1 Average €/US$ exchange rate for the quarter (in €) 1.44 1.37 1.33 1.29 1.27 1.38 €/US$ exchange rate at closing (in €) 1.45 1.42 1.34 1.36 1.23 1.35 Average price of Brent for the quarter (in US$/bl) 117 105 86 77 78 76