Download as PDF, PPTX


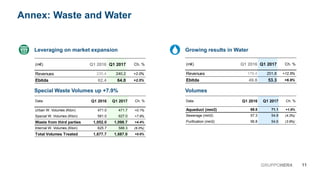


- Gruppo Hera reported strong growth in key financial figures for the first quarter of 2017, with EBITDA up 10.2%, EBIT up 9.7%, pre-tax profit up 13.2%, and net profit and EPS up 20.5% compared to the first quarter of 2016. - The growth was driven by organic expansion across Hera's business segments - waste, water networks, and energy - benefiting from increased volumes, market share gains, and operating efficiencies. - Acquisitions completed in early 2017 for the waste businesses of Aliplast and Teseco were not fully reflected in the first quarter results but will contribute starting in the second quarter and provide increased visibility and growth


